Skip Navigation LinksSkip Navigation Links
Centers for Disease Control and Prevention
Safer Healthier People
Blue White
Blue White
bottom curve
CDC Home Search Health Topics A-Z spacer spacer
spacer
Blue curve MMWR spacer
spacer
spacer

Notifiable Diseases/Deaths in Selected Cities Weekly Information

Figure I   Selected notifiable disease reports, comparison of provisional 4-week totals ending October 16, 1999, with historical data -- United States

Table I   Summary -- provisional cases of selected notifiable diseases, United States, cumulative, week ending October 16, 1999 (41st Week)

Table II   Provisional cases of selected notifiable diseases, United States, weeks ending October 16, 1999 and October 17, 1998 (41st Week)

Table III   Provisional cases of selected notifiable diseases preventable by vaccination, United States, weeks ending October 16, 1999 and October 17, 1998 (41st Week)

Table IV   Deaths in 122 U.S. cities, week ending October 16, 1999 (41st Week)


Figure I

Figure I
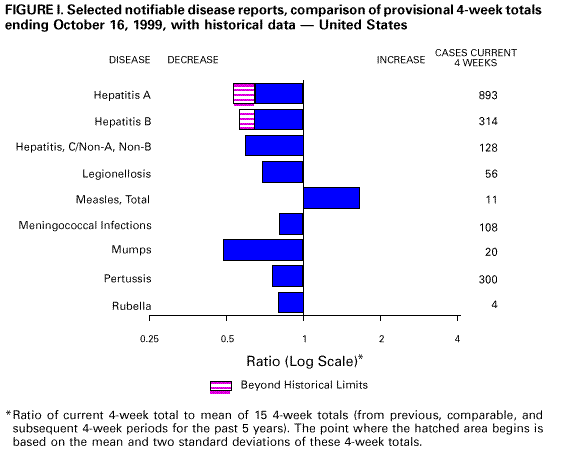
Return to top.

Table I
Note: To print large tables and graphs users may have to change their printer settings to landscape and use a small font size.
TABLE I. Summary -- provisional cases of selected notifiable diseases, United
States, cumulative, week ending October 16, 1999 (41st Week)
==================================================================================
                                             Cum. 1999
------------------------------------------------------
Anthrax                                              -
Brucellosis*                                        36
Cholera                                              5
Congenital rubella syndrome                          4
Cyclosporiasis*                                     48
Diphtheria                                           4
Encephalitis:  California*                          43
               eastern equine*                       5
               St. Louis*                            3
               western equine*                       -
Ehrlichiosis   human granulocytic (HGE)*           118
               human monocytic (HME)*               34
Hansen Disease*                                     78
Hantavirus pulmonary syndrome*+                     16
Hemolytic uremic syndrome, post-diarrheal*          77
HIV infection, pediatric*&                         109
Plague                                               5
Poliomyelitis, paralytic                             -
Psittacosis*                                        16
Rabies, human                                        -
Rocky Mountain spotted fever (RMSF)                432
Streptococcal disease, invasive Group A          1,665
Streptococcal toxic-shock syndrome*                 30
Syphilis, congenital@                              146
Tetanus                                             30
Toxic-shock syndrome                                94
Trichinosis                                          8
Typhoid fever                                      251
Yellow fever                                         -
------------------------------------------------------
-: no reported cases
 * Not notifiable in all states
 + Updated weekly from reports to the Division of Viral and Rickettsial
   Diseases, National Center for Infectious Diseases (NCID).
 & Updated monthly from reports to the Division of HIV/AIDS Prevention --
   Surveillance and Epidemiology, National Center for HIV, STD, and TB
   Prevention (NCHSTP), last update September 26, 1999.
 @ Updated from reports to the Division of STD Prevention, NCHSTP.

==================================================================================


Return to top.

Table II
Note: To print large tables and graphs users may have to change their printer settings to landscape and use a small font size.
TABLE II. (page 1) Provisional cases of selected notifiable diseases, United States, weeks ending
October 16, 1999, and October 17, 1998 (41st Week)

                                                                                                    Escherichia
                                                                                                   coli O157:H7*
                                                                                     -----------------------------------------
                          AIDS              Chlamydia          Cryptosporidiosis            NETSS                  PHLIS
                   -----------------   --------------------   -------------------    -------------------      ----------------
                     Cum.       Cum.        Cum.       Cum.       Cum.       Cum.        Cum.       Cum.       Cum.       Cum.
Reporting Area       1999**     1998        1999       1998       1999       1999        1999       1998       1999       1998
------------------------------------------------------------------------------------------------------------------------------
UNITED STATES      34,088     35,254     447,781    463,162      1,733      3,137       2,573      2,381      1,672      1,874

NEW ENGLAND         1,698      1,354      15,816     16,053        119        135         270        282        232        238
Maine                  54         24         738        783         23         28          34         33          -          -
N.H.                   36         25         750        785         17         14          28         42         29         42
Vt.                    13         17         376        328         32         22          28         18         15         17
Mass.               1,116        684       7,248      6,590         44         64         155        130        115        135
R.I.                   77         98       1,814      1,807          3          7          25         11          6          1
Conn.                 402        506       4,890      5,760          -          -           U         48         67         43

MID. ATLANTIC       8,684      9,591      50,205     48,082        264        476         214        259         60         81
Upstate N.Y.          952      1,103           N          N        123        285         165        186          -          -
N.Y. City           4,588      5,419      21,963     20,800        109        170           7         12         15         12
N.J.                1,619      1,753       8,087      9,266         22         21          42         61         32         48
Pa.                 1,525      1,316      20,155     18,016         10          N           N          N         13         21

E.N. CENTRAL        2,280      2,565      63,857     78,115        392        623         538        382        396        315
Ohio                  345        549      18,521     20,951         47         60         185        100        157         59
Ind.                  258        412       8,038      8,676         33         50          74         81         46         46
Ill.                1,108        986      21,533     21,146         17         74         178        101         81         73
Mich.                 456        466      15,765     16,435         42         34         101        100         68         62
Wis.                  113        152           U     10,907        253        405           N          N         44         75

W.N. CENTRAL          770        661      26,244     27,435        179        243         508        402        303        361
Minn.                 138        135       5,396      5,539         67         79         200        175        152        193
Iowa                   69         58       3,154      3,492         51         61         102         81         57         51
Mo.                   370        310       9,298      9,986         24         20          41         41         55         57
N. Dak.                 6          4         325        804         16         27          16         10         14         15
S. Dak.                14         13       1,244      1,205          6         19          38         25         13         32
Nebr.                  60         60       2,601      2,137         14         31          90         42          -          -
Kans.                 113         81       4,226      4,272          1          6          21         28         12         13

S. ATLANTIC         9,423      9,157      94,346     88,965        316        280         271        194        139        151
Del.                  129        112       1,968      2,020          -          3           6          -          3          2
Md.                 1,113      1,300       7,963      5,835         14         18          26         35          2         14
D.C.                  412        690           N          N          8         21           -          1          U          U
Va.                   608        687      10,964     11,053         21         20          63          N         48         50
W. Va.                 53         68       1,204      1,891          3          1          10          8          6          8
N.C.                  629        637      17,832     17,443         19          N          59         46         46         45
S.C.                  797        598       9,850     13,656          -          -          19         11         14          8
Ga.                 1,382        979      21,374     18,476        115         90          28         62          -          -
Fla.                4,300      4,086      23,191     18,591        136        127          60         31         20         24

E.S. CENTRAL        1,536      1,440      36,177     32,073         24         22         103        103         53         59
Ky.                   214        221       5,917      4,991          6         10          34         32          -          -
Tenn.                 588        519      11,088     10,698          6          7          43         45         33         38
Ala.                  405        395      10,137      7,901         10          N          21         21         16         18
Miss.                 329        305       9,035      8,483          2          5           5          5          4          3

W.S. CENTRAL        3,524      4,187      66,528     70,392         66        869          89         81         94         90
Ark.                  132        159       4,690      3,079          1          6          12         10          8         10
La.                   663        705      10,879     11,554         22         14           9          4         13          6
Okla.                 101        238       6,121      7,794          9          N          20         13         17          7
Tex.                2,628      3,085      44,838     47,965         34        849          48         54         56         67

MOUNTAIN            1,343      1,230      25,008     25,778         84        118         247        309        134        216
Mont.                   8         23       1,195      1,041         10         10          20         15          -          5
Idaho                  19         19       1,355      1,577          7         17          39         36          8         23
Wyo.                   10          1         609        536          1          2          14         52          5         55
Colo.                 235        230       4,845      6,381         11         16          90         68         75         53
N. Mex.                74        178       2,943      2,793         38         46          10         17          5         18
Ariz.                 697        501       9,889      9,183         10         18          28         41         19         26
Utah                  116        101       1,714      1,660          N          N          32         65         20         21
Nev.                  184        177       2,458      2,607          7          9          14         15          2         15

PACIFIC             4,830      5,069      69,600     76,269        289        371         333        369        261        363
Wash.                 285        331       9,353      8,731          N          N         131         80        119        108
Oreg.                 151        138       4,959      4,315         86         63          65         95         61         91
Calif.              4,319      4,452      51,549     59,728        203        305         128        190         71        150
Alaska                 13         17       1,497      1,489          -          -           1          4          1          -
Hawaii                 62        131       2,242      2,006          -          3           8          -          9         14

Guam                    5          -         302        327          -          -           N          N          U          U
P.R.                1,013      1,244           U          U          -          N           5          5          U          U
V.I.                   25         24           U          U          U          U           U          U          U          U
Amer. Samoa             -          -           U          U          U          U           U          U          U          U
C.N.M.I.                -          -           U          U          U          U           U          U          U          U
------------------------------------------------------------------------------------------------------------------------------
N: Not notifiable    U: Unavailable    -: no reported cases    C.N.M.I.: Commonwealth of North Mariana Islands

 * Individual cases may be reported through both the National Electronic Telecommunications System for Surveillance (NETSS)
   and the Public Health Laboratory Information System (PHLIS).
** Updated monthly from reports to the Division of HIV/AIDS Prevention -- Surveillance and Epidemiology, National Center for HIV,
   STD, and TB Prevention, last update September 26, 1999.

=======================================================================================================================================================

TABLE II. (page 2) Provisional cases of selected notifiable diseases, United States, weeks ending
October 16, 1999, and October 17, 1998 (41st Week)

                                            Hepatitis                                       Lyme
                       Gonorrhea             C/NA,NB             Legionellosis             Disease
                   -----------------   --------------------   -------------------    -------------------
                     Cum.       Cum.        Cum.       Cum.       Cum.       Cum.        Cum.       Cum.
Reporting Area       1999       1998        1999       1998       1999       1998        1999       1998
--------------------------------------------------------------------------------------------------------
UNITED STATES     245,721    275,632       2,615      2,621        671      1,035       8,669     13,157

NEW ENGLAND         4,831      4,768          59         53         59         70       3,063      4,118
Maine                  42         54           2          -          3          1          41         70
N.H.                   88         74           -          -          6          5          16         36
Vt.                    37         32           6          4         13          5          18         11
Mass.               1,999      1,737          48         46         19         30         946        653
R.I.                  469        298           3          3          7         19         401        444
Conn.               2,196      2,573           -          -         11         10       1,641      2,904

MID. ATLANTIC      29,586     29,711         107        173        129        256       4,160      7,178
Upstate N.Y.        5,360      5,523          72         86         49         78       3,027      3,392
N.Y. City           9,463      9,391           -          -          9         33          29        197
N.J.                5,042      6,250           -          U         13         15         390      1,538
Pa.                 9,721      8,547          35         87         58        130         714      2,051

E.N. CENTRAL       42,601     53,959       1,319        565        187        344         101        675
Ohio               11,132     13,623           3          7         61        108          66         35
Ind.                4,425      5,106           1          5         31         59          19         33
Ill.               16,054     17,623          38         37         10         47          10         14
Mich.              10,990     12,629         686        385         56         68           1         12
Wis.                    U      4,978         591        131         29         62           5        581

W.N. CENTRAL       10,720     13,408         157         35         38         58         178        187
Minn.               2,072      2,118           7          9          6          6         115        142
Iowa                  834      1,185           -          8         11          9          19         23
Mo.                 4,686      6,975         139         12         14         15          21         11
N. Dak.                31         66           -          -          1          -           1          -
S. Dak.               143        185           -          -          2          3           -          -
Nebr.               1,128        876           5          4          4         18          10          3
Kans.               1,826      2,003           6          2          -          7          12          8

S. ATLANTIC        70,363     74,153         176         89        107        114         908        749
Del.                1,229      1,173           1          -         10         12          25         57
Md.                 6,375      7,143          37         12         24         28         652        544
D.C.                2,969      3,450           1          -          3          6           3          4
Va.                 7,160      7,388          10         11         26         16         106         55
W. Va.                363        691          17          6          N          N          15         11
N.C.               15,841     15,185          33         19         13         11          63         48
S.C.                5,679      8,680          22          5          7         10           5          4
Ga.                14,359     15,789           1          9          1          8           -          5
Fla.               16,388     14,654          54         27         23         23          39         21

E.S. CENTRAL       29,057     30,892         213        243         35         55          69         93
Ky.                 2,686      2,910          15         19         18         26           8         23
Tenn.               8,973      9,367          80        145         14         17          30         41
Ala.                9,125     10,116           2          4          3          5          18         16
Miss.               8,273      8,499         116         75          -          7          13         13

W.S. CENTRAL       37,355     43,189         186        430          6         27          28         19
Ark.                2,452      3,191          11         16          -          1           4          6
La.                 8,653      9,823         102         73          2          2           -          4
Okla.               2,988      4,272          14         12          3         12           4          2
Tex.               23,262     25,903          59        329          1         12          20          7

MOUNTAIN            7,321      7,202         122        325         41         62          16         13
Mont.                  39         32           5          7          -          2           -          -
Idaho                  68        140           6         86          2          2           5          4
Wyo.                   24         27          37         79          -          1           3          1
Colo.               1,846      1,655          20         25         11         15           -          -
N. Mex.               597        705           7         82          1          2           1          4
Ariz.               3,559      3,309          33          8          6         14           -          -
Utah                  170        182           6         19         15         20           5          -
Nev.                1,018      1,152           8         19          6          6           2          4

PACIFIC            13,887     18,350         276        708         69         49         146        125
Wash.               1,623      1,534          13         20         11          9           7          7
Oreg.                 711        633          17         16          N          N          11         18
Calif.             10,987     15,515         246        618         57         38         128         99
Alaska                242        253           -          -          1          1           -          1
Hawaii                324        415           -         54          -          1           N          N

Guam                   39         54           1          1          -          2           -          1
P.R.                  247        300           -          -          -          -           N          N
V.I.                    U          U           U          U          U          U           U          U
Amer. Samoa             U          U           U          U          U          U           U          U
C.N.M.I.                U          U           U          U          U          U           U          U

--------------------------------------------------------------------------------------------------------
N: Not notifiable    U: Unavailable    -: no reported cases
=======================================================================================================================================================

TABLE II. (page 3) Provisional cases of selected notifiable diseases, United States, weeks ending
October 16, 1999, and October 17, 1998 (41st Week)

                                                                            Salmonellosis*
                                                              ------------------------------------------
                        Malaria           Rabies, Animal             NETSS                  PHLIS
                   -----------------   --------------------   -------------------    -------------------
                     Cum.       Cum.        Cum.       Cum.       Cum.       Cum.        Cum.       Cum.
Reporting Area       1999       1998        1999       1998       1999       1998        1999       1998
--------------------------------------------------------------------------------------------------------
UNITED STATES         991      1,169       4,696      6,035     28,297     32,937      22,311     27,913

NEW ENGLAND            50         48         714      1,207      1,361      1,987       1,392      1,909
Maine                   3          4         133        199        116        144          83         53
N.H.                    2          5          48         71        113        154         120        196
Vt.                     4          1          84         55         78        111          73         86
Mass.                  15         16         170        422        949      1,114         718      1,139
R.I.                    4          4          76         78        105        107          52         34
Conn.                  22         18         203        382          U        357         346        401

MID. ATLANTIC         220        353         865      1,304      3,137      5,334       2,955      4,944
Upstate N.Y.           56         78         642        914      1,043      1,290         860      1,165
N.Y. City              99        200           U          U      1,060      1,609         853      1,291
N.J.                   44         49         150        173        508      1,146         535      1,141
Pa.                    21         26          73        217        526      1,289         707      1,347

E.N. CENTRAL           94        124         135        114      4,197      5,184       2,812      3,951
Ohio                   18         14          32         52      1,027      1,251         867        960
Ind.                   18         10          12          9        409        551         329        448
Ill.                   20         50           9          N      1,328      1,596         399      1,246
Mich.                  33         41          79         34        801        945         782        860
Wis.                    5          9           3         19        632        841         435        437

W.N. CENTRAL           62         75         582        608      1,822      1,865       1,792      1,940
Minn.                  33         42          88        101        525        448         588        532
Iowa                   13          7         137        131        224        317         158        254
Mo.                    12         14          13         34        563        512         751        710
N. Dak.                 -          2         125        121         41         48          47         67
S. Dak.                 -          -         129        139         75         96          58        102
Nebr.                   -          1           3          7        175        153           -         35
Kans.                   4          9          87         75        219        291         190        240

S. ATLANTIC           283        244       1,727      1,983      6,840      6,562       4,229      4,971
Del.                    1          3          34         39        107         66         137        105
Md.                    78         73         331        388        717        747         765        730
D.C.                   16         16           -          -         62         64           U          U
Va.                    57         48         450        474      1,063        880         789        739
W. Va.                  2          2          93         64        136        121         126        124
N.C.                   26         23         362        491      1,022        948       1,051      1,148
S.C.                   15          6         123        121        533        492         349        444
Ga.                    21         32         178        247      1,120      1,286         651      1,229
Fla.                   67         41         156        159      2,080      1,958         361        452

E.S. CENTRAL           21         25         221        234      1,470      1,816         880      1,322
Ky.                     7          5          33         27        323        306           -        124
Tenn.                   7         13          79        122        324        471         429        582
Ala.                    6          5         108         83        473        562         374        492
Miss.                   1          2           1          2        350        477          77        124

W.S. CENTRAL           15         32          86         26      2,638      3,528       2,723      2,579
Ark.                    2          1          14         26        514        464         120        300
La.                    10         13           -          -        334        472         472        635
Okla.                   2          3          72          N        355        378         271        180
Tex.                    1         15           -          -      1,435      2,214       1,860      1,464

MOUNTAIN               39         55         169        223      2,440      2,053       1,698      1,738
Mont.                   4          1          52         47         50         70           1         42
Idaho                   3          7           -          N         89         95          57         77
Wyo.                    1          -          41         55         52         57          22         50
Colo.                  14         16           1         38        602        461         615        438
N. Mex.                 2         12           8          6        286        251         217        222
Ariz.                   9          8          55         45        790        634         650        599
Utah                    3          1           7         26        419        293          83        122
Nev.                    3         10           5          6        152        192          53        188

PACIFIC               207        213         197        336      4,392      4,608       3,830      4,559
Wash.                  22         17           -          -        515        397         670        541
Oreg.                  19         14           1          7        367        252         419        276
Calif.                158        176         189        306      3,181      3,694       2,486      3,469
Alaska                  1          2           7         23         47         50          15         31
Hawaii                  7          4           -          -        282        215         240        242

Guam                    -          2           -          -         24         29           U          U
P.R.                    -          -          57         42        255        585           U          U
V.I.                    U          U           U          U          U          U           U          U
Amer. Samoa             U          U           U          U          U          U           U          U
C.N.M.I.                U          U           U          U          U          U           U          U

--------------------------------------------------------------------------------------------------------
N: Not notifiable    U: Unavailable    -: no reported cases

* Individual cases may be reported through both the National Electronic Telecommunications System for Surveillance (NETSS)
  and the Public Health Laboratory Information System (PHLIS).
=======================================================================================================================================================

TABLE II. (page 4) Provisional cases of selected notifiable diseases, United States, weeks ending
October 16, 1999, and October 17, 1998 (41st Week)

                                  Shigellosis*
                    ---------------------------------------          Syphilis
                         NETSS                  PHLIS          (Primary & Secondary)      Tuberculosis
                    ----------------       ----------------    ---------------------    ------------------
                     Cum.       Cum.        Cum.       Cum.       Cum.       Cum.        Cum.       Cum.
Reporting Area       1999       1998        1999       1998       1999       1998        1999**     1998**
----------------------------------------------------------------------------------------------------------
UNITED STATES      11,814     16,457       5,640      9,382      5,000      5,645      11,071     13,022

NEW ENGLAND           564        361         387        321         44         63         315        343
Maine                   5         12           -          -          -          1          13         11
N.H.                   16         15          14         18          -          2          10          -
Vt.                     6          6           4          -          3          4           1          4
Mass.                 515        240         315        231         26         35         190        196
R.I.                   22         30           9         13          2          1          33         41
Conn.                   U         58          45         59         13         20          68         91

MID. ATLANTIC         693      1,995         370      1,502        204        250       2,020      2,256
Upstate N.Y.          232        468          45        164         24         33         248        285
N.Y. City             220        610          82        542         67         57       1,091      1,114
N.J.                  170        596         121        560         48         79         408        486
Pa.                    71        321         122        236         65         81         273        371

E.N. CENTRAL        2,155      2,306       1,083      1,213        930        816       1,038      1,291
Ohio                  358        417         114        106         74        119         198        189
Ind.                  235        140          76         35        356        161          72        129
Ill.                  832      1,262         592      1,014        315        342         462        604
Mich.                 351        226         233          4        185        141         229        287
Wis.                  379        261          68         54          U         53          77         82

W.N. CENTRAL          927        859         575        503        102        108         345        365
Minn.                 200        263         198        292          9          7         122        116
Iowa                   46         58          23         40          9          1          37         28
Mo.                   569        107         313         82         67         82         134        142
N. Dak.                 2          7           2          3          -          -           6          8
S. Dak.                11         31           5         21          -          1          12         16
Nebr.                  62        335           -         19          7          4          15         16
Kans.                  37         58          34         46         10         13          19         39

S. ATLANTIC         1,957      3,414         376      1,060      1,590      2,059       2,326      2,379
Del.                   12         27           8         25          6         19          12         32
Md.                   132        173          46         61        294        550         213        247
D.C.                   45         25           U          U         54         71          34         87
Va.                   109        162          43         78        123        120         221        222
W. Va.                  8         11           4          7          2          2          33         31
N.C.                  167        240          72        127        400        596         348        339
S.C.                  106        146          51         68        217        240         206        227
Ga.                   185        896          37        214        248        231         450        414
Fla.                1,193      1,734         115        480        246        230         809        780

E.S. CENTRAL          897        829         444        616        913        978         704        909
Ky.                   212        108           -         45         81         84         148        132
Tenn.                 508        278         387        364        507        459         257        292
Ala.                   94        397          47        200        182        222         243        305
Miss.                  83         46          10          7        143        213          56        180

W.S. CENTRAL        1,735      3,145       1,716      1,017        780        856       1,232      1,930
Ark.                   70        169          23         54         57         93         135        114
La.                   118        247          99        222        200        341           U        211
Okla.                 421        346         143         96        151         76         101        141
Tex.                1,126      2,383       1,451        645        372        346         996      1,464

MOUNTAIN              873        988         517        614        190        202         321        434
Mont.                   7          8           -          3          1          -          10         18
Idaho                  23         18           7         13          1          2          14          7
Wyo.                    3          3           1          1          -          1           3          4
Colo.                 154        164         120        128          2         10           U         50
N. Mex.               103        240          62        136          9         22          48         54
Ariz.                 456        473         309        290        169        151         177        157
Utah                   52         38          12         28          2          3          32         45
Nev.                   75         44           6         15          6         13          37         99

PACIFIC             2,013      2,560         172      2,536        247        313       2,770      3,115
Wash.                  90        164          79        144         57         27         156        206
Oreg.                  76        121          67        119          9          4          86        111
Calif.              1,819      2,235           -      2,235        178        278       2,350      2,614
Alaska                  2          6           2          3          1          1          43         43
Hawaii                 26         34          24         35          2          3         135        141

Guam                    8         31           U          U          1          1          11         75
P.R.                   62         46           U          U        131        150          41        122
V.I.                    U          U           U          U          U          U           U          U
Amer. Samoa             U          U           U          U          U          U           U          U
C.N.M.I.                U          U           U          U          U          U           U          U

----------------------------------------------------------------------------------------------------------
N: Not notifiable    U: Unavailable    -: no reported cases

 * Individual cases may be reported through both the National Electronic Telecommunications System for Surveillance (NETSS)
   and the Public Health Laboratory Information System (PHLIS).
** Cumulative reports of provisional tuberculosis cases for 1998 and 1999 are unavailable ('U') for some
   areas using the Tuberculosis Information Management System (TIMS).

=======================================================================================================================================================


Return to top.

Table III
Note: To print large tables and graphs users may have to change their printer settings to landscape and use a small font size.
TABLE III. (page 1) Provisional cases of selected notifiable diseases preventable by vaccination, United
States, weeks ending October 16, 1999, and October 17, 1998 (41st Week)

                                                Hepatitis (Viral), by type                                    Measles (Rubeola)
                     H. influenzae,       ---------------------------------------        ------------------------------------------------------------
                        invasive                  A                     B                  Indigenous            Imported*                 Total
                    ----------------      -----------------     -----------------        ---------------       ---------------        ---------------
                     Cum.       Cum.        Cum.       Cum.       Cum.       Cum.                   Cum.                  Cum.        Cum.       Cum.
Reporting Area       1999**     1998        1999       1998       1999       1998        1999       1999       1999       1999        1999       1998
-----------------------------------------------------------------------------------------------------------------------------------------------------
UNITED STATES         929        865      12,152     17,755      5,025      7,671           -         50          -         23          73         76

NEW ENGLAND            75         59         219        237         76        168           -          6          -          5          11          3
Maine                   5          2          11         16          1          2           -          -          -          -           -          -
N.H.                   17         10          15         11         13         15           -          -          -          1           1          -
Vt.                     5          6          16         14          2          8           -          -          -          -           -          1
Mass.                  27         35          64        106         32         59           -          5          -          3           8          2
R.I.                    5          5          14         14         28         58           -          -          -          -           -          -
Conn.                  16          1          99         76          -         26           -          1          -          1           2          -

MID. ATLANTIC         139        138         733      1,382        512        995           -          -          -          2           2         14
Upstate N.Y.           68         47         215        284        153        189           -          -          -          2           2          2
N.Y. City              31         37         212        487        157        349           -          -          -          -           -          -
N.J.                   39         47          57        283         40        173           -          -          -          -           -          8
Pa.                     1          7         249        328        162        284           -          -          -          -           -          4

E.N. CENTRAL          142        149       2,280      2,855        523      1,166           -          1          -          1           2         15
Ohio                   50         45         542        258         78         64           -          -          -          -           -          1
Ind.                   20         36          95        125         36         92           -          1          -          -           1          3
Ill.                   59         52         516        645          1        199           -          -          -          -           -          -
Mich.                  13          9       1,091      1,658        403        375           -          -          -          1           1         10
Wis.                    -          7          36        169          5        436           -          -          -          -           -          1

W.N. CENTRAL           79         75         630      1,176        249        326           -          -          -          -           -          -
Minn.                  38         58          61        108         41         41           -          -          -          -           -          -
Iowa                    9          2         117        379         33         48           -          -          -          -           -          -
Mo.                    23          8         352        551        133        191           -          -          -          -           -          -
N. Dak.                 1          -           2          3          -          4           U          -          U          -           -          -
S. Dak.                 1          -           8         21          1          2           -          -          -          -           -          -
Nebr.                   3          1          50         25         14         18           -          -          -          -           -          -
Kans.                   4          6          40         89         27         22           U          -          U          -           -          -

S. ATLANTIC           209        158       1,652      1,546        995        807           -          9          -          6          15          8
Del.                    -          -           2          3          1          3           U          -          U          -           -          1
Md.                    54         50         297        333        139        115           -          -          -          -           -          1
D.C.                    4          -          54         55         21         11           U          -          U          -           -          -
Va.                    16         16         138        173         74         84           -          9          -          3          12          2
W. Va.                  6          6          32          6         22          8           -          -          -          -           -          -
N.C.                   29         23         132         99        194        173           -          -          -          1           1          -
S.C.                    5          3          41         33         63         31           -          -          -          -           -          -
Ga.                    55         35         400        485        143        127           -          -          -          -           -          2
Fla.                   40         25         556        359        338        255           -          -          -          2           2          2

E.S. CENTRAL           52         48         324        323        341        404           -          2          -          -           2          2
Ky.                     6          7          55         27         34         40           -          2          -          -           2          -
Tenn.                  28         28         142        186        170        226           -          -          -          -           -          1
Ala.                   15         11          45         59         68         62           -          -          -          -           -          1
Miss.                   3          2          82         51         69         76           -          -          -          -           -          -

W.S. CENTRAL           45         44       2,357      3,120        702      1,693           -          5          -          4           9          -
Ark.                    2          -          46         73         38         89           -          -          -          -           -          -
La.                     7         20          73         76         77        121           U          -          U          -           -          -
Okla.                  32         22         383        471        107         71           -          -          -          -           -          -
Tex.                    4          2       1,855      2,500        480      1,412           -          5          -          4           9          -

MOUNTAIN               96         96       1,069      2,687        474        684           -          3          -          -           3          -
Mont.                   2          -          17         85         17          5           -          -          -          -           -          -
Idaho                   1          -          35        221         25         38           -          -          -          -           -          -
Wyo.                    1          1           7         33         12          7           -          -          -          -           -          -
Colo.                  11         21         187        263         77         87           -          -          -          -           -          -
N. Mex.                18          5          42        124        149        267           -          -          -          -           -          -
Ariz.                  52         46         625      1,607        127        149           -          1          -          -           1          -
Utah                    8          4          42        163         27         62           -          2          -          -           2          -
Nev.                    3         19         114        191         40         69           U          -          U          -           -          -

PACIFIC                92         98       2,888      4,429      1,153      1,428           -         24          -          5          29         34
Wash.                   4          8         263        853         55         86           -          -          -          -           -          1
Oreg.                  36         37         212        348         78        150           -          9          -          -           9          -
Calif.                 40         43       2,393      3,162        994      1,167           -         15          -          4          19          7
Alaska                  5          3           8         16         14         12           -          -          -          -           -         26
Hawaii                  7          7          12         50         12         13           -          -          -          1           1          -

Guam                    -          -           2          1          2          2           U          1          U          -           1          -
P.R.                    1          2         112         51        102        198           -          -          -          -           -          -
V.I.                    U          U           U          U          U          U           U          U          U          U           U          U
Amer. Samoa             U          U           U          U          U          U           U          U          U          U           U          U
C.N.M.I.                U          U           U          U          U          U           U          U          U          U           U          U
-----------------------------------------------------------------------------------------------------------------------------------------------------
N: Not notifiable    U: Unavailable     -: no reported cases

 * For imported measles, cases include only those resulting from importation from other countries.
** Of 176 cases among children aged <5 years, serotype was reported for 90 and of those, 24 were type b.
=======================================================================================================================================================

TABLE III. (page 2) Provisional cases of selected notifiable diseases preventable by vaccination, United
States, weeks ending October 16, 1999, and October 17, 1998 (41st Week)

                     Meningococcal
                        Disease                      Mumps                           Pertussis                          Rubella
                   -----------------        --------------------------       ---------------------------       ---------------------------
                     Cum.       Cum.                   Cum.       Cum.                   Cum.       Cum.                  Cum.        Cum.
Reporting Area       1999       1998        1999       1999       1998       1999        1999       1998       1999       1999        1998
------------------------------------------------------------------------------------------------------------------------------------------
UNITED STATES       1,897      2,117           4        263        547         66       4,246      5,084          1        226         341

NEW ENGLAND            94         94           -          6          7          7         509        822          -          7          38
Maine                   5          5           -          -          -          -           -          5          -          -           -
N.H.                   12         11           -          1          -          1          78         88          -          -           -
Vt.                     4          5           -          1          -          -          52         66          -          -           -
Mass.                  55         41           -          4          4          6         341        616          -          7           8
R.I.                    4          7           -          -          1          -          24          9          -          -           1
Conn.                  14         25           -          -          2          -          14         38          -          -          29

MID. ATLANTIC         168        222           -         28        178          4         688        506          -         22         146
Upstate N.Y.           52         59           -          9          6          4         602        269          -         18         114
N.Y. City              44         27           -          3        155          -          10         31          -          -          18
N.J.                   39         51           -          -          6          -          12         18          -          1          13
Pa.                    33         85           -         16         11          -          64        188          -          3           1

E.N. CENTRAL          331        322           1         33         69         10         325        639          -          2           -
Ohio                  119        116           1         14         26          7         173        225          -          -           -
Ind.                   55         56           -          4          6          -          54        113          -          1           -
Ill.                   87         85           -          8          9          -          49         86          -          1           -
Mich.                  40         38           -          7         26          3          45         57          -          -           -
Wis.                   30         27           -          -          2          -           4        158          -          -           -

W.N. CENTRAL          210        183           1         12         28          7         297        437          -        123          35
Minn.                  45         29           -          1         12          -         154        242          -          5           -
Iowa                   39         34           1          6         10          4          46         62          -         29           -
Mo.                    82         67           -          2          3          3          50         30          -          2           2
N. Dak.                 3          5           U          -          2          U           4          3          U          -           -
S. Dak.                11          7           -          -          -          -           5          8          -          -           -
Nebr.                  12         13           -          -          -          -           3         15          -         87           -
Kans.                  18         28           U          3          1          U          35         77          U          -          33

S. ATLANTIC           334        346           1         43         43         12         340        268          -         36          18
Del.                    7          2           U          -          -          U           4          5          U          -           -
Md.                    48         25           -          3          -          -          97         52          -          1           1
D.C.                    1          1           U          2          -          U           -          1          U          -           -
Va.                    44         31           -          9          7          -          19         27          -          -           1
W. Va.                  6         14           -          -          -          -           2          1          -          -           -
N.C.                   37         48           -          8         10          2          85         89          -         35          13
S.C.                   41         49           -          4          6          -          15         25          -          -           -
Ga.                    52         79           -          4          1          1          35         22          -          -           -
Fla.                   98         97           1         13         19          9          83         46          -          -           3

E.S. CENTRAL          119        165           -         11         13          -          69        108          -          1           2
Ky.                    26         29           -          -          -          -          20         48          -          -           -
Tenn.                  43         58           -          -          1          -          28         32          -          -           2
Ala.                   29         44           -          8          7          -          18         24          -          1           -
Miss.                  21         34           -          3          5          -           3          4          -          -           -

W.S. CENTRAL          146        257           -         30         53          8         148        314          1         15          87
Ark.                   31         27           -          -         11          1          18         63          1          6           -
La.                    34         50           U          3          6          U           3          8          U          -           -
Okla.                  26         35           -          1          -          -          12         31          -          -           -
Tex.                   55        145           -         26         36          7         115        212          -          9          87

MOUNTAIN              121        118           -         23         35         16         565        895          -         16           5
Mont.                   2          4           -          -          -          -           2          9          -          -           -
Idaho                  10          9           -          1          4          1         130        211          -          -           -
Wyo.                    4          5           -          -          1          -           2          8          -          -           -
Colo.                  31         22           -          5          6         11         163        217          -          1           -
N. Mex.                13         24           N          N          N          2         110         86          -          -           1
Ariz.                  41         37           -          7          6          2          98        179          -         13           1
Utah                   13         10           -          5          5          -          55        146          -          1           2
Nev.                    7          7           U          5         13          U           5         39          U          1           1

PACIFIC               374        410           1         77        121          2       1,305      1,095          -          4          10
Wash.                  59         58           -          2          8          -         581        266          -          -           5
Oreg.                  65         70           N          N          N          2          44         75          -          -           -
Calif.                240        274           1         61         88          -         648        725          -          4           3
Alaska                  5          3           -          2          2          -           4         14          -          -           -
Hawaii                  5          5           -         12         23          -          28         15          -          -           2

Guam                    2          2           U          1          5          U           1          1          U          -           -
P.R.                    5          9           -          -          3          -          16          4          -          -          12
V.I.                    U          U           U          U          U          U           U          U          U          U           U
Amer. Samoa             U          U           U          U          U          U           U          U          U          U           U
C.N.M.I.                U          U           U          U          U          U           U          U          U          U           U

------------------------------------------------------------------------------------------------------------------------------------------
N: Not notifiable    U: Unavailable     -: no reported cases

=======================================================================================================================================================


Return to top.

Table IV
Note: To print large tables and graphs users may have to change their printer settings to landscape and use a small font size.
TABLE IV. Deaths in 122 U.S. cities,* week ending
October 16, 1999 (41st Week)
===================================================================================================================================
                                                 All Causes, By Age (Years)
                          ------------------------------------------------------------------------        P&I**
Reporting Area            All Ages         >=65        45-64       25-44         1-24           <1        Total
---------------------------------------------------------------------------------------------------------------
NEW ENGLAND                    545          381          107          33           12           12           41
Boston, Mass.                  151           90           38          12            7            4            8
Bridgeport, Conn.               39           28            7           3            1            -            -
Cambridge, Mass.                21           16            4           -            1            -            1
Fall River, Mass.               26           21            5           -            -            -            1
Hartford, Conn.                  U            U            U           U            U            U            U
Lowell, Mass.                   22           16            3           3            -            -            3
Lynn, Mass.                     20           16            2           2            -            -            1
New Bedford, Mass.              23           21            2           -            -            -            3
New Haven, Conn.                42           26            7           5            -            4            5
Providence, R.I.                70           53           10           4            -            3            6
Somerville, Mass.                5            3            2           -            -            -            -
Springfield, Mass.              44           33            8           1            2            -            2
Waterbury, Conn.                21           15            6           -            -            -            2
Worcester, Mass.                61           43           13           3            1            1            9

MID. ATLANTIC                2,145        1,527          385         134           40           59           93
Albany, N.Y.                    63           41           12           4            4            2            4
Allentown, Pa.                   U            U            U           U            U            U            U
Buffalo, N.Y.                   99           65           28           3            1            2            7
Camden, N.J.                    28           18            5           4            1            -            1
Elizabeth, N.J.                 11            8            1           2            -            -            2
Erie, Pa.                       37           29            6           2            -            -            1
Jersey City, N.J.               48           32           11           5            -            -            -
New York City, N.Y.          1,077          767          206          71           18           15           26
Newark, N.J.                    41           20            8           7            2            4            4
Paterson, N.J.                  31           24            3           2            1            1            -
Philadelphia, Pa.              296          201           41          19           10           25            5
Pittsburgh, Pa.***              52           37            9           3            1            2            6
Reading, Pa.                    37           33            4           -            -            -            6
Rochester, N.Y.                114           98           12           3            -            1            9
Schenectady, N.Y.               27           22            4           1            -            -            2
Scranton, Pa.                   30           24            2           2            1            1            2
Syracuse, N.Y.                 110           78           23           4            1            4           13
Trenton, N.J.                   44           30           10           2            -            2            5
Utica, N.Y.                      U            U            U           U            U            U            U
Yonkers, N.Y.                    U            U            U           U            U            U            U

E.N. CENTRAL                 1,429        1,003          274          81           32           39          109
Akron, Ohio                     38           27            7           2            -            2            7
Canton, Ohio                    40           32            7           1            -            -            7
Chicago, Ill.                    U            U            U           U            U            U            U
Cincinnati, Ohio                99           65           14           9            6            5           10
Cleveland, Ohio                125           78           32           7            2            6            2
Columbus, Ohio                 158          115           27           3            3           10           13
Dayton, Ohio                   120           87           22           8            1            2           11
Detroit, Mich.                   U            U            U           U            U            U            U
Evansville, Ind.                50           35           13           1            -            1            3
Fort Wayne, Ind.                60           44            6           6            1            3            1
Gary, Ind.                      14            6            6           1            1            -            1
Grand Rapids, Mich.             79           56           17           3            1            2           12
Indianapolis, Ind.             193          124           47          15            6            1            8
Lansing, Mich.                  42           37            3           -            2            -            5
Milwaukee, Wis.                119           86           22           5            3            3           10
Peoria, Ill.                    47           33            9           2            2            1            5
Rockford, Ill.                  60           40            9           8            1            2            2
South Bend, Ind.                36           25            8           3            -            -            4
Toledo, Ohio                   104           73           20           7            3            1            6
Youngstown, Ohio                45           40            5           -            -            -            2

W.N. CENTRAL                   753          542          129          46           20           16           42
Des Moines, Iowa                 U            U            U           U            U            U            U
Duluth, Minn.                   25           17            8           -            -            -            3
Kansas City, Kans.              31           25            4           1            1            -            2
Kansas City, Mo.                90           61           16           8            3            2            6
Lincoln, Nebr.                  58           52            5           -            1            -            2
Minneapolis, Minn.             198          142           38          12            3            3           19
Omaha, Nebr.                    76           54           15           2            4            1            1
St. Louis, Mo.                 111           67           18          13            7            6            2
St. Paul, Minn.                 77           64            8           2            -            3            3
Wichita, Kans.                  87           60           17           8            1            1            4

S. ATLANTIC                    796          528          158          69           15           22           58
Atlanta, Ga.                     U            U            U           U            U            U            U
Baltimore, Md.                 113           70           23          17            3            -            9
Charlotte, N.C.                100           69           16           6            -            8           11
Jacksonville, Fla.              94           60           21           8            2            3            3
Miami, Fla.                    111           58           27          19            6            -            6
Norfolk, Va.                    48           35            8           2            -            3            4
Richmond, Va.                   64           42           12           5            -            5            5
Savannah, Ga.                   45           38            5           -            1            1            3
St. Petersburg, Fla.            59           48            6           4            -            1            8
Tampa, Fla.                    151          105           32           8            3            1            9
Washington, D.C.                 U            U            U           U            U            U            U
Wilmington, Del.                11            3            8           -            -            -            -

E.S. CENTRAL                   741          476          170          60           16           19           69
Birmingham, Ala.               149           99           35          11            1            3           19
Chattanooga, Tenn.              57           45            4           4            2            2            5
Knoxville, Tenn.                66           41           19           4            2            -            8
Lexington, Ky.                  63           35           17           9            1            1            8
Memphis, Tenn.                 141          103           25           7            1            5           15
Mobile, Ala.                    78           49           18           6            3            2            5
Montgomery, Ala.                68           34           23           7            1            3            5
Nashville, Tenn.               119           70           29          12            5            3            4

W.S. CENTRAL                 1,383          847          310         143           38           45           76
Austin, Tex.                    70           42           16           7            2            3            4
Baton Rouge, La.                24           14            4           4            1            1            1
Corpus Christi, Tex.            58           38           10           5            2            3            2
Dallas, Tex.                   179           98           51          15            8            7            4
El Paso, Tex.                   81           57           11          10            2            1            1
Ft. Worth, Tex.                 95           66           16          10            -            3            8
Houston, Tex.                  350          205           89          39            7           10           28
Little Rock, Ark.               49           26           10           5            5            3            -
New Orleans, La.               129           75           32          16            2            4           12
San Antonio, Tex.              163           96           37          19            6            5           10
Shreveport, La.                 55           41            5           8            -            1            4
Tulsa, Okla.                   130           89           29           5            3            4            2

MOUNTAIN                       914          589          198          78           26           22           58
Albuquerque, N.M.              110           81           17           5            4            3            8
Boise, Idaho                    34           25            4           2            1            2            2
Colo. Springs, Colo.            53           33           13           6            -            1            2
Denver, Colo.                  103           56           29          12            4            2           10
Las Vegas, Nev.                182          118           45          12            4            3           10
Ogden, Utah                     34           25            6           1            2            -            3
Phoenix, Ariz.                 152           83           35          21            6            6            6
Pueblo, Colo.                   26           20            5           -            1            -            1
Salt Lake City, Utah            86           58           13          11            3            1            7
Tucson, Ariz.                  134           90           31           8            1            4            9

PACIFIC                      1,612        1,128          276         131           49           27          129
Berkeley, Calif.                18           13            4           1            -            -            -
Fresno, Calif.                  83           58           19           4            2            -            6
Glendale, Calif.                17           13            3           -            1            -            -
Honolulu, Hawaii                73           58           13           -            2            -            7
Long Beach, Calif.              78           49           16           8            2            3           10
Los Angeles, Calif.            312          199           56          39            8           10           11
Pasadena, Calif.                 U            U            U           U            U            U            U
Portland, Oreg.                123           77           20          20            5            1            8
Sacramento, Calif.             161          121           26          10            2            2           26
San Diego, Calif.              138           92           28           9            6            3           11
San Francisco, Calif.          130           95           13          13            4            4           12
San Jose, Calif.               170          128           29           6            5            2           14
Santa Cruz, Calif.              25           18            3           3            1            -            1
Seattle, Wash.                 114           77           21           9            5            2           10
Spokane, Wash.                  59           49            3           6            1            -            8
Tacoma, Wash.                  111           81           22           3            5            -            5

TOTAL                   10,318****        7,021        2,007         775          248          261          675

---------------------------------------------------------------------------------------------------------------
U: Unavailable    -: no reported cases

   * Mortality data in this table are voluntarily reported from 122 cities in the United States, most of which have populations
     of 100,000 or more. A death is reported by the place of its occurrence and by the week that the death certificate was
     filed. Fetal deaths are not included.
  ** Pneumonia and influenza.
 *** Because of changes in reporting methods in this Pennsylvania city, these numbers are partial counts for the current
     week. Complete counts will be available in 4 to 6 weeks.
**** Total includes unknown ages.
===================================================================================================================================


Return to top.

Disclaimer   All MMWR HTML versions of articles are electronic conversions from ASCII text into HTML. This conversion may have resulted in character translation or format errors in the HTML version. Users should not rely on this HTML document, but are referred to the electronic PDF version and/or the original MMWR paper copy for the official text, figures, and tables. An original paper copy of this issue can be obtained from the Superintendent of Documents, U.S. Government Printing Office (GPO), Washington, DC 20402-9371; telephone: (202) 512-1800. Contact GPO for current prices.

**Questions or messages regarding errors in formatting should be addressed to mmwrq@cdc.gov.

Page converted: 10/21/99

HOME  |  ABOUT MMWR  |  MMWR SEARCH  |  DOWNLOADS  |  RSSCONTACT
POLICY  |  DISCLAIMER  |  ACCESSIBILITY

Safer, Healthier People

Morbidity and Mortality Weekly Report
Centers for Disease Control and Prevention
1600 Clifton Rd, MailStop E-90, Atlanta, GA 30333, U.S.A

USA.GovDHHS

Department of Health
and Human Services

This page last reviewed 5/2/01