Skip Navigation LinksSkip Navigation Links
Centers for Disease Control and Prevention
Safer Healthier People
Blue White
Blue White
bottom curve
CDC Home Search Health Topics A-Z spacer spacer
spacer
Blue curve MMWR spacer
spacer
spacer

Notifiable Diseases/Deaths in Selected Cities Weekly Information

Figure I   Selected notifiable disease reports, comparison of provisional 4-week totals ending May 22, 1999, with historical data -- United States

Table I   Summary -- provisional cases of selected notifiable diseases, United States, cumulative, week ending May 22, 1999 (20th Week)

Table II   Provisional cases of selected notifiable diseases, United States, weeks ending May 22, 1999 and May 23, 1998 (20th Week)

Table III   Provisional cases of selected notifiable diseases preventable by vaccination, United States, weeks ending May 22, 1999 and May 23, 1998 (20th Week)

Table IV   Deaths in 122 U.S. cities, week ending May 22, 1999 (20th Week)


Figure I

Figure I
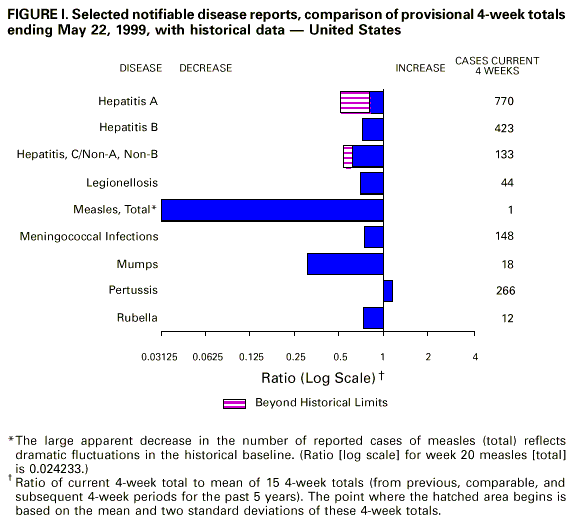
Return to top.

Table I
Note: To print large tables and graphs users may have to change their printer settings to landscape and use a small font size.
TABLE I. Summary -- provisional cases of specified notifiable diseases, United
States, cumulative, week ending May 22, 1999 (20th Week)
==================================================================================
                                             Cum. 1999
------------------------------------------------------
Anthrax                                              -
Brucellosis                                         15
Cholera                                              -
Congenital rubella syndrome                          2
Cryptosporidiosis*                                 446
Diphtheria                                           -
Encephalitis:  California*                           2
               eastern equine*                       -
               St. Louis*                            -
               western equine*                       1
Hansen Disease                                      32
Hantavirus pulmonary syndrome*+                      7
Hemolytic uremic syndrome, post-diarrheal*           8
HIV infection, pediatric*&                          57
Plague                                               -
Poliomyelitis, paralytic                             -
Psittacosis                                         12
Rabies, human                                        -
Rocky Mountain spotted fever (RMSF)                 62
Streptococcal disease, invasive Group A            893
Streptococcal toxic-shock syndrome*                 19
Syphilis, congenital@                               47
Tetanus                                              7
Toxic-shock syndrome                                43
Trichinosis                                          6
Typhoid fever                                      100
Yellow fever                                         -
------------------------------------------------------
-: no reported cases
 * Not notifiable in all states
 + Updated weekly from reports to the Division of Viral and Rickettsial
   Diseases, National Center for Infectious Diseases (NCID).
 & Updated monthly from reports to the Division of HIV/AIDS Prevention --
   Surveillance and Epidemiology, National Center for HIV, STD, and TB
   Prevention (NCHSTP), last update April 25, 1999.
 @ Updated from reports to the Division of STD Prevention, NCHSTP.

==================================================================================


Return to top.

Table II
Note: To print large tables and graphs users may have to change their printer settings to landscape and use a small font size.
TABLE II. (page 1) Provisional cases of selected notifiable diseases, United States, weeks ending
May 22, 1999, and May 23, 1998 (20th Week)

                                                                  Escherichia
                                                                 coli O157:H7
                                                              -------------------                                Hepatitis
                          AIDS              Chlamydia          NETSS**   PHLIS***         Gonorrhea               C/NA,NB
                   -----------------   --------------------   --------   --------    -------------------      ----------------
                     Cum.       Cum.        Cum.       Cum.       Cum.       Cum.        Cum.       Cum.       Cum.       Cum.
Reporting Area       1999*      1998        1999       1998       1999       1999        1999       1998       1999       1998
------------------------------------------------------------------------------------------------------------------------------
UNITED STATES      14,890     18,103     210,132    220,229        468        240     112,332    127,423        969      1,718

NEW ENGLAND           779        607       7,295      7,959         72         57       2,272      2,168         68         34
Maine                  15         10         193        357          4          -          15         12          1          -
N.H.                   23         12         349        373          6          7          23         34          -          -
Vt.                     5         10         189        146          8          1          22         11          2          2
Mass.                 500        271       3,330      3,271         32         29         967        781         62         31
R.I.                   52         60         892        964          4          3         228        139          3          1
Conn.                 184        244       2,342      2,848         18         17       1,017      1,191          -          -

MID. ATLANTIC       3,612      5,198      27,664     26,948         31          3      14,893     14,748         64        154
Upstate N.Y.          406        710           N          N         28          -       2,293      2,488         41        125
N.Y. City           1,894      2,919      14,560     13,996          -          2       6,115      5,899          -          -
N.J.                  765        960       3,626      4,450          3          1       1,919      2,653          -          -
Pa.                   547        609       9,478      8,502          N          -       4,566      3,708         23         29

E.N. CENTRAL        1,105      1,370      30,697     33,634         75         38      20,308     24,586        251        208
Ohio                  183        267       8,765     10,273         33          8       5,232      6,189          -          5
Ind.                  147        291           U          U          5          8         726      2,408          -          4
Ill.                  505        488      10,838      9,811         19          7       7,676      7,695          8         23
Mich.                 215        251       8,495      8,372         18          9       5,739      6,227        243        176
Wis.                   55         73       2,599      5,178          N          6         935      2,067          -          -

W.N. CENTRAL          285        334       7,553     13,278         91         34       2,527      6,278         47         10
Minn.                  44         55       2,456      2,736         30         21         925        935          2          -
Iowa                   35         14       1,108      1,642          9          2         246        505          -          4
Mo.                   102        174           U      4,606          9          7           -      3,378         42          4
N. Dak.                 4          4         325        391          3          -          31         33          -          -
S. Dak.                12          8         653        614          3          4          63        101          -          -
Nebr.                  26         31       1,153      1,132         30          -         519        434          -          2
Kans.                  62         48       1,858      2,157          7          -         743        892          3          -

S. ATLANTIC         4,155      4,550      47,170     41,799         56         27      33,611     33,909        102         41
Del.                   50         44       1,104        992          2          -         661        522          -          -
Md.                   467        570       3,118      3,217          4          -       2,704      3,544         24          3
D.C.                  160        359           N          N          -          -       1,006      1,365          -          -
Va.                   231        286       4,912      3,500         16          8       3,351      2,346          8          1
W. Va.                 24         41         827        941          1          1         230        329         11          3
N.C.                  269        332       8,906      8,751         10          6       7,599      7,367         21         10
S.C.                  402        275       7,547      7,320          6          3       4,087      4,725         12          -
Ga.                   583        505      11,783      9,493          4          -       7,602      7,726          1          9
Fla.                1,969      2,138       8,973      7,585         13          9       6,371      5,985         25         15

E.S. CENTRAL          634        692      15,563     15,043         33         11      12,452     14,287        104         52
Ky.                   104        101       2,634      2,328         11          -       1,185      1,298          6          9
Tenn.                 286        221       5,460      4,904         12          7       4,210      4,133         38         40
Ala.                  112        232       3,811      3,762          7          3       3,648      4,892          1          3
Miss.                 132        138       3,658      4,049          3          1       3,409      3,964         59          -

W.S. CENTRAL        1,553      2,447      29,664     32,888         17         10      16,639     19,465        105        352
Ark.                   56         81       2,199      1,366          5          2       1,031      1,529          2          3
La.                   162        395       6,498      4,859          3          3       5,142      4,169         88          2
Okla.                  46        134       3,265      4,033          4          5       1,649      2,168          2          1
Tex.                1,289      1,837      17,702     22,630          5          -       8,817     11,599         13        346

MOUNTAIN              545        699      12,318     11,886         38         19       3,403      3,207         62        205
Mont.                   4         13         512        415          3          -          17         21          4          4
Idaho                   8         14         501        715          1          2          26         63          4         77
Wyo.                    3          1         305        268          2          3          11         11         20         48
Colo.                 103        126       2,713      3,004         14          5         803        894         12         10
N. Mex.                21        111       1,499      1,455          2          1         264        286          4         36
Ariz.                 274        282       4,993      4,108          9          4       1,832      1,493         14          2
Utah                   54         51         747        878          6          2          75         85          2         14
Nev.                   78        101       1,048      1,043          1          2         375        354          2         14

PACIFIC             2,222      2,206      32,208     36,794         55         41       6,227      8,775        166        662
Wash.                 117        162       4,660      4,316         13         16         828        724          5          9
Oreg.                  50         64       2,171      1,903         16         12         302        262          6         10
Calif.              2,016      1,928      23,797     28,921         26         12       4,857      7,473        155        589
Alaska                  6         11         744        767          -          -         131        136          -          1
Hawaii                 33         41         836        887          -          1         109        180          -         53

Guam                    1          -           -        145          N          -           -         14          -          -
P.R.                  493        806           U          U          5          U         124        152          -          -
V.I.                   13         15           N          N          N          U           U          U          U          U
Amer. Samoa             -          -           U          U          N          U           U          U          U          U
C.N.M.I.                -          -           N          N          N          U           -         14          -          -
------------------------------------------------------------------------------------------------------------------------------
N: Not notifiable    U: Unavailable    -: no reported cases    C.N.M.I.: Commonwealth of North Mariana Islands

  * Updated monthly from reports to the Division of HIV/AIDS Prevention -- Surveillance and Epidemiology, National Center for HIV,
    STD, and TB Prevention, last update April 25, 1999.
 ** National Electronic Telecommunications System for Surveillance.
*** Public Health Laboratory Information System.

=======================================================================================================================================================

TABLE II. (page 2) Provisional cases of selected notifiable diseases, United States, weeks ending
May 22, 1999, and May 23, 1998 (20th Week)

                                                 Lyme                                     Syphilis                                  Rabies,
                     Legionellosis              Disease              Malaria        (Primary & Secondary)      Tuberculosis         Animal
                    ----------------       ----------------      ----------------   ---------------------    -----------------      -------
                     Cum.       Cum.        Cum.       Cum.       Cum.       Cum.        Cum.       Cum.       Cum.       Cum.        Cum.
Reporting Area       1999       1998        1999       1998       1999       1998        1999       1998       1999*      1998*      1999
-------------------------------------------------------------------------------------------------------------------------------------------
UNITED STATES         351        449       1,640      1,725        384        436       2,286      2,695      2,018      3,118       1,988

NEW ENGLAND            23         22         281        432         15         18          26         29        123        155         322
Maine                   3          1           -          4          1          -           -          1          6          3          60
N.H.                    2          2           -          7          -          3           -          1          -          2          17
Vt.                     3          1           -          2          1          -           1          2          -          1          53
Mass.                   7          8         135        101          5         13          16         20         59         85          65
R.I.                    2          4          16         25          -          2           1          -         16         17          40
Conn.                   6          6         130        293          8          -           8          5         42         47          87

MID. ATLANTIC          82         98       1,007      1,050         96        125         101        107        709        802         396
Upstate N.Y.           25         25         397        499         30         28          14         12        104        107         269
N.Y. City               5         22           5         29         30         66          44         21        453        491           U
N.J.                    5          4         118        142         24         17          11         39        152        204          71
Pa.                    47         47         487        380         12         14          32         35          U          U          56

E.N. CENTRAL           73        167          31         28         37         42         389        389        130        160          27
Ohio                   29         57          24         17          8          2          35         66          U          U           8
Ind.                    5         37           5          4          4          1          32         71          U          U           -
Ill.                   10         21           1          2         14         19         248        149          U          U           -
Mich.                  27         24           1          5          9         17          70         72         96        120          17
Wis.                    2         28           U          U          2          3           4         31         34         40           2

W.N. CENTRAL           20         25          17         16         15         23          16         67        171        142         219
Minn.                   1          3           8          3          2          8           5          5         75         47          39
Iowa                   12          4           2          8          5          3           4          -         14          2          46
Mo.                     6          8           -          3          7          9           -         49         62         60           8
N. Dak.                 -          -           1          -          -          1           -          -          1          3          60
S. Dak.                 1          -           -          -          -          -           -          1          3          9          25
Nebr.                   -          8           -          -          -          -           4          4          6          4           1
Kans.                   -          2           6          2          1          2           3          8         10         17          40

S. ATLANTIC            41         47         188        141        109         95         777      1,077        374        545         747
Del.                    2          6           3          3          -          1           2         12          -          8           3
Md.                     4          9         135        114         31         33         165        293          U          U         157
D.C.                    -          3           1          4          9          7          14         31         17         43           -
Va.                     9          4          10          6         19         15          56         72         83         89         188
W. Va.                  N          N           4          4          1          -           2          2         19         21          45
N.C.                    7          6          25          3          9          8         207        306        152        279         164
S.C.                    6          4           2          1          -          3         104        130        103        105          56
Ga.                     -          -           -          2          7         13         122        114          U          U          61
Fla.                   13         14           8          4         33         15         105        117          U          U          73

E.S. CENTRAL           52         21          40         17          8         12         449        456        176        236         102
Ky.                    44         11          16          3          2          1          43         46          U          U          19
Tenn.                   6          4          12          7          4          6         238        225          U          U          34
Ala.                    2          2           6          7          2          3         115        101        120        142          49
Miss.                   -          4           6          -          -          2          53         84         56         94           -

W.S. CENTRAL            1         10           2          7          8         12         351        339        100        808          38
Ark.                    -          -           -          4          -          1          27         51         56         41           -
La.                     1          -           -          -          6          4          94        107          U          U           -
Okla.                   -          4           2          -          1          1          89         20         44         46          38
Tex.                    -          6           -          3          1          6         141        161          -        721           -

MOUNTAIN               23         26           5          1         18         23          72         91         59         92          71
Mont.                   -          1           -          -          2          -           -          -          5         12          25
Idaho                   -          -           1          -          1          2           -          -          -          4           -
Wyo.                    -          1           1          -          -          -           -          -          1          2          26
Colo.                   4          4           -          -          7          6           1          4          U          U           1
N. Mex.                 1          2           1          -          2          6           -         10         22         24           -
Ariz.                   3          5           -          -          5          4          68         69          U          U          19
Utah                    9         11           1          -          -          1           1          3         16         21           -
Nev.                    6          2           1          1          1          4           2          5         15         29           -

PACIFIC                36         33          69         33         78         86         105        140        176        178          66
Wash.                   7          3           1          1          5          6          28          7         90         95           -
Oreg.                   1          -           1          5          9          9           1          1          U          U           1
Calif.                 27         30          67         27         59         70          73        132          U          U          60
Alaska                  1          -           -          -          -          -           1          -         25         17           5
Hawaii                  -          -           -          -          5          1           2          -         61         66           -

Guam                    -          1           -          -          -          1           -          -          -         37           -
P.R.                    -          -           -          -          -          -          78         89         41         46          29
V.I.                    U          U           U          U          U          U           U          U          U          U           U
Amer. Samoa             U          U           U          U          U          U           U          U          U          U           U
C.N.M.I.                -          -           -          -          -          -           -         98          -         54           -

-------------------------------------------------------------------------------------------------------------------------------------------
N: Not notifiable    U: Unavailable    -: no reported cases
* Cumulative reports of provisional tuberculosis cases for 1998 and 1999 are unavailable ('U') for some areas using the Tuberculosis
  Information Management System (TIMS).

=======================================================================================================================================================


Return to top.

Table III
Note: To print large tables and graphs users may have to change their printer settings to landscape and use a small font size.
TABLE III. (page 1) Provisional cases of selected notifiable diseases preventable by vaccination, United
States, weeks ending May 22, 1999, and May 23, 1998 (20th Week)

                                                Hepatitis (Viral), by type                                    Measles (Rubeola)
                     H. influenzae,       ---------------------------------------        ------------------------------------------------------------
                        invasive                  A                     B                  Indigenous            Imported**                Total
                    ----------------      -----------------     -----------------        ---------------       ---------------        ---------------
                     Cum.       Cum.        Cum.       Cum.       Cum.       Cum.                   Cum.                  Cum.        Cum.       Cum.
Reporting Area       1999*      1998        1999       1998       1999       1998        1999       1999       1999       1999        1999       1998
-----------------------------------------------------------------------------------------------------------------------------------------------------
UNITED STATES         468        473       6,119      8,769      2,304      3,329           -         21          -         11          32         24

NEW ENGLAND            34         32          69        123         35         57           -          1          -          2           3          1
Maine                   4          2           2         12          -          -           -          -          -          -           -          -
N.H.                    6          1           7          6          4          7           U          -          U          1           1          -
Vt.                     4          2           3          8          1          2           -          -          -          -           -          -
Mass.                  14         25          19         39         18         28           U          -          U          -           -          1
R.I.                    -          2           9          8         12          9           -          -          -          -           -          -
Conn.                   6          -          29         50          -         11           -          1          -          1           2          -

MID. ATLANTIC          57         68         378        625        290        494           -          -          -          2           2          9
Upstate N.Y.           33         24          96        128         79        116           -          -          -          2           2          -
N.Y. City               7         17          62        223         61        146           -          -          -          -           -          -
N.J.                   17         25          42        114         33         86           U          -          U          -           -          8
Pa.                     -          2         178        160        117        146           -          -          -          -           -          1

E.N. CENTRAL           53         72       1,255      1,237        196        644           -          -          -          -           -          4
Ohio                   25         29         319        134         41         27           -          -          -          -           -          -
Ind.                    1         14          29        119          4        300           -          -          -          -           -          3
Ill.                   20         27         181        307          -        101           -          -          -          -           -          -
Mich.                   7          -         700        576        150        176           -          -          -          -           -          1
Wis.                    -          2          26        101          1         40           -          -          -          -           -          -

W.N. CENTRAL           39         31         286        693        126        148           -          -          -          -           -          -
Minn.                  12         17          25         28         16         11           -          -          -          -           -          -
Iowa                   10          1          65        322         23         19           -          -          -          -           -          -
Mo.                    11          8         156        279         71         99           -          -          -          -           -          -
N. Dak.                 -          -           1          2          -          2           -          -          -          -           -          -
S. Dak.                 1          -           8          8          -          1           -          -          -          -           -          -
Nebr.                   3          -          16          9          7          6           -          -          -          -           -          -
Kans.                   2          5          15         45          9         10           -          -          -          -           -          -

S. ATLANTIC           116         87         710        579        451        305           -          1          -          3           4          6
Del.                    -          -           1          3          -          -           -          -          -          -           -          1
Md.                    30         27         132        144         70         68           -          -          -          -           -          1
D.C.                    3          -          30         25         10          6           -          -          -          -           -          -
Va.                    10         11          54        110         39         40           -          1          -          2           3          2
W. Va.                  2          3           7          1         11          3           -          -          -          -           -          -
N.C.                   20         12          51         41         93         81           -          -          -          -           -          -
S.C.                    2          3          11         12         36          -           -          -          -          -           -          -
Ga.                    23         19         181        125         51         58           -          -          -          -           -          1
Fla.                   26         12         243        118        141         49           -          -          -          1           1          1

E.S. CENTRAL           39         29         196        179        194        165           -          -          -          -           -          -
Ky.                     6          5          31         10         22         19           -          -          -          -           -          -
Tenn.                  20         17          98        107         86        117           -          -          -          -           -          -
Ala.                   11          6          32         36         42         29           -          -          -          -           -          -
Miss.                   2          1          35         26         44          -           -          -          -          -           -          -

W.S. CENTRAL           30         26       1,123      1,605        187        482           -          1          -          2           3          -
Ark.                    1          -          18         23         20         31           -          -          -          -           -          -
La.                     7         12          46         13         57         11           -          -          -          -           -          -
Okla.                  20         12         194        230         40         25           -          -          -          -           -          -
Tex.                    2          2         865      1,339         70        415           -          1          -          2           3          -

MOUNTAIN               52         71         641      1,354        245        326           -          -          -          -           -          -
Mont.                   1          -          12         30         15          3           -          -          -          -           -          -
Idaho                   1          -          24         90         12         15           -          -          -          -           -          -
Wyo.                    1          -           3         21          3          2           -          -          -          -           -          -
Colo.                   6         12         108        102         38         42           -          -          -          -           -          -
N. Mex.                10          3          20         73         85        120           -          -          -          -           -          -
Ariz.                  28         36         400        848         53         82           -          -          -          -           -          -
Utah                    4          3          24         89         14         28           -          -          -          -           -          -
Nev.                    1         17          50        101         25         34           -          -          -          -           -          -

PACIFIC                48         57       1,461      2,374        580        708           -         18          -          2          20          4
Wash.                   1          3         102        379         21         48           -          -          -          -           -          1
Oreg.                  18         27         112        176         40         73           -          8          -          -           8          -
Calif.                 24         24       1,239      1,781        507        574           -         10          -          2          12          3
Alaska                  4          1           3         12          7          7           -          -          -          -           -          -
Hawaii                  1          2           5         26          5          6           -          -          -          -           -          -

Guam                    -          -           -          -          -          1           U          -          U          -           -          -
P.R.                    1          2          63         19         60        230           -          -          -          -           -          -
V.I.                    U          U           U          U          U          U           U          U          U          U           U          U
Amer. Samoa             U          U           U          U          U          U           U          U          U          U           U          U
C.N.M.I.                -          -           -          1          -         28           U          -          U          -           -          -
-----------------------------------------------------------------------------------------------------------------------------------------------------
N: Not notifiable    U: Unavailable     -: no reported cases

 * Of 96 cases among children aged <5 years, serotype was reported for 39 and of those, 5 were type b.
** For imported measles, cases include only those resulting from importation from other countries.
=======================================================================================================================================================

TABLE III. (page 2) Provisional cases of selected notifiable diseases preventable by vaccination, United
States, weeks ending May 22, 1999, and May 23, 1998 (20th Week)

                     Meningococcal
                        Disease                      Mumps                           Pertussis                          Rubella
                   -----------------        --------------------------       ---------------------------       ---------------------------
                     Cum.       Cum.                   Cum.       Cum.                   Cum.       Cum.                  Cum.        Cum.
Reporting Area       1999       1998        1999       1999       1998       1999        1999       1998       1999       1999        1998
------------------------------------------------------------------------------------------------------------------------------------------
UNITED STATES       1,033      1,254           2        137        351         84       1,988      1,696          2         34         224

NEW ENGLAND            46         63           -          1          -          -         150        317          -          3          34
Maine                   4          4           -          -          -          -           -          5          -          -           -
N.H.                    -          4           U          1          -          U          32         21          U          -           -
Vt.                     4          1           -          -          -          -          10         30          -          -           -
Mass.                  30         28           U          -          -          U          97        255          U          3           7
R.I.                    2          3           -          -          -          -           3          -          -          -           -
Conn.                   6         23           -          -          -          -           8          6          -          -          27

MID. ATLANTIC          91        125           -         18        162         30         497        207          2          8          99
Upstate N.Y.           23         30           -          3          3         30         448        101          2          5          89
N.Y. City              24         14           -          3        153          -          10         11          -          -           6
N.J.                   17         34           U          -          2          U           -          8          U          -           4
Pa.                    27         47           -         12          4          -          39         87          -          3           -

E.N. CENTRAL          146        194           -         15         39         11         148        181          -          -           -
Ohio                   75         68           -          6         16          1          95         61          -          -           -
Ind.                    7         26           -          -          3          -           2         46          -          -           -
Ill.                   43         58           -          3          6         10          33         13          -          -           -
Mich.                  20         22           -          6         14          -          18         23          -          -           -
Wis.                    1         20           -          -          -          -           -         38          -          -           -

W.N. CENTRAL          121        104           -          5         19          -          44        130          -          2          11
Minn.                  26         16           -          1         10          -          18         76          -          -           -
Iowa                   29         14           -          3          6          -          13         29          -          2           -
Mo.                    43         45           -          1          2          -          10          9          -          -           2
N. Dak.                 3          -           -          -          1          -           -          -          -          -           -
S. Dak.                 5          6           -          -          -          -           2          4          -          -           -
Nebr.                   4          4           -          -          -          -           1          5          -          -           -
Kans.                  11         19           -          -          -          -           -          7          -          -           9

S. ATLANTIC           186        185           1         30         25          4         113         99          -          2           4
Del.                    3          1           -          -          -          -           -          -          -          -           -
Md.                    27         20           -          3          -          -          33         20          -          1           -
D.C.                    1          -           -          2          -          -           -          1          -          -           -
Va.                    22         20           -          8          4          -          13          6          -          -           -
W. Va.                  3          5           -          -          -          -           1          1          -          -           -
N.C.                   22         27           -          5          7          1          26         42          -          1           3
S.C.                   22         28           1          3          4          -           8         12          -          -           -
Ga.                    29         38           -          -          1          3          12          1          -          -           -
Fla.                   57         46           -          9          9          -          20         16          -          -           1

E.S. CENTRAL           88         95           -          1          4          3          38         47          -          1           -
Ky.                    24         15           -          -          -          -           3         18          -          -           -
Tenn.                  29         35           -          -          -          2          24         14          -          -           -
Ala.                   18         29           -          1          1          -           7         13          -          1           -
Miss.                  17         16           -          -          3          1           4          2          -          -           -

W.S. CENTRAL           68        146           -         17         26          -          52         99          -          5          58
Ark.                   17         18           -          -          -          -           4         13          -          -           -
La.                    31         25           -          2          2          -           3          -          -          -           -
Okla.                  14         23           -          1          -          -           7         13          -          -           -
Tex.                    6         80           -         14         24          -          38         73          -          5          58

MOUNTAIN               79         75           1          9         18         12         208        329          -         11           5
Mont.                   1          2           -          -          -          -           1          1          -          -           -
Idaho                   8          3           -          -          1          1          87        116          -          -           -
Wyo.                    3          3           -          -          1          -           2          7          -          -           -
Colo.                  20         17           -          3          1          5          47         75          -          -           -
N. Mex.                10         11           N          N          N          3          18         56          -          -           1
Ariz.                  27         27           -          -          4          2          24         47          -         10           1
Utah                    5          8           1          5          3          1          27         14          -          -           2
Nev.                    5          4           -          1          8          -           2         13          -          1           1

PACIFIC               208        267           -         41         58         24         738        287          -          2          13
Wash.                  28         28           -          1          5         22         437        113          -          -           9
Oreg.                  38         46           N          N          N          1          12         20          -          -           -
Calif.                134        188           -         34         38          1         281        150          -          2           2
Alaska                  4          1           -          1          2          -           3          -          -          -           -
Hawaii                  4          4           -          5         13          -           5          4          -          -           2

Guam                    -          1           U          -          2          U           -          -          U          -           -
P.R.                    2          4           -          -          1          1           6          2          -          -           -
V.I.                    U          U           U          U          U          U           U          U          U          U           U
Amer. Samoa             U          U           U          U          U          U           U          U          U          U           U
C.N.M.I.                -          -           U          -          2          U           -          1          U          -           -

------------------------------------------------------------------------------------------------------------------------------------------
N: Not notifiable    U: Unavailable     -: no reported cases

=======================================================================================================================================================


Return to top.

Table IV
Note: To print large tables and graphs users may have to change their printer settings to landscape and use a small font size.
TABLE IV. Deaths in 122 U.S. cities,* week ending
May 22, 1999 (20th Week)
===================================================================================================================================
                                                 All Causes, By Age (Years)
                          ------------------------------------------------------------------------        P&I**
Reporting Area            All Ages         >=65        45-64       25-44         1-24           <1        Total
---------------------------------------------------------------------------------------------------------------
NEW ENGLAND                    549          404          100          28            5           12           40
Boston, Mass.                  144          105           28           4            1            6            8
Bridgeport, Conn.               40           28            9           2            1            -            2
Cambridge, Mass.                13           11            1           1            -            -            1
Fall River, Mass.               15           13            1           -            -            1            1
Hartford, Conn.                 51           40            7           3            1            -            3
Lowell, Mass.                   19           14            2           3            -            -            2
Lynn, Mass.                     13            8            2           3            -            -            1
New Bedford, Mass.              22           19            2           1            -            -            3
New Haven, Conn.                32           21            4           3            1            3            3
Providence, R.I.                52           36           13           1            1            1            1
Somerville, Mass.                8            6            2           -            -            -            2
Springfield, Mass.              41           30            8           2            -            1            7
Waterbury, Conn.                40           31            8           1            -            -            1
Worcester, Mass.                59           42           13           4            -            -            5

MID. ATLANTIC                2,341        1,605          469         167           61           39           76
Albany, N.Y.                    41           29            7           4            1            -            5
Allentown, Pa.                   U            U            U           U            U            U            U
Buffalo, N.Y.                   81           52           17           2            8            2            2
Camden, N.J.                    27           18            6           2            -            1            -
Elizabeth, N.J.                  U            U            U           U            U            U            U
Erie, Pa.                       42           32           10           -            -            -            2
Jersey City, N.J.               42           21           14           5            -            2            -
New York City, N.Y.          1,161          780          254          91           21           15           21
Newark, N.J.                    68           39           13          11            1            4            1
Paterson, N.J.                  17            6            5           5            1            -            -
Philadelphia, Pa.              399          272           77          22           20            8           22
Pittsburgh, Pa.***              95           68           18           6            1            2            3
Reading, Pa.                    25           17            3           4            1            -            -
Rochester, N.Y.                144          118           16           8            1            1           10
Schenectady, N.Y.               21           17            2           1            1            -            2
Scranton, Pa.                   47           36            9           -            -            2            2
Syracuse, N.Y.                  92           68           15           5            3            1            6
Trenton, N.J.                   29           23            2           1            2            1            -
Utica, N.Y.                     10            9            1           -            -            -            -
Yonkers, N.Y.                    U            U            U           U            U            U            U

E.N. CENTRAL                 2,015        1,387          377         131           47           71          121
Akron, Ohio                     53           41            6           5            -            1            -
Canton, Ohio                    39           25           10           2            2            -            3
Chicago, Ill.                  403          245           86          45           13           12           31
Cincinnati, Ohio               100           74           17           -            2            7           10
Cleveland, Ohio                127           89           23           7            2            6            2
Columbus, Ohio                 188          127           34          14            4            9           16
Dayton, Ohio                   111           68           27           6            4            6            3
Detroit, Mich.                 217          127           57          18            8            7            7
Evansville, Ind.                49           44            1           2            -            2            2
Fort Wayne, Ind.                60           50            9           1            -            -            6
Gary, Ind.                      19           11            3           3            1            1            1
Grand Rapids, Mich.             47           34            3           4            1            5            3
Indianapolis, Ind.             165          114           35           8            3            5            5
Lansing, Mich.                  60           39           12           5            1            3            2
Milwaukee, Wis.                 98           77           15           3            2            1            7
Peoria, Ill.                    46           29           12           2            1            2            4
Rockford, Ill.                  38           28            8           1            -            1            3
South Bend, Ind.                56           45            6           3            -            2            6
Toledo, Ohio                    98           83           10           2            2            1            5
Youngstown, Ohio                41           37            3           -            1            -            5

W.N. CENTRAL                   448          301           87          22           18           14           17
Des Moines, Iowa                 U            U            U           U            U            U            U
Duluth, Minn.                   26           15            8           3            -            -            1
Kansas City, Kans.               U            U            U           U            U            U            U
Kansas City, Mo.               106           71           24           3            4            4            6
Lincoln, Nebr.                  31           24            6           -            1            -            1
Minneapolis, Minn.               U            U            U           U            U            U            U
Omaha, Nebr.                    68           53           11           1            2            1            3
St. Louis, Mo.                 129           70           26          11            9            7            -
St. Paul, Minn.                 88           68           12           4            2            2            6
Wichita, Kans.                   U            U            U           U            U            U            U

S. ATLANTIC                  1,213          814          227         117           32           21           40
Atlanta, Ga.                   147           92           33          14            5            3            -
Baltimore, Md.                 186          110           37          35            4            -            8
Charlotte, N.C.                 94           71           14           6            1            1            9
Jacksonville, Fla.             152          101           33          13            3            2            6
Miami, Fla.                    119           77           27          11            3            1            2
Norfolk, Va.                    56           38            2           8            1            7            1
Richmond, Va.                   61           39           13           7            2            -            2
Savannah, Ga.                   39           30            7           1            -            1            2
St. Petersburg, Fla.            41           31            6           4            -            -            2
Tampa, Fla.                    194          140           26          14           10            4            5
Washington, D.C.                99           68           21           4            3            2            3
Wilmington, Del.                25           17            8           -            -            -            -

E.S. CENTRAL                   821          548          168          58           21           19           45
Birmingham, Ala.               184          121           37          13            4            3           19
Chattanooga, Tenn.              65           42           15           5            2            1            4
Knoxville, Tenn.                86           69           10           5            2            -            2
Lexington, Ky.                  87           59           21           4            2            1            8
Memphis, Tenn.                 130           79           26          12            5            8            7
Mobile, Ala.                    74           53           11           6            2            2            -
Montgomery, Ala.                50           34           12           1            1            2            -
Nashville, Tenn.               145           91           36          12            3            2            5

W.S. CENTRAL                 1,485        1,022          307         107           22           27          106
Austin, Tex.                    89           58           25           4            2            -            6
Baton Rouge, La.                76           59           14           1            2            -            4
Corpus Christi, Tex.            51           39            4           6            -            2            5
Dallas, Tex.                   180          120           42          14            1            3            2
El Paso, Tex.                   84           63           10          10            1            -            2
Ft. Worth, Tex.                116           80           26           8            2            -           15
Houston, Tex.                  410          269           98          32           10            1           37
Little Rock, Ark.               74           46           16           8            -            4            6
New Orleans, La.                 U            U            U           U            U            U            U
San Antonio, Tex.              241          172           43          14            2           10           13
Shreveport, La.                 58           47            7           2            -            2           11
Tulsa, Okla.                   106           69           22           8            2            5            5

MOUNTAIN                       847          575          164          55           33           18           49
Albuquerque, N.M.               90           60           16           7            5            2            1
Boise, Idaho                    31           22            7           1            -            1            2
Colo. Springs, Colo.            50           38            5           4            -            3            3
Denver, Colo.                  116           72           29           6            5            4            7
Las Vegas, Nev.                235          149           56          18            6            5           14
Ogden, Utah                     32           29            2           -            1            -            2
Phoenix, Ariz.                  44           27           11           3            2            1            3
Pueblo, Colo.                   29           22            3           1            2            -            3
Salt Lake City, Utah            89           63           11           5            8            2            7
Tucson, Ariz.                  131           93           24          10            4            -            7

PACIFIC                      1,599        1,121          285         126           31           34          137
Berkeley, Calif.                13            8            4           1            -            -            1
Fresno, Calif.                 107           70           19          11            4            3           13
Glendale, Calif.                23           15            5           2            -            1            2
Honolulu, Hawaii                81           61           15           3            1            1            7
Long Beach, Calif.              84           53           16          10            2            3            8
Los Angeles, Calif.            308          226           45          25            6            6           34
Pasadena, Calif.                27           17            9           -            1            -            3
Portland, Oreg.                151          103           29          14            2            3            5
Sacramento, Calif.             181          118           41          18            3            1           21
San Diego, Calif.              137           96           24           8            5            4           12
San Francisco, Calif.            U            U            U           U            U            U            U
San Jose, Calif.               175          120           31          18            1            5            9
Santa Cruz, Calif.              30           25            4           1            -            -            4
Seattle, Wash.                 148          100           26          10            6            6            7
Spokane, Wash.                  58           48            7           2            -            1            7
Tacoma, Wash.                   76           61           10           3            -            -            4

TOTAL                   11,318****        7,777        2,184         811          270          255          631

---------------------------------------------------------------------------------------------------------------
U: Unavailable    -: no reported cases

   * Mortality data in this table are voluntarily reported from 122 cities in the United States, most of which have populations
     of 100,000 or more. A death is reported by the place of its occurrence and by the week that the death certificate was
     filed. Fetal deaths are not included.
  ** Pneumonia and influenza.
 *** Because of changes in reporting methods in this Pennsylvania city, these numbers are partial counts for the current
     week. Complete counts will be available in 4 to 6 weeks.
**** Total includes unknown ages.
===================================================================================================================================


Return to top.

Disclaimer   All MMWR HTML versions of articles are electronic conversions from ASCII text into HTML. This conversion may have resulted in character translation or format errors in the HTML version. Users should not rely on this HTML document, but are referred to the electronic PDF version and/or the original MMWR paper copy for the official text, figures, and tables. An original paper copy of this issue can be obtained from the Superintendent of Documents, U.S. Government Printing Office (GPO), Washington, DC 20402-9371; telephone: (202) 512-1800. Contact GPO for current prices.

**Questions or messages regarding errors in formatting should be addressed to mmwrq@cdc.gov.

Page converted: 05/27/99

HOME  |  ABOUT MMWR  |  MMWR SEARCH  |  DOWNLOADS  |  RSSCONTACT
POLICY  |  DISCLAIMER  |  ACCESSIBILITY

Safer, Healthier People

Morbidity and Mortality Weekly Report
Centers for Disease Control and Prevention
1600 Clifton Rd, MailStop E-90, Atlanta, GA 30333, U.S.A

USA.GovDHHS

Department of Health
and Human Services

This page last reviewed 5/2/01