 |
|
|
|
|
|
|
| ||||||||||
|
|
|
|
|
|
|
||||
| ||||||||||
|
|
|
|
|
Persons using assistive technology might not be able to fully access information in this file. For assistance, please send e-mail to: mmwrq@cdc.gov. Type 508 Accommodation and the title of the report in the subject line of e-mail. Youth Risk Behavior Surveillance --- United States, 2005Danice K. Eaton, PhD,1 Laura Kann,
PhD,1 Steve Kinchen,1 James Ross,
MS,2 Joseph Hawkins, MA,3 William A. Harris,
MM,1 Richard Lowry, MD,1 Tim McManus,
MS,1 David Chyen, MS,1 Shari Shanklin,
MS,1 Connie Lim, MPA,1 Jo Anne Grunbaum,
EdD,4 Howell Wechsler, EdD1
Corresponding author: Danice K. Eaton, PhD, Division of Adolescent and School Health, National Center for Chronic Disease Prevention and Health Promotion, MS K-33, 4770 Buford Hwy, NE, Atlanta, GA 30341. Telephone: 770-488-6143; Fax: 770-488-6156; E-mail: dhe0@cdc.gov. AbstractProblem: Priority health-risk behaviors, which contribute to the leading causes of morbidity and mortality among youth and adults, often are established during childhood and adolescence, extend into adulthood, are interrelated, and are preventable. Reporting Period Covered: October 2004--January 2006. Description of the System: The Youth Risk Behavior Surveillance System (YRBSS) monitors six categories of priority health-risk behaviors among youth and young adults, including behaviors that contribute to unintentional injuries and violence; tobacco use; alcohol and other drug use; sexual behaviors that contribute to unintended pregnancy and sexually transmitted diseases (STDs), including human immunodeficiency virus (HIV) infections; unhealthy dietary behaviors; and physical inactivity. In addition, the YRBSS monitors general health status and the prevalence of overweight and asthma. YRBSS includes a national school-based survey conducted by CDC and state and local school-based surveys conducted by state and local education and health agencies. This report summarizes results from the national survey, 40 state surveys, and 21 local surveys conducted among students in grades 9--12 during October 2004--January 2006. Results: In the United States, 71% of all deaths among persons aged 10--24 years result from four causes: motor-vehicle crashes, other unintentional injuries, homicide, and suicide. Results from the 2005 national Youth Risk Behavior Survey (YRBS) indicated that, during the 30 days preceding the survey, many high school students engaged in behaviors that increased their likelihood of death from these four causes: 9.9% had driven a car or other vehicle when they had been drinking alcohol; 18.5% had carried a weapon; 43.3% had drunk alcohol; and 20.2% had used marijuana. In addition, during the 12 months preceding the survey, 35.9% of high school students had been in a physical fight and 8.4% had attempted suicide. Substantial morbidity and social problems among youth also result from unintended pregnancies and STDs, including HIV infection. During 2005, a total of 46.8% of high school students had ever had sexual intercourse; 37.2% of sexually active high school students had not used a condom at last sexual intercourse; and 2.1% had ever injected an illegal drug. Among adults aged >25 years, 61% of all deaths result from two causes: cardiovascular disease and cancer. Results from the 2005 national YRBS indicated that risk behaviors associated with these two causes of death were initiated during adolescence. During 2005, a total of 23.0% of high school students had smoked cigarettes during the 30 days preceding the survey; 79.9% had not eaten >5 times/day of fruits and vegetables during the 7 days preceding the survey; 67.0% did not attend physical education classes daily; and 13.1% were overweight. Interpretation: Since 1991, the prevalence of many health-risk behaviors among high school students nationwide has decreased. However, many high school students continue to engage in behaviors that place them at risk for the leading causes of mortality and morbidity. The prevalence of many health-risk behaviors varies across cities and states. Public Health Action: YRBS data are used to measure progress toward achieving 15 national health objectives for Healthy People 2010 and three of the 10 leading health indicators, to assess trends in priority health-risk behaviors among high school students, and to evaluate the impact of broad school and community interventions at the national, state, and local levels. More effective school health programs and other policy and programmatic interventions are needed to reduce risk and improve health outcomes among youth. IntroductionIn the United States, 71% of all deaths among youth and young adults aged 10--24 years result from four causes: motor-vehicle crashes (31%), other unintentional injuries (14%), homicide (15%), and suicide (11%) (1). Substantial morbidity and social problems also result from the approximately 831,000 pregnancies among women aged 15--19 years (2), the estimated 9.1 million cases of sexually transmitted diseases (STDs) among persons aged 15--24 years (3), and the estimated 4,842 cases of HIV/AIDS among persons aged 15--24 years (4) that occur annually. Among adults aged >25 years, 61% of all deaths in the United States result from cardiovascular diseases (38%) and cancer (23%) (1). These leading causes of morbidity and mortality among youth and adults in the United States are related to six categories of priority health-risk behaviors: behaviors that contribute to unintentional injuries and violence; tobacco use; alcohol and other drug use; sexual behaviors that contribute to unintended pregnancy and STDs, including HIV infection; unhealthy dietary behaviors; and physical inactivity. These behaviors frequently are interrelated and often are established during childhood and adolescence and extend into adulthood. To monitor priority health-risk behaviors among youth and young adults in each of these six categories and general health status, overweight, and asthma, CDC developed the Youth Risk Behavior Surveillance System (YRBSS) (5). YRBSS includes national, state, and local school-based surveys of students in grades 9--12. National, state, and local surveys have been conducted biennially since 1991 (Box). This report summarizes results from the 2005 national Youth Risk Behavior Survey (YRBS) and trends during 1991--2005 in selected risk behaviors. Data from the 40 state and 21 local surveys with weighted data for the 2005 YRBSS cycle also are included (Figure 1). Data from the remaining four state and two local surveys with unweighted data are not included in this report. The national survey, 36 weighted state surveys, and 20 weighted local surveys were conducted during spring 2005. One of the weighted state surveys was conducted during fall 2004, and three of the weighted state surveys and one of the weighted local surveys were conducted during fall 2005. MethodsSamplingNational Youth Risk Behavior Survey The sampling frame for the 2005 national Youth Risk Behavior Survey (YRBS) consisted of all public and private schools with students in at least one of grades 9--12 in the 50 states and the District of Columbia. The sampling frame was obtained from the Quality Education Data (QED), Inc., database (6). The QED database includes information on both public and private schools and the most recent data from the Common Core of Data from the National Center for Education Statistics (7). A three-stage cluster sample design produced a nationally representative sample of students in grades 9--12 who attend public and private schools. The first-stage sampling frame consisted of 1,261 primary sampling units (PSUs), consisting of counties, subareas of large counties, or groups of smaller, adjacent counties. The 1,261 PSUs were categorized into 16 strata according to their metropolitan statistical area (MSA) status (i.e., urbanicity) and the percentages of black* and Hispanic† students in the PSUs. From the 1,261 PSUs, 57 were selected with probability proportional to overall school enrollment size for the PSU. In the second stage of sampling, 203 schools with any of grades 9--12 were selected with probability proportional to school enrollment size. The third stage of sampling consisted of randomly selecting, in each chosen school and in each of grades 9--12, one or two classrooms from either a required subject (e.g., English or social studies) or a required period (e.g., homeroom or second period). All students in selected classes were eligible to participate. Schools, classes, and students that refused to participate were not replaced. To enable a separate analysis of data for black and Hispanic students, three strategies were used to oversample these students: 1) larger sampling rates were used to select PSUs that are in high-black and high-Hispanic strata; 2) a modified measure of size was used that increased the probability of selecting schools with a disproportionately high minority enrollment; and 3) two classes per grade, rather than one, were selected in schools with a high minority enrollment. A weight based on student sex, race/ethnicity, and grade level was applied to each record to adjust for school and student nonresponse and oversampling of black and Hispanic students. The overall weights were scaled so that the weighted count of students equals the total sample size, and the weighted proportions of students in each grade match the national population proportions. For the 2005 national YRBS, 13,953 questionnaires were completed in 159 schools. The school response rate was 78%, and the student response rate was 86%. The school response rate multiplied by the student response rate produced an overall response rate of 67% (Table 1). CDC's Institutional Review Board granted clearance for the national YRBS. Additional information about the national YRBS is available at http://www.cdc.gov/yrbs. State and Local Youth Risk Behavior Surveys In 2005, each state and local school-based survey employed a two-stage cluster sample design to produce a representative sample of public school students in grades 9--12 in their jurisdiction. In the first sampling stage, schools with any of grades 9--12 were selected with probability proportional to school enrollment size in 38 states and five cities; all schools with any of grades 9--12 were selected in two states and 16 cities. In the second sampling stage, intact classes from either a required subject (e.g., English or social studies) or a required period (e.g., homeroom or second period) were selected randomly, and all students in selected classes were eligible to participate in 39 states and 21 cities; all students in selected schools were selected to participate in one state. State and local surveys that had a scientifically selected sample of students, appropriate documentation, and an overall response rate >60% were weighted. A weight was applied to each record to adjust for student nonresponse and the distribution of students by grade, sex, and race/ethnicity in each jurisdiction. Therefore, weighted estimates are representative of all students in grades 9--12 attending public schools in each jurisdiction. In 2005, a total of 40 state and 21 local surveys had weighted data, and the student sample sizes ranged from 942 to 9,708 (Table 1). School response rates ranged from 72% to 100%; student response rates ranged from 61% to 93%; and overall response rates ranged from 60% to 85%. Additional information about state and local YRBSs is available at http://www.cdc.gov/yrbs. Data Collection Procedures and QuestionnaireSurvey procedures for the national, state, and local surveys were designed to protect students' privacy by allowing for anonymous and voluntary participation. Before survey administration, local parental permission procedures were followed. Students completed the self-administered questionnaire during one class period and recorded their responses directly on a computer-scannable booklet or answer sheet. The core questionnaire contained 87 questions. States and cities could add or delete questions from the core questionnaire. For the 2005 national YRBS, 11 questions were added to the core questionnaire. Skip patterns were not included in any YRBS questionnaire to protect student privacy by ensuring all students took about the same amount of time to complete the survey. For state and local surveys, only data from core questions are presented in this report. Information about the reliability of the core questionnaire is published elsewhere (8). Data Processing and CodingThe national data set and each state and local data set were cleaned and edited for inconsistencies. Missing data were not statistically imputed. Of the 13,953 completed questionnaires from the national YRBS, 36 failed quality control§ and were excluded from analysis, leaving 13,917 usable questionnaires (Table 1). The number of completed questionnaires that failed quality control checks and were excluded from analysis from the state and local surveys ranged from 0 to 48 (median: seven). To comply with Office of Management and Budget requirements, for the 2005 national YRBS, race/ethnicity was computed from two questions: 1) "Are you Hispanic or Latino?" (response options were "yes" or "no"), and 2) "What is your race?" (response options were "American Indian or Alaska Native," "Asian," "Black or African American," "Native Hawaiian or Other Pacific Islander," or "White"). For the second question, students could select more than one response option. For this report, students were classified as "Hispanic" if they answered "yes" to the first question, regardless of how they answered the second question. Students were classified as "Black" if they answered "no" to the first question and selected only "Black or African American" to the second question. Students were classified as "White" if they answered "no" to the first question and selected only "White" to the second question. Students were classified as "other" if they answered "no" to the first question and selected "American Indian or Alaska Native," "Asian," and/or "Native Hawaiian or Other Pacific Islander" or selected more than one response to the second question. Race/ethnicity was set to missing for students who did not answer the first question (n = 176) or for students who answered "no" to the first question but did not answer the second question (n = 48). For the 2005 state and local YRBS, race/ethnicity was computed from one question: "How do you describe yourself?" (response options were "American Indian or Alaska Native," "Asian," "Black or African American," "Hispanic or Latino," "Native Hawaiian or Other Pacific Islander," or "White"). Students could select more than one response option. For this report, students were classified as "Hispanic" if they selected "Hispanic or Latino" only or if they selected "Hispanic or Latino" plus any other response option. Students were classified as "Black" if they selected "Black or African-American" only. Students were classified as "White" if they selected "White" only. Students were classified as "other" if they selected "American Indian or Alaska Native" only, "Asian" only, and/or "Native Hawaiian or Other Pacific Islander" only or multiple response options except "Hispanic or Latino." To reflect the physical activity recommendations for youth in the 2005 Dietary Guidelines for Americans (engage in at least 60 minutes of physical activity on most, preferably all, days of the week [9]), a new question was added to the core questionnaire in 2005: "During the past 7 days, on how many days were you physically active for a total of at least 60 minutes per day? (Add up all the time you spend in any kind of physical activity that increases your heart rate and makes you breathe hard some of the time)." Data on the percentage of students who met recommended levels of physical activity (i.e., participated in at least 60 minutes/day of physical activity for >5 of the 7 days preceding the survey) are included in this report. The vigorous and moderate physical activity variables reported in previous YRBS reports are not individually included in this report, but are used to calculate the percentage of students who met previously recommended levels of physical activity, defined as participation in at least 20 minutes of vigorous physical activity (i.e., physical activity that made them sweat and breathe hard) on >3 of the 7 days preceding the survey and/or at least 30 minutes of moderate physical activity (i.e., physical activity that did not make them sweat and breathe hard) on >5 of the 7 days preceding the survey (10) and the percentage of students who engaged in no physical activity (i.e., had not engaged in any vigorous or moderate physical activity during the 7 days preceding the survey). The vigorous and moderate physical activity variables also remain measures for Healthy People 2010 objectives 22-6 and 22-7 (10). To determine the percentage of high school students at risk for becoming overweight, body mass index (kg/m2) (BMI) was calculated from self-reported height and weight. The BMI values were compared to sex and age specific reference data from the 2000 CDC Growth Charts (11). At risk for becoming overweight was defined as a BMI of >85th percentile and <95th percentile for age and sex. Overweight was defined as a BMI of >95th percentile for age and sex. A BMI of >95th percentile for age and sex among adolescents is approximately equivalent to a BMI of >30 among adults. For an adult, a BMI of 30 is approximately 30 pounds overweight. The reliability and validity of self-reported height and weight among high school students is described elsewhere (12). Analytic MethodsStatistical analyses were conducted on weighted data using SAS® (13) and SUDAAN (14) software to account for the complex sampling designs. Prevalence estimates and confidence intervals were computed for all variables and all data sets. In addition, for the 2005 national YRBS data, t-tests were used to determine pair-wise differences between subpopulations and temporal changes during 2003--2005 (15). Differences between prevalence estimates were considered statistically significant if the t-test p-value was <0.05 for main effects (sex, race/ethnicity, and grade), for interactions (sex by race/ethnicity and sex by grade), and for changes over time. Only statistically significant differences in prevalence estimates are reported in the results section in the following order: sex, sex by race/ethnicity, sex by grade, race/ethnicity, race/ethnicity by sex, grade, and grade by sex. For the national YRBS data, temporal changes from the earliest year of data collection to 2005 were analyzed for selected variables by using logistic regression analyses that controlled for sex, grade, and race/ethnicity, and that simultaneously assessed linear and quadratic time effects (15). Quadratic trends indicate a significant but nonlinear trend in the data over time. Trends that include significant linear and quadratic components demonstrate nonlinear variation (e.g., leveling off or change in direction) in addition to an overall increase or decrease over time. ResultsBehaviors That Contribute to Unintentional InjuriesSeat Belt Use Nationwide, 10.2% of students had rarely or never worn a seat belt when riding in a car driven by someone else (Table 2). Overall, the prevalence of having rarely or never worn a seat belt was higher among male (12.5%) than female (7.8%) students; higher among white male (11.5%), black male (17.7%), and Hispanic male (12.5%) than white female (7.2%), black female (9.4%), and Hispanic female (8.7%) students, respectively; and higher among 9th grade male (13.0%), 11th grade male (13.2%), and 12th grade male (14.1%) than 9th grade female (8.7%), 11th grade female (7.1%), and 12th grade female (7.5%) students, respectively. Overall, the prevalence of having rarely or never worn a seat belt was higher among black (13.4%) than white (9.4%) students and higher among black male (17.7%) than white male (11.5%) and Hispanic male (12.5%) students. Overall, the prevalence of having rarely or never worn a seat belt was higher among 9th grade (10.9%) and 12th grade (10.8%) than 10th grade (8.6%) students and higher among 9th grade male (13.0%), 11th grade male (13.2%), and 12th grade male (14.1%) than 10th grade male (9.5%) students. Prevalence of having rarely or never worn a seat belt ranged from 4.8% to 19.6% across state surveys (median: 12.5%) and from 6.5% to 24.1% across local surveys (median: 10.0%) (Table 3). Bicycle Helmet Use Among the 67.9% of students nationwide who had ridden a bicycle during the 12 months preceding the survey, 83.4% had rarely or never worn a bicycle helmet (Table 2). Overall, the prevalence of having rarely or never worn a bicycle helmet was higher among male (86.1%) than female (79.9%) students; higher among white male (84.4%) and Hispanic male (88.6%) than white female (77.9%) and Hispanic female (83.4%) students, respectively; and higher among 9th grade male (86.7%), 10th grade male (87.1%), and 11th grade male (85.1%) than 9th grade female (78.6%), 10th grade female (80.4%), and 11th grade female (78.4%) students, respectively. Overall, the prevalence of having rarely or never worn a bicycle helmet was higher among black (92.0%) than white (81.5%) and Hispanic (86.5%) students; higher among Hispanic (86.5%) than white (81.5%) students; higher among black female (90.1%) than white female (77.9%) and Hispanic female (83.4%) students; higher among black male (93.5%) than white male (84.4%) and Hispanic male (88.6%) students; and higher among Hispanic male (88.6%) than white male (84.4%) students. The prevalence of having rarely or never worn a bicycle helmet was higher among 12th grade female (83.3%) than 9th grade female (78.6%) and 11th grade female (78.4%) students. Prevalence of having rarely or never worn a bicycle helmet ranged from 55.9% to 94.6% across state surveys (median: 86.5%) and from 65.7% to 97.5% across local surveys (median: 88.8%) (Table 3). Motorcycle Helmet Use Among the 27.9% of students nationwide who had ridden a motorcycle during the 12 months preceding the survey, 36.5% had rarely or never worn a motorcycle helmet (Table 2). Overall, the prevalence of having rarely or never worn a motorcycle helmet was higher among black (44.8%) and Hispanic (47.1%) than white (33.7%) students; higher among Hispanic female (48.3%) than white female (30.2%) students; and higher among black male (48.0%) and Hispanic male (46.1%) than white male (35.6%) students. Overall, the prevalence of having rarely or never worn a motorcycle helmet was higher among 11th grade (38.2%) and 12th grade (39.5%) than 10th grade (31.9%) students and higher among 11th grade female (36.5%) than 10th grade female (28.1%) students. Rode with a Driver Who Had Been Drinking Alcohol During the 30 days preceding the survey, 28.5% of students nationwide had ridden one or more times in a car or other vehicle driven by someone who had been drinking alcohol (Table 4). Overall, the prevalence of having ridden with a driver who had been drinking alcohol was higher among female (29.6%) than male (27.2%) students; higher among white female (30.4%) than white male (26.2%) students; and higher among 10th grade female (29.5%) than 10th grade male (26.2%) students. Overall, the prevalence of having ridden with a driver who had been drinking alcohol was higher among white (28.3%) and Hispanic (36.1%) than black (24.1%) students; higher among Hispanic (36.1%) than white (28.3%) students; higher among white female (30.4%) and Hispanic female (34.7%) than black female (24.0%) students; higher among Hispanic female (34.7%) than white female (30.4%) students; and higher among Hispanic male (37.4%) than white male (26.2%) and black male (24.3%) students. Overall, the prevalence of having ridden with a driver who had been drinking alcohol was higher among 12th grade (30.1%) than 10th grade (27.8%) students. Prevalence of having ridden with a driver who had been drinking alcohol ranged from 13.4% to 37.4% across state surveys (median: 27.2%) and from 17.8% to 41.9% across local surveys (median: 27.2%) (Table 5). Drove When Drinking Alcohol During the 30 days preceding the survey, 9.9% of students nationwide had driven a car or other vehicle one or more times when they had been drinking alcohol (Table 4). Overall, the prevalence of having driven when they had been drinking alcohol was higher among male (11.7%) than female (8.1%) students; higher among white male (12.4%), black male (6.5%), and Hispanic male (14.6%) than white female (10.1%), black female (3.5%), and Hispanic female (6.4%) students, respectively; and higher among 10th grade male (8.3%), 11th grade male (14.7%), and 12th grade male (19.2%) than 10th grade female (4.8%), 11th grade female (9.5%), and 12th grade female (15.0%) students, respectively. Overall, the prevalence of having driven when they had been drinking alcohol was higher among white (11.3%) and Hispanic (10.5%) than black (4.9%) students; higher among white female (10.1%) than black female (3.5%) and Hispanic female (6.4%) students; higher among Hispanic female (6.4%) than black female (3.5%) students; and higher among white male (12.4%) and Hispanic male (14.6%) than black male (6.5%) students. Overall, the prevalence of having driven when they had been drinking alcohol was higher among 11th grade (12.1%) and 12th grade (17.1%) than 9th grade (5.5%) and 10th grade (6.6%) students; higher among 12th grade (17.1%) than 11th grade (12.1%) students; higher among 11th grade female (9.5%) and 12th grade female (15.0%) than 9th grade female (4.5%) and 10th grade female (4.8%) students; higher among 12th grade female (15.0%) than 11th grade female (9.5%) students; higher among 11th grade male (14.7%) and 12th grade male (19.2%) than 9th grade male (6.5%) and 10th grade male (8.3%) students; and higher among 12th grade male (19.2%) than 11th grade male (14.7%) students. Prevalence of having driven a car when they had been drinking alcohol ranged from 4.1% to 22.0% across state surveys (median: 11.0%) and from 3.7% to 13.6% across local surveys (median: 7.9%) (Table 5). Behaviors That Contribute to ViolenceCarried a Weapon Nationwide, 18.5% of students had carried a weapon (e.g., a gun, knife, or club) on >1 of the 30 days preceding the survey (Table 6). Overall, the prevalence of having carried a weapon was higher among male (29.8%) than female (7.1%) students; higher among white male (31.4%), black male (23.7%), and Hispanic male (29.8%) than white female (6.0%), black female (9.4%), and Hispanic female (7.8%) students, respectively; and higher among 9th grade male (31.6%), 10th grade male (30.6%), 11th grade male (28.6%), and 12th grade male (27.6%) than 9th grade female (8.1%), 10th grade female (7.8%), 11th grade female (6.1%), and 12th grade female (6.2%) students, respectively. The prevalence of having carried a weapon was higher among black female (9.4%) than white female (6.0%) students and higher among white male (31.4%) and Hispanic male (29.8%) than black male (23.7%) students. Overall, the prevalence of having carried a weapon was higher among 9th grade (19.9%) and 10th grade (19.4%) than 12th grade (16.9%) students. Prevalence of having carried a weapon ranged from 10.5% to 28.0% across state surveys (median: 18.4%) and from 11.9% to 25.0% across local surveys (median: 16.9%) (Table 7). Carried a Gun Nationwide, 5.4% of students had carried a gun on >1 of the 30 days preceding the survey (Table 6). Overall, the prevalence of having carried a gun was higher among male (9.9%) than female (0.9%) students; higher among white male (9.7%), black male (9.4%) and Hispanic male (11.6%) than white female (0.9%), black female (0.9%), and Hispanic female (1.3%) students, respectively; and higher among 9th grade male (11.3%), 10th grade male (9.4%), 11th grade male (9.1%), and 12th grade male (9.0%) than 9th grade female (1.0%), 10th grade female (1.0%), 11th grade female (0.9%), and 12th grade female (0.8%) students, respectively. Overall, the prevalence of having carried a gun was higher among 9th grade (6.2%) than 11th grade (4.9%) students. Prevalence of having carried a gun ranged from 2.3% to 11.2% across state surveys (median: 6.5%) and from 3.2% to 9.0% across local surveys (median: 5.2%) (Table 7). In a Physical Fight Nationwide, 35.9% of students had been in a physical fight one or more times during the 12 months preceding the survey (Table 8). Overall, the prevalence of having been in a physical fight was higher among male (43.4%) than female (28.1%) students; higher among white male (41.2%), black male (48.9%), and Hispanic male (49.5%) than white female (24.7%), black female (37.7%), and Hispanic female (32.5%) students, respectively; and higher among 9th grade male (49.6%), 10th grade male (45.2%), 11th grade male (38.2%), and 12th grade male (38.0%) than 9th grade female (37.2%), 10th grade female (27.6%), 11th grade female (25.0%), and 12th grade female (20.3%) students, respectively. Overall, the prevalence of having been in a physical fight was higher among black (43.1%) and Hispanic (41.0%) than white (33.1%) students; higher among black female (37.7%) than white female (24.7%) and Hispanic female (32.5%) students; higher among Hispanic female (32.5%) than white female (24.7%) students; and higher among black male (48.9%) and Hispanic male (49.5%) than white male (41.2%) students. Overall, the prevalence of having been in a physical fight was higher among 9th grade (43.5%) than 10th grade (36.6%), 11th grade (31.6%), and 12th grade (29.1%) students; higher among 10th grade (36.6%) than 11th grade (31.6%) and 12th grade (29.1%) students; higher among 9th grade female (37.2%) than 10th grade female (27.6%), 11th grade female (25.0%), and 12th grade female (20.3%) students; higher among 10th grade female (27.6%) and 11th grade female (25.0%) than 12th grade female (20.3%) students; higher among 9th grade male (49.6%) than 10th grade male (45.2%), 11th grade male (38.2%), and 12th grade male (38.0%) students; and higher among 10th grade male (45.2%) than 11th grade male (38.2%) and 12th grade male (38.0%) students. Prevalence of having been in a physical fight ranged from 24.3% to 36.7% across state surveys (median: 30.3%) and from 30.4% to 46.5% across local surveys (median: 36.2%) (Table 9). Injured in a Physical Fight Nationwide, 3.6% of students had been in a physical fight one or more times during the 12 months preceding the survey in which they were injured and had to be treated by a doctor or nurse (Table 8). Overall, the prevalence of having been injured in a physical fight was higher among male (4.8%) than female (2.4%) students; higher among white male (3.1%), black male (7.4%), and Hispanic male (7.5%) than white female (1.7%), black female (3.5%), and Hispanic female (3.2%) students, respectively; and higher among 9th grade male (5.8%), 10th grade male (4.3%), 11th grade male (4.0%), and 12th grade male (4.2%) than 9th grade female (3.4%), 10th grade female (1.9%), 11th grade female (1.9%), and 12th grade female (2.3%) students, respectively. Overall, the prevalence of having been injured in a physical fight was higher among black (5.4%) and Hispanic (5.3%) than white (2.4%) students; higher among black female (3.5%) and Hispanic female (3.2%) than white female (1.7%) students; and higher among black male (7.4%) and Hispanic male (7.5%) than white male (3.1%) students. Overall, the prevalence of having been injured in a physical fight was higher among 9th grade (4.6%) than 10th grade (3.1%), 11th grade (3.0%), and 12th grade (3.2%) students and higher among 9th grade female (3.4%) than 10th grade female (1.9%) and 11th grade female (1.9%) students. Prevalence of having been injured in a physical fight ranged from 2.3% to 5.2% across state surveys (median: 3.6%) and from 4.0% to 7.9% across local surveys (median: 4.8%) (Table 9). Dating Violence During the 12 months preceding the survey, 9.2% of students nationwide had been hit, slapped, or physically hurt on purpose by their boyfriend or girlfriend (i.e., dating violence) (Table 10). Overall, the prevalence of dating violence was higher among black (11.9%) and Hispanic (9.9%) than white (8.2%) students; higher among black female (12.0%) than white female (8.5%) and Hispanic female (9.0%) students; and higher among black male (11.8%) and Hispanic male (10.9%) than white male (8.0%) students. Overall, the prevalence of dating violence was higher among 11th grade (9.9%) and 12th grade (11.1%) than 9th grade (7.4%) students; higher among 12th grade (11.1%) than 10th grade (8.7%) students; higher among 12th grade female (10.7%) than 9th grade female (7.7%) students; and higher among 11th grade male (10.4%) and 12th grade male (11.4%) than 9th grade male (7.0%) and 10th grade male (7.8%) students. Prevalence of dating violence ranged from 6.0% to 16.3% across state surveys (median: 10.6%) and from 7.3% to 20.8% across local surveys (median: 11.4%) (Table 11). Forced to Have Sexual Intercourse Nationwide, 7.5% of students had ever been physically forced to have sexual intercourse when they did not want to (Table 10). Overall, the prevalence of having been forced to have sexual intercourse was higher among female (10.8%) than male (4.2%) students; higher among white female (10.8%), black female (11.5%), and Hispanic female (9.4%) than white male (3.1%), black male (7.1%), and Hispanic male (6.4%) students, respectively; and higher among 9th grade female (8.7%), 10th grade female (10.7%), 11th grade female (11.6%), and 12th grade female (12.7%) than 9th grade male (3.5%), 10th grade male (3.8%), 11th grade male (4.2%), and 12th grade male (5.3%) students, respectively. Overall, the prevalence of having been forced to have sexual intercourse was higher among black (9.3%) than white (6.9%) students and higher among black male (7.1%) and Hispanic male (6.4%) than white male (3.1%) students. Overall, the prevalence of having been forced to have sexual intercourse was higher among 11th grade (7.9%) and 12th grade (9.0%) than 9th grade (6.1%) students; higher among 12th grade (9.0%) than 10th grade (7.2%) students; higher among 12th grade female (12.7%) than 9th grade female (8.7%) students; and higher among 12th grade male (5.3%) than 9th grade male (3.5%) students. Prevalence of having been forced to have sexual intercourse ranged from 5.1% to 11.2% across state surveys (median: 8.4%) and from 5.0% to 13.1% across local surveys (median: 8.5%) (Table 11). Carried a Weapon on School Property Nationwide, 6.5% of students had carried a weapon (e.g., a gun, knife, or club) on school property on >1 of the 30 days preceding the survey (Table 12). Overall, the prevalence of having carried a weapon on school property was higher among male (10.2%) than female (2.6%) students; higher among white male (10.1%), black male (6.8%), and Hispanic male (13.7%) than white female (2.0%), black female (3.3%), and Hispanic female (2.6%) students, respectively; and higher among 9th grade male (9.8%), 10th grade male (10.5%), 11th grade male (9.8%), and 12th grade male (10.8%) than 9th grade female (2.8%), 10th grade female (3.0%), 11th grade female (2.1%), and 12th grade female (2.5%) students, respectively. Overall, the prevalence of having carried a weapon on school property was higher among Hispanic (8.2%) than black (5.1%) students; higher among black female (3.3%) than white female (2.0%) students; and higher among Hispanic male (13.7%) than black male (6.8%) students. Prevalence of having carried a weapon on school property ranged from 3.1% to 10.5% across state surveys (median: 6.5%) and from 3.8% to 13.6% across local surveys (median: 5.8%) (Table 13). Threatened or Injured with a Weapon on School Property During the 12 months preceding the survey, 7.9% of students nationwide had been threatened or injured with a weapon (e.g., a gun, knife, or club) on school property one or more times (Table 12). Overall, the prevalence of having been threatened or injured with a weapon on school property was higher among male (9.7%) than female (6.1%) students; higher among white male (8.7%), black male (10.2%), and Hispanic male (11.9%) than white female (5.7%), black female (6.1%), and Hispanic female (7.5%) students, respectively; and higher among 9th grade male (12.1%), 10th grade male (11.0%), 11th grade male (7.1%), and 12th grade male (7.3%) than 9th grade female (8.8%), 10th grade female (6.5%), 11th grade female (3.9%), and 12th grade female (4.2%) students, respectively. Overall, the prevalence of having been threatened or injured with a weapon on school property was higher among Hispanic (9.8%) than white (7.2%) students and higher among Hispanic male (11.9%) than white male (8.7%) students. Overall, the prevalence of having been threatened or injured with a weapon on school property was higher among 9th grade (10.5%) and 10th grade (8.8%) than 11th grade (5.5%) and 12th grade (5.8%) students; higher among 9th grade female (8.8%) than 10th grade female (6.5%), 11th grade female (3.9%), and 12th grade female (4.2%) students; higher among 10th grade female (6.5%) than 11th grade female (3.9%) and 12th grade female (4.2%) students; and higher among 9th grade male (12.1%) and 10th grade male (11.0%) than 11th grade male (7.1%) and 12th grade male (7.3%) students. Prevalence of having been threatened or injured with a weapon on school property ranged from 5.4% to 11.7% across state surveys (median: 8.0%) and from 6.5% to 15.1% across local surveys (median: 9.3%) (Table 13). In a Physical Fight on School Property Nationwide, 13.6% of students had been in a physical fight on school property one or more times during the 12 months preceding the survey (Table 14). Overall, the prevalence of having been in a physical fight on school property was higher among male (18.2%) than female (8.8%) students; higher among white male (16.2%), black male (20.1%), and Hispanic male (24.4%) than white female (6.9%), black female (14.0%), and Hispanic female (12.1%) students, respectively; and higher among 9th grade male (24.0%), 10th grade male (20.0%), 11th grade male (14.1%), and 12th grade male (11.8%) than 9th grade female (13.7%), 10th grade female (8.4%), 11th grade female (6.6%), and 12th grade female (5.3%) students, respectively. Overall, the prevalence of having been in a physical fight on school property was higher among black (16.9%) and Hispanic (18.3%) than white (11.6%) students; higher among black female (14.0%) and Hispanic female (12.1%) than white female (6.9%) students; and higher among Hispanic male (24.4%) than white male (16.2%) students. Overall, the prevalence of having been in a physical fight on school property was higher among 9th grade (18.9%) than 10th grade (14.4%), 11th grade (10.4%), and 12th grade (8.5%) students; higher among 10th grade (14.4%) than 11th grade (10.4%) and 12th grade (8.5%) students; higher among 9th grade female (13.7%) than 10th grade female (8.4%), 11th grade female (6.6%), and 12th grade female (5.3%) students; higher among 10th grade female (8.4%) than 12th grade female (5.3%) students; higher among 9th grade male (24.0%) than 10th grade male (20.0%), 11th grade male (14.1%), and 12th grade male (11.8%) students; and higher among 10th grade male (20.0%) than 11th grade male (14.1%) and 12th grade male (11.8%) students. Prevalence of having been in a physical fight on school property ranged from 8.4% to 15.6% across state surveys (median: 11.4%) and from 10.4% to 22.0% across local surveys (median: 14.7%) (Table 15). Did Not Go to School Because of Safety Concerns Nationwide, 6.0% of students had not gone to school on >1 of the 30 days preceding the survey because they felt they would be unsafe at school or on their way to or from school (Table 14). Overall, the prevalence of having not gone to school because of safety concerns was higher among black (8.7%) and Hispanic (10.2%) than white (4.4%) students; higher among black female (9.2%) and Hispanic female (9.7%) than white female (4.9%) students; and higher among black male (8.2%) and Hispanic male (10.7%) than white male (3.9%) students. Overall, the prevalence of having not gone to school because of safety concerns was higher among 9th grade (7.7%) and 10th grade (6.3%) than 11th grade (4.7%) and 12th grade (4.9%) students; higher among 9th grade female (8.1%) and 10th grade female (7.3%) than 11th grade female (4.9%) and 12th grade female (4.5%) students; and higher among 9th grade male (7.3%) than 11th grade male (4.5%) and 12th grade male (5.1%) students. Prevalence of having not gone to school because of safety concerns ranged from 3.0% to 9.4% across state surveys (median: 5.4%) and from 6.5% to 19.8% across local surveys (median: 8.7%) (Table 15). Had Property Stolen or Damaged on School Property Nationwide, 29.8% of students had had their property (e.g., car, clothing, or books) stolen or deliberately damaged on school property one or more times during the 12 months preceding the survey (Table 14). Overall, the prevalence of having property stolen or damaged on school property was higher among male (31.4%) than female (28.0%) students; higher among Hispanic male (36.1%) than Hispanic female (27.3%) students; and higher among 11th grade male (30.6%) and 12th grade male (29.1%) than 11th grade female (23.5%) and 12th grade female (25.1%) students, respectively. The prevalence of having property stolen or damaged on school property was higher among Hispanic male (36.1%) than white male (30.2%) students. Overall, the prevalence of having property stolen or damaged on school property was higher among 9th grade (33.9%) than 10th grade (29.5%), 11th grade (27.0%), and 12th grade (27.1%) students; higher among 9th grade female (33.4%) than 10th grade female (28.3%), 11th grade female (23.5%), and 12th grade female (25.1%) students; higher among 10th grade female (28.3%) than 11th grade female (23.5%) students; and higher among 9th grade male (34.2%) than 12th grade male (29.1%) students. Prevalence of having property stolen or deliberately damaged on school property ranged from 21.9% to 39.3% across state surveys (median: 28.3%) and from 23.0% to 35.4% across local surveys (median: 26.9%) (Table 15). Felt Sad or Hopeless During the 12 months preceding the survey, 28.5% of students nationwide had felt so sad or hopeless almost every day for >2 weeks in a row that they stopped doing some usual activities (Table 16). Overall, the prevalence of having felt sad or hopeless almost every day for >2 weeks was higher among female (36.7%) than male (20.4%) students; higher among white female (33.4%), black female (36.9%), and Hispanic female (46.7%) than white male (18.4%), black male (19.5%), and Hispanic male (26.0%) students, respectively; and higher among 9th grade female (38.5%), 10th grade female (37.0%), 11th grade female (38.0%), and 12th grade female (32.6%) than 9th grade male (19.9%), 10th grade male (21.3%), 11th grade male (19.4%), and 12th grade male (20.2%) students, respectively. Overall, the prevalence of having felt sad or hopeless almost every day for >2 weeks was higher among Hispanic (36.2%) than white (25.8%) and black (28.4%) students; higher among Hispanic female (46.7%) than white female (33.4%) and black female (36.9%) students; and higher among Hispanic male (26.0%) than white male (18.4%) and black male (19.5%) students. The prevalence of having felt sad or hopeless almost every day for >2 weeks was higher among 9th grade female (38.5%), 10th grade female (37.0%), and 11th grade female (38.0%) than 12th grade female (32.6%) students. Prevalence of having felt sad or hopeless almost every day for >2 weeks ranged from 20.3% to 34.3% across state surveys (median: 27.3%) and from 21.8% to 37.6% across local surveys (median: 29.7%) (Table 17). Seriously Considered Attempting Suicide Nationwide, 16.9% of students had seriously considered attempting suicide during the 12 months preceding the survey (Table 16). Overall, the prevalence of having seriously considered attempting suicide was higher among female (21.8%) than male (12.0%) students; higher among white female (21.5%), black female (17.1%), and Hispanic female (24.2%) than white male (12.4%), black male (7.0%), and Hispanic male (11.9%) students, respectively; and higher among 9th grade female (23.9%), 10th grade female (23.0%), 11th grade female (21.6%), and 12th grade female (18.0%) than 9th grade male (12.2%), 10th grade male (11.9%), 11th grade male (11.9%), and 12th grade male (11.6%) students, respectively. Overall, the prevalence of having seriously considered attempting suicide was higher among white (16.9%) and Hispanic (17.9%) than black (12.2%) students; higher among white female (21.5%) and Hispanic female (24.2%) than black female (17.1%) students; and higher among white male (12.4%) and Hispanic male (11.9%) than black male (7.0%) students. Overall, the prevalence of having seriously considered attempting suicide was higher among 9th grade (17.9%) and 10th grade (17.3%) than 12th grade (14.8%) students and higher among 9th grade female (23.9%) and 10th grade female (23.0%) than 12th grade female (18.0%) students. Prevalence of having seriously considered attempting suicide ranged from 12.7% to 20.7% across state surveys (median: 16.0%) and from 10.8% to 17.9% across local surveys (median: 13.8%) (Table 17). Made a Suicide Plan During the 12 months preceding the survey, 13.0% of students nationwide had made a plan about how they would attempt suicide (Table 16). Overall, the prevalence of having made a suicide plan was higher among female (16.2%) than male (9.9%) students; higher among white female (15.4%), black female (13.5%), and Hispanic female (18.5%) than white male (9.7%), black male (5.5%), and Hispanic male (10.7%) students, respectively; and higher among 9th grade female (17.6%), 10th grade female (18.1%), 11th grade female (16.3%), and 12th grade female (12.0%) than 9th grade male (10.2%), 10th grade male (10.3%), 11th grade male (9.5%), and 12th grade male (9.0%) students, respectively. Overall, the prevalence of having made a suicide plan was higher among white (12.5%) and Hispanic (14.5%) than black (9.6%) students; higher among Hispanic (14.5%) than white (12.5%) students; higher among Hispanic female (18.5%) than black female (13.5%) students; and higher among white male (9.7%) and Hispanic male (10.7%) than black male (5.5%) students. Overall, the prevalence of having made a suicide plan was higher among 9th grade (13.9%), 10th grade (14.1%), and 11th grade (12.9%) than 12th grade (10.5%) students and higher among 9th grade female (17.6%), 10th grade female (18.1%), and 11th grade female (16.3%) than 12th grade female (12.0%) students. Prevalence of having made a suicide plan ranged from 9.6% to 17.2% across state surveys (median: 13.1%) and from 8.7% to 16.1% across local surveys (median: 11.7%) (Table 17). Attempted Suicide Nationwide, 8.4% of students had actually attempted suicide one or more times during the 12 months preceding the survey (Table 18). Overall, the prevalence of having actually attempted suicide was higher among female (10.8%) than male (6.0%) students; higher among white female (9.3%), black female, (9.8%), and Hispanic female (14.9%) than white male (5.2%), black male (5.2%), and Hispanic male (7.8%) students, respectively; and higher among 9th grade female (14.1%), 10th grade female (10.8%), 11th grade female (11.0%), and 12th grade female (6.5%) than 9th grade male (6.8%), 10th grade male (7.6%), 11th grade male (4.5%), and 12th grade male (4.3%) students, respectively. Overall, the prevalence of having actually attempted suicide was higher among Hispanic (11.3%) than white (7.3%) and black (7.6%) students; higher among Hispanic female (14.9%) than white female (9.3%) and black female (9.8%) students; and higher among Hispanic male (7.8%) than white male (5.2%) students. Overall, the prevalence of having actually attempted suicide was higher among 9th grade (10.4%) than 11th grade (7.8%) and 12th grade (5.4%) students; higher among 10th grade (9.1%), and 11th grade (7.8%) than 12th grade (5.4%) students; higher among 9th grade female (14.1%) than 10th grade female (10.8%) and 12th grade female (6.5%) students; higher among 10th grade female (10.8%) and 11th grade female (11.0%) than 12th grade female (6.5%) students; and higher among 10th grade male (7.6%) than 11th grade male (4.5%) and 12th grade male (4.3%) students. Prevalence of having actually attempted suicide ranged from 6.2% to 13.1% across state surveys (median: 8.8%) and from 7.2% to 13.8% across local surveys (median: 9.9%) (Table 19). Suicide Attempt Treated by a Doctor or Nurse During the 12 months preceding the survey, 2.3% of students nationwide had made a suicide attempt that resulted in an injury, poisoning, or overdose that had to be treated by a doctor or nurse (Table 18). Overall, the prevalence of having made a suicide attempt that required medical attention was higher among female (2.9%) than male (1.8%) students; higher among white female (2.7%) than white male (1.5%) students; and higher among 9th grade female (4.0%), 11th grade female (2.9%), and 12th grade female (2.2%) than 9th grade male (2.1%), 11th grade male (1.4%), and 12th grade male (1.0%) students, respectively. Overall, the prevalence of having made a suicide attempt that required medical attention was higher among Hispanic (3.2%) than white (2.1%) students. Overall, the prevalence of having made a suicide attempt that required medical attention was higher among 9th grade (3.0%) than 12th grade (1.6%) students; higher among 9th grade female (4.0%) than 10th grade female (2.4%) and 12th grade female (2.2%) students; and higher among 10th grade male (2.2%) than 12th grade male (1.0%) students. Prevalence of having made a suicide attempt that required medical attention ranged from 1.0% to 5.1% across state surveys (median: 2.7%) and from 2.2% to 5.5% across local surveys (median: 3.3%) (Table 19). Tobacco UseLifetime Cigarette Use Nationwide, 54.3% of students had ever tried cigarette smoking (even one or two puffs) (i.e., lifetime cigarette use) (Table 20). Overall, the prevalence of lifetime cigarette use was higher among male (55.9%) than female (52.7%) students and higher among Hispanic male (62.1%) than Hispanic female (52.0%) students. The prevalence of lifetime cigarette use was higher among Hispanic male (62.1%) than white male (54.9%) students. Overall, the prevalence of lifetime cigarette use was higher among 10th grade (52.5%), 11th grade (57.5%), and 12th grade (60.3%) than 9th grade (48.7%) students; higher among 11th grade (57.5%) and 12th grade (60.3%) than 10th grade (52.5%) students; higher among 11th grade female (55.3%) and 12th grade female (58.3%) than 9th grade female (47.7%) students; higher among 12th grade female (58.3%) than 10th grade female (50.8%) students; and higher among 11th grade male (59.6%) and 12th grade male (62.2%) than 9th grade male (49.8%) and 10th grade male (54.1%) students. Prevalence of lifetime cigarette use ranged from 25.0% to 63.4% across state surveys (median: 54.5%) and from 35.8% to 62.7% across local surveys (median: 48.6%) (Table 21). Lifetime Daily Cigarette Use Nationwide, 13.4% of students had ever smoked at least one cigarette every day for 30 days (i.e., lifetime daily cigarette use) (Table 20). The prevalence of lifetime daily cigarette use was higher among black male (7.5%) than black female (3.2%) students. Overall, the prevalence of lifetime daily cigarette use was higher among white (16.1%) than black (5.2%) and Hispanic (10.4%) students; higher among Hispanic (10.4%) than black (5.2%) students; higher among white female (17.0%) than black female (3.2%) and Hispanic female (9.2%) students; higher among Hispanic female (9.2%) than black female (3.2%) students; and higher among white male (15.1%) and Hispanic male (11.5%) than black male (7.5%) students. Overall, the prevalence of lifetime daily cigarette use was higher among 11th grade (15.3%) and 12th grade (17.8%) than 9th grade (10.0%) and 10th grade (11.5%) students; higher among 11th grade female (16.0%) and 12th grade female (17.4%) than 9th grade female (10.2%) and 10th grade female (11.5%) students; higher among 11th grade male (14.5%) and 12th grade male (18.1%) than 9th grade male (9.9%) students; and higher among 12th grade male (18.1%) than 10th grade male (11.6%) students. Prevalence of lifetime daily cigarette use ranged from 4.5% to 20.0% across state surveys (median: 13.8%) and from 3.6% to 11.0% across local surveys (median: 7.3%) (Table 21). Current Cigarette Use Nationwide, 23.0% of students had smoked cigarettes on >1 of the 30 days preceding the survey (i.e., current cigarette use) (Table 22). The prevalence of current cigarette use was higher among Hispanic male (24.8%) than Hispanic female (19.2%) students. Overall, the prevalence of current cigarette use was higher among white (25.9%) and Hispanic (22.0%) than black (12.9%) students; higher among white female (27.0%) than black female (11.9%) and Hispanic female (19.2%) students; higher among Hispanic female (19.2%) than black female (11.9%) students; and higher among white male (24.9%) and Hispanic male (24.8%) than black male (14.0%) students. Overall, the prevalence of current cigarette use was higher among 11th grade (24.3%) and 12th grade (27.6%) than 9th grade (19.7%) students; higher among 12th grade (27.6%) than 10th grade (21.4%) and 11th grade (24.3%) students; higher among 11th grade female (24.3%) and 12th grade female (26.0%) than 9th grade female (20.5%) students; higher among 11th grade male (24.2%) and 12th grade male (29.1%) than 9th grade male (18.9%) students; and higher among 12th grade male (29.1%) than 10th grade male (21.1%) and 11th grade male (24.2%) students. Prevalence of current cigarette use ranged from 7.4% to 28.6% across state surveys (median: 21.2%) and from 6.4% to 19.7% across local surveys (median: 12.9%) (Table 23). Current Frequent Cigarette Use Nationwide, 9.4% of students had smoked cigarettes on >20 of the 30 days preceding the survey (i.e., current frequent cigarette use) (Table 22). The prevalence of current frequent cigarette use was higher among black male (5.1%) than black female (2.4%) students. Overall, the prevalence of current frequent cigarette use was higher among white (11.2%) than black (3.7%) and Hispanic (6.5%) students; higher among Hispanic (6.5%) than black (3.7%) students; higher among white female (11.7%) than black female (2.4%) and Hispanic female (4.7%) students; and higher among white male (10.6%) than black male (5.1%) students. Overall, the prevalence of current frequent cigarette use was higher among 11th grade (10.3%) and 12th grade (13.2%) than 9th grade (6.9%) and 10th grade (7.7%) students; higher among 12th grade (13.2%) than 11th grade (10.3%) students; higher among 11th grade female (10.0%) and 12th grade female (12.5%) than 9th grade female (7.0%) students; higher among 12th grade female (12.5%) than 10th grade female (8.4%) students; higher among 11th grade male (10.5%) and 12th grade male (13.9%) than 9th grade male (6.7%) and 10th grade male (7.0%) students; and higher among 12th grade male (13.9%) than 11th grade male (10.5%) students. Prevalence of current frequent cigarette use ranged from 2.1% to 14.5% across state surveys (median: 8.8%) and from 1.2% to 7.2% across local surveys (median: 3.7%) (Table 23). Smoked >10 Cigarettes/Day Among the 23.0% of students nationwide who reported current cigarette use, 10.7% of students had smoked >10 cigarettes/day on the days they smoked during the 30 days preceding the survey (Table 22). Overall, the prevalence of having smoked >10 cigarettes/day was higher among male (14.2%) than female (7.2%) students; higher among white male (16.2%) than white female (7.5%) students; and higher among 9th grade male (12.8%), 11th grade male (17.9%), and 12th grade male (16.9%) than 9th grade female (4.6%), 11th grade female (8.6%), and 12th grade female (9.2%) students, respectively. Overall, the prevalence of having smoked >10 cigarettes/day was higher among white (11.7%) than black (3.5%) students; higher among white female (7.5%) than black female (2.5%) students; and higher among white male (16.2%) than black male (4.4%) students. Overall, the prevalence of having smoked >10 cigarettes/day was higher among 12th grade (13.2%) than 9th grade (8.6%) students; higher among 11th grade (13.1%) and 12th grade (13.2%) than 10th grade (6.6%) students; higher among 11th grade female (8.6%) than 9th grade female (4.6%) students; and higher among 9th grade male (12.8%), 11th grade male (17.9%), and 12th grade male (16.9%) than 10th grade male (6.7%) students. Prevalence of having smoked >10 cigarettes/day ranged from 2.9% to 22.3% across state surveys (median: 10.5%) and from 3.1% to 11.6% across local surveys (median: 6.3%) (Table 23). Tried to Quit Smoking Cigarettes Among the 23.0% of students nationwide who reported current cigarette use, 54.6% had tried to quit smoking cigarettes during the 12 months preceding the survey (Table 24). Overall, the prevalence of having tried to quit smoking cigarettes was higher among female (60.3%) than male (48.9%) students; higher among white female (61.4%) than white male (47.4%) students; and higher among 9th grade female (58.2%), 11th grade female (57.7%), and 12th grade female (61.7%) than 9th grade male (47.5%), 11th grade male (47.5%), and 12th grade male (48.2%) students, respectively. Overall, the prevalence of having tried to quit smoking cigarettes was higher among black (61.8%) than white (54.6%) and Hispanic (53.4%) students and higher among black male (57.7%) than white male (47.4%) students. Prevalence of having tried to quit smoking cigarettes ranged from 49.0% to 65.1% across state surveys (median: 56.6%) and from 42.8% to 65.0% across local surveys (median: 55.5%) (Table 25). Bought Cigarettes in a Store or Gas Station Nationwide, 15.2% of the 19.1% students who reported current cigarette use and were aged <18 years usually got their own cigarettes by buying them in a store (i.e., convenience store, supermarket, or discount store) or gas station during the 30 days preceding the survey (Table 24). Overall, the prevalence of having bought their own cigarettes in a store or gas station was higher among male (18.8%) than female (11.7%) students; higher among white male (17.4%) than white female (11.1%) students; and higher among 9th grade male (11.6%) and 11th grade male (25.8%) than 9th grade female (5.0%) and 11th grade female (14.8%) students, respectively. Overall, the prevalence of having bought their own cigarettes in a store or gas station was higher among 11th grade (20.3%) and 12th grade (30.8%) than 9th grade (8.2%) and 10th grade (10.6%) students; higher among 12th grade (30.8%) than 11th grade (20.3%) students; higher among 11th grade female (14.8%) and 12th grade female (27.7%) than 9th grade female (5.0%) and 10th grade female (7.8%) students; higher among 12th grade female (27.7%) than 11th grade female (14.8%) students; and higher among 11th grade male (25.8%) and 12th grade male (34.0%) than 9th grade male (11.6%) and 10th grade male (13.4%) students. Prevalence of having bought their own cigarettes in a store or gas station ranged from 3.8% to 29.6% across state surveys (median: 15.6%) and from 13.4% to 36.5% across local surveys (median: 21.6%) (Table 25). Not Asked to Show Proof of Age When Buying Cigarettes in a Store Among the 12.9% of students nationwide who tried to buy cigarettes in a store during the 30 days preceding the survey, 48.5% of students were not asked to show proof of age (Table 24). The prevalence of not having been asked to show proof of age when buying cigarettes in a store was higher among 9th grade (70.4%) than 10th grade (55.6%), 11th grade (59.2%), and 12th grade (32.7%) students; higher among 10th grade (55.6%) and 11th grade (59.2%) than 12th grade (32.7%) students; higher among 11th grade female (57.7%) than 12th grade female (29.3%) students; and higher among 9th grade male (65.7%), 10th grade male (55.6%), and 11th grade male (59.6%) than 12th grade male (34.9%) students. Current Smokeless Tobacco Use Nationwide, 8.0% of students had used smokeless tobacco (e.g., chewing tobacco, snuff, or dip) on >1 of the 30 days preceding the survey (i.e., current smokeless tobacco use) (Table 26). Overall, the prevalence of current smokeless tobacco use was higher among male (13.6%) than female (2.2%) students; higher among white male (17.6%), black male (3.0%), and Hispanic male (8.6%) than white female (2.7%), black female (0.4%), and Hispanic female (1.5%) students, respectively; and higher among 9th grade male (11.8%), 10th grade male (12.8%), 11th grade male (14.8%), and 12th grade male (15.5%) than 9th grade female (3.4%), 10th grade female (1.9%), 11th grade female (2.1%), and 12th grade female (1.3%) students, respectively. Overall, the prevalence of current smokeless tobacco use was higher among white (10.2%) than black (1.7%) and Hispanic (5.1%) students; higher among Hispanic (5.1%) than black (1.7%) students; higher among white female (2.7%) and Hispanic female (1.5%) than black female (0.4%) students; higher among white male (17.6%) than black male (3.0%) and Hispanic male (8.6%) students; and higher among Hispanic male (8.6%) than black male (3.0%) students. The prevalence of current smokeless tobacco use was higher among 9th grade female (3.4%) than 10th grade female (1.9%) and 12th grade female (1.3%) students. Prevalence of current smokeless tobacco use ranged from 2.9% to 14.9% across state surveys (median: 8.4%) and from 1.6% to 7.7% across local surveys (median: 2.7%) (Table 27). Current Cigar Use Nationwide, 14.0% of students had smoked cigars, cigarillos, or little cigars on >1 of the 30 days preceding the survey (i.e., current cigar use) (Table 26). Overall, the prevalence of current cigar use was higher among male (19.2%) than female (8.7%) students; higher among white male (21.0%), black male (12.3%), and Hispanic male (20.0%) than white female (8.6%), black female (8.3%), and Hispanic female (9.1%) students, respectively; and higher among 9th grade male (15.5%), 10th grade male (15.7%), 11th grade male (21.3%), and 12th grade male (25.8%) than 9th grade female (8.7%), 10th grade female (9.4%), 11th grade female (7.3%), and 12th grade female (9.4%) students, respectively. Overall, the prevalence of current cigar use was higher among white (14.9%) and Hispanic (14.6%) than black (10.3%) students and higher among white male (21.0%) and Hispanic male (20.0%) than black male (12.3%) students. Overall, the prevalence of current cigar use was higher among 11th grade (14.3%) and 12th grade (17.5%) than 9th grade (12.2%) students; higher among 12th grade (17.5%) than 10th grade (12.6%) and 11th grade (14.3%) students; higher among 11th grade male (21.3%) and 12th grade male (25.8%) than 9th grade male (15.5%) and 10th grade male (15.7%) students; and higher among 12th grade male (25.8%) than 11th grade male (21.3%) students. Prevalence of current cigar use ranged from 5.4% to 21.3% across state surveys (median: 15.2%) and from 5.7% to 19.5% across local surveys (median: 10.1%) (Table 27). Current Tobacco Use Nationwide, 28.4% of students had reported current cigarette use, current smokeless tobacco use, or current cigar use (i.e., current tobacco use) (Table 26). Overall, the prevalence of current tobacco use was higher among male (31.7%) than female (25.1%) students; higher among white male (35.7%) and Hispanic male (30.6%) than white female (29.3%) and Hispanic female (19.2%) students, respectively; and higher among 9th grade male (26.8%), 11th grade male (34.6%), and 12th grade male (39.1%) than 9th grade female (22.0%), 11th grade female (25.4%), and 12th grade female (29.3%) students, respectively. Overall, the prevalence of current tobacco use was higher among white (32.5%) than black (16.5%) and Hispanic (24.9%) students; higher among Hispanic (24.9%) than black (16.5%) students; higher among white female (29.3%) than black female (14.9%) and Hispanic female (19.2%) students; higher among Hispanic female (19.2%) than black female (14.9%) students; and higher among white male (35.7%) and Hispanic male (30.6%) than black male (18.1%) students. Overall, the prevalence of current tobacco use is higher among 11th grade (29.9%) and 12th grade (34.2%) than 9th grade (24.4%) students; higher among 12th grade (34.2%) than 10th grade (26.4%) and 11th grade (29.9%) students; higher among 12th grade female (29.3%) than 9th grade female (22.0%) students; higher among 11th grade male (34.6%) and 12th grade male (39.1%) than 9th grade male (26.8%) and 10th grade male (28.2%) students; and higher among 12th grade male (39.1%) than 11th grade male (34.6%) students. Prevalence of current tobacco use ranged from 9.0% to 35.2% across state surveys (median: 27.8%) and from 10.3% to 23.5% across local surveys (median: 16.4%) (Table 27). Alcohol and Other Drug UseLifetime Alcohol Use Nationwide, 74.3% of students had had at least one drink of alcohol on >1 day during their life (i.e., lifetime alcohol use) (Table 28). The prevalence of lifetime alcohol use was higher among black female (71.4%) than black male (66.5%) students. Overall, the prevalence of lifetime alcohol use was higher among white (75.3%) and Hispanic (79.4%) than black (69.0%) students; higher among Hispanic female (79.0%) than black female (71.4%) students; higher among white male (75.0%) and Hispanic male (79.9%) than black male (66.5%) students; and higher among Hispanic male (79.9%) than white male (75.0%) students. Overall, the prevalence of lifetime alcohol use was higher among 10th grade (74.4%), 11th grade (76.3%), and 12th grade (81.7%) than 9th grade (66.5%) students; higher among 12th grade (81.7%) than 10th grade (74.4%) and 11th grade (76.3%) students; higher among 10th grade female (75.6%), 11th grade female (77.1%), and 12th grade female (81.8%) than 9th grade female (66.5%) students; higher among 12th grade female (81.8%) than 10th grade female (75.6%) students; higher among 10th grade male (73.2%), 11th grade male (75.5%), and 12th grade male (81.5%) than 9th grade male (66.6%) students; and higher among 12th grade male (81.5%) than 10th grade male (73.2%) and 11th grade male (75.5%) students. Prevalence of lifetime alcohol use ranged from 32.9% to 80.2% across state surveys (median: 74.1%) and from 44.9% to 82.3% across local surveys (median: 70.8%) (Table 29). Current Alcohol Use Nationwide, 43.3% of students had had at least one drink of alcohol on >1 of the 30 days preceding the survey (i.e., current alcohol use) (Table 28). The prevalence of current alcohol use was higher among Hispanic male (48.9%) than Hispanic female (44.8%) students. Overall, the prevalence of current alcohol use was higher among white (46.4%) and Hispanic (46.8%) than black (31.2%) students; higher among white female (45.9%) and Hispanic female (44.8%) than black female (32.5%) students; and higher among white male (47.0%) and Hispanic male (48.9%) than black male (29.6%) students. Overall, the prevalence of current alcohol use was higher among 10th grade (42.0%), 11th grade (46.0%), and 12th grade (50.8%) students than 9th grade (36.2%) students; higher among 12th grade (50.8%) than 10th grade (42.0%) and 11th grade (46.0%) students; higher among 10th grade female (42.7%), 11th grade female (44.2%), and 12th grade female (49.6%) than 9th grade female (36.2%) students; higher among 12th grade female (49.6%) than 10th grade female (42.7%) students; and higher among 11th grade male (47.8%) and 12th grade male (52.0%) than 9th grade male (36.3%) and 10th grade male (41.4%) students. Prevalence of current alcohol use ranged from 15.8% to 49.2% across state surveys (median: 42.8%) and from 23.1% to 44.3% across local surveys (median: 38.3%) (Table 29). Episodic Heavy Drinking Nationwide, 25.5% of students had had >5 drinks of alcohol in a row (i.e., within a couple of hours) on >1 of the 30 days preceding the survey (i.e., episodic heavy drinking) (Table 28). Overall, the prevalence of episodic heavy drinking was higher among male (27.5%) than female (23.5%) students; higher among white male (31.8%) and Hispanic male (28.7%) than white female (28.1%) and Hispanic female (21.9%) students, respectively; and higher among 11th grade male (30.4%) and 12th grade male (36.2%) than 11th grade female (25.0%) and 12th grade female (29.2%) students, respectively. Overall, the prevalence of episodic heavy drinking was higher among white (29.9%) than black (11.1%) and Hispanic (25.3%) students; higher among Hispanic (25.3%) than black (11.1%) students; higher among white female (28.1%) than black female (10.4%) and Hispanic female (21.9%) students; higher among Hispanic female (21.9%) than black female (10.4%) students; and higher among white male (31.8%) and Hispanic male (28.7%) than black male (11.9%) students. Overall, the prevalence of episodic heavy drinking was higher among 10th grade (24.6%), 11th grade (27.6%), and 12th grade (32.8%) than 9th grade (19.0%) students; higher among 12th grade (32.8%) than 10th grade (24.6%) and 11th grade (27.6%) students; higher among 10th grade female (24.1%), 11th grade female (25.0%), and 12th grade female (29.2%) than 9th grade female (17.3%) students; higher among 12th grade female (29.2%) than 10th grade female (24.1%) and 11th grade female (25.0%) students; higher among 11th grade male (30.4%) and 12th grade male (36.2%) than 9th grade male (20.7%) and 10th grade male (25.1%) students; and higher among 12th grade male (36.2%) than 11th grade male (30.4%) students. Prevalence of episodic heavy drinking ranged from 8.8% to 34.4% across state surveys (median: 26.3%) and from 8.6% to 23.9% across local surveys (median: 17.6%) (Table 29). Lifetime Marijuana Use Nationwide, 38.4% of students had used marijuana one or more times during their life (i.e., lifetime marijuana use) (Table 30). Overall, the prevalence of lifetime marijuana use was higher among male (40.9%) than female (35.9%) students; higher among white male (40.0%), black male (43.8%), and Hispanic male (47.7%) than white female (36.0%), black female (37.8%), and Hispanic female (37.5%) students, respectively; and higher among 11th grade male (45.1%) and 12th grade male (52.4%) than 11th grade female (39.4%) and 12th grade female (42.8%) students, respectively. Overall, the prevalence of lifetime marijuana use was higher among Hispanic (42.6%) than white (38.0%) students and higher among Hispanic male (47.7%) than white male (40.0%) students. Overall, the prevalence of lifetime marijuana use was higher among 10th grade (37.4%), 11th grade (42.3%), and 12th grade (47.6%) than 9th grade (29.3%) students; higher among 11th grade (42.3%) and 12th grade (47.6%) than 10th grade (37.4%) students; higher among 12th grade (47.6%) than 11th grade (42.3%) students; higher among 10th grade female (35.7%), 11th grade female (39.4%), and 12th grade female (42.8%) than 9th grade female (27.8%) students; higher among 12th grade female (42.8%) than 10th grade female (35.7%) students; higher among 10th grade male (39.0%), 11th grade male (45.1%), and 12th grade male (52.4%) than 9th grade male (30.9%) students; higher among 11th grade male (45.1%) and 12th grade male (52.4%) than 10th grade male (39.0%) students; and higher among 12th grade male (52.4%) than 11th grade male (45.1%) students. Prevalence of lifetime marijuana use ranged from 15.5% to 45.2% across state surveys (median: 38.2%) and from 27.2% to 52.1% across local surveys (median: 39.2%) (Table 31). Current Marijuana Use Nationwide, 20.2% of students had used marijuana one or more times during the 30 days preceding the survey (i.e., current marijuana use) (Table 30). Overall, the prevalence of current marijuana use was higher among male (22.1%) than female (18.2%) students; higher among Hispanic male (28.1%) than Hispanic female (18.0%) students; and higher among 11th grade male (23.5%) and 12th grade male (26.1%) than 11th grade female (18.5%) and 12th grade female (19.5%) students, respectively. The prevalence of current marijuana use was higher among Hispanic male (28.1%) than white male (21.3%) and black male (22.1%) students. Overall, the prevalence of current marijuana use was higher among 11th grade (21.0%) and 12th grade (22.8%) than 9th grade (17.4%) students; higher among 11th grade male (23.5%) and 12th grade male (26.1%) than 9th grade male (18.6%) students; and higher among 12th grade male (26.1%) than 10th grade male (21.5%) students. Prevalence of current marijuana use ranged from 7.6% to 26.2% across state surveys (median: 18.9%) and from 12.3% to 24.0% across local surveys (median: 18.6%) (Table 31). Lifetime Cocaine Use Nationwide, 7.6% of students had used any form of cocaine (e.g., powder, crack,¶ or freebase**) one or more times during their life (i.e., lifetime cocaine use) (Table 32). Overall, the prevalence of lifetime cocaine use was higher among male (8.4%) than female (6.8%) students; higher among black male (3.4%) and Hispanic male (14.9%) than black female (1.2%) and Hispanic female (9.4%) students, respectively; and higher among 12th grade male (10.4%) than 12th grade female (7.4%) students. Overall, the prevalence of lifetime cocaine use was higher among white (7.7%) and Hispanic (12.2%) than black (2.3%) students; higher among Hispanic (12.2%) than white (7.7%) students; higher among white female (7.7%) and Hispanic female (9.4%) than black female (1.2%) students; higher among white male (7.8%) and Hispanic male (14.9%) than black male (3.4%) students; and higher among Hispanic male (14.9%) than white male (7.8%) students. Overall, the prevalence of lifetime cocaine use was higher among 11th grade (8.7%) and 12th grade (8.9%) than 9th grade (6.0%) students; higher among 11th grade male (10.1%) and 12th grade male (10.4%) than 9th grade male (6.0%) students; and higher among 12th grade male (10.4%) than 10th grade male (7.5%) students. Prevalence of lifetime cocaine use ranged from 4.1% to 15.1% across state surveys (median: 7.7%) and from 1.7% to 11.9% across local surveys (median: 5.5%) (Table 33). Current Cocaine Use Nationwide, 3.4% of students had used any form of cocaine (e.g., powder, crack, or freebase) one or more times during the 30 days preceding the survey (i.e., current cocaine use) (Table 32). Overall, the prevalence of current cocaine use was higher among male (4.0%) than female (2.8%) students and higher among black male (2.5%) and Hispanic male (7.5%) than black female (0.5%) and Hispanic female (4.7%) students, respectively. Overall, the prevalence of current cocaine use was higher among white (3.2%) and Hispanic (6.1%) than black (1.5%) students; higher among Hispanic (6.1%) than white (3.2%) students; higher among white female (2.8%) and Hispanic female (4.7%) than black female (0.5%) students; and higher among Hispanic male (7.5%) than white male (3.5%) and black male (2.5%) students. Prevalence of current cocaine use ranged from 2.0% to 7.9% across state surveys (median: 3.3%) and from 0.9% to 4.9% across local surveys (median: 3.0%) (Table 33). Lifetime Illegal Injection Drug Use Nationwide, 2.1% of students had used a needle to inject any illegal drug into their body one or more times during their life (i.e., lifetime illegal injection drug use) (Table 32). Overall, the prevalence of lifetime illegal injection drug use was higher among male (3.0%) than female (1.1%) students; higher among white male (2.5%), black male (3.1%), and Hispanic male (4.6%) than white female (1.3%), black female (0.3%), and Hispanic female (1.4%) students, respectively; and higher among 10th grade male (3.7%), 11th grade male (2.6%), and 12th grade male (2.5%) than 10th grade female (0.9%), 11th grade female (0.9%), and 12th grade female (0.9%) students, respectively. Overall, the prevalence of lifetime illegal injection drug use was higher among Hispanic (3.0%) than white (1.9%) students; higher among white female (1.3%) and Hispanic female (1.4%) than black female (0.3%) students; and higher among Hispanic male (4.6%) than white male (2.5%) students. Prevalence of lifetime illegal injection drug use ranged from 0.9% to 4.3% across state surveys (median: 2.3%) and from 1.0% to 5.9% across local surveys (median: 2.0%) (Table 33). Lifetime Inhalant Use Nationwide, 12.4% of students had sniffed glue, breathed the contents of aerosol spray cans, or inhaled any paints or sprays to get high one or more times during their life (i.e., lifetime inhalant use) (Table 34). Overall, the prevalence of lifetime inhalant use was higher among female (13.5%) than male (11.3%) students; higher among white female (14.8%) than white male (12.0%) students; and higher among 9th grade female (17.3%) and 10th grade female (14.9%) than 9th grade male (11.0%) and 10th grade male (11.6%) students, respectively. Overall, the prevalence of lifetime inhalant use was higher among white (13.4%) and Hispanic (13.0%) than black (6.8%) students; higher among white female (14.8%) and Hispanic female (13.5%) than black female (6.2%) students; and higher among white male (12.0%) and Hispanic male (12.5%) than black male (7.4%) students. Overall, the prevalence of lifetime inhalant use was higher among 9th grade (14.1%) than 11th grade (11.4%) and 12th grade (10.1%) students; higher among 10th grade (13.2%) than 12th grade (10.1%) students; and higher among 9th grade female (17.3%) and 10th grade female (14.9%) than 11th grade female (11.6%) and 12th grade female (9.3%) students. Prevalence of lifetime inhalant use ranged from 8.6% to 17.1% across state surveys (median: 12.2%) and from 5.5% to 17.9% across local surveys (median: 9.7%) (Table 35). Lifetime Illegal Steroid Use Nationwide, 4.0% of students had taken steroid pills or shots without a doctor's prescription one or more times during their life (i.e., lifetime illegal steroid use) (Table 34). Overall, the prevalence of lifetime illegal steroid use was higher among male (4.8%) than female (3.2%) students; higher among black male (3.9%) and Hispanic male (5.6%) than black female (1.0%) and Hispanic female (2.2%) students, respectively; and higher among 10th grade male (5.2%), 11th grade male (4.5%), and 12th grade male (4.2%) than 10th grade female (2.5%), 11th grade female (2.8%), and 12th grade female (2.3%) students; respectively. Overall, the prevalence of lifetime illegal steroid use was higher among white (4.2%) than black (2.4%) students; higher among white female (3.6%) than black female (1.0%) and Hispanic female (2.2%) students; and higher among Hispanic female (2.2%) than black female (1.0%) students. Overall, the prevalence of lifetime illegal steroid use was higher among 9th grade (4.8%) than 12th grade (3.3%) students and higher among 9th grade female (4.8%) than 10th grade female (2.5%), 11th grade female (2.8%), and 12th grade female (2.3%) students. Prevalence of lifetime illegal steroid use ranged from 2.0% to 6.5% across state surveys (median: 3.9%) and from 1.6% to 7.7% across local surveys (median: 3.0%) (Table 35). Lifetime Hallucinogenic Drug Use Nationwide, 8.5% of students had used hallucinogenic drugs (e.g., LSD, acid, PCP, angel dust, mescaline, or mushrooms) one or more times during their life (i.e., lifetime hallucinogenic drug use) (Table 34). Overall, the prevalence of lifetime hallucinogenic drug use was higher among male (10.2%) than female (6.8%) students; higher among white male (10.8%), black male (4.9%), and Hispanic male (12.4%) than white female (8.0%), black female (1.0%), and Hispanic female (6.3%) students, respectively; and higher among 10th grade male (10.3%), 11th grade male (12.0%), and 12th grade male (10.7%) than 10th grade female (7.4%), 11th grade female (7.0%), and 12th grade female (6.5%) students, respectively. Overall, the prevalence of lifetime hallucinogenic drug use was higher among white (9.4%) and Hispanic (9.4%) than black (2.8%) students; higher among white female (8.0%) and Hispanic female (6.3%) than black female (1.0%) students; and higher among white male (10.8%) and Hispanic male (12.4%) than black male (4.9%) students. Overall, the prevalence of lifetime hallucinogenic drug use was higher among 11th grade (9.5%) than 9th grade (7.2%) students and higher among 11th grade male (12.0%) than 9th grade male (8.3%) students. Lifetime Heroin Use Nationwide, 2.4% of students had used heroin (also called "smack," "junk," or "China White") one or more times during their life (i.e., lifetime heroin use) (Table 36). Overall, the prevalence of lifetime heroin use was higher among male (3.3%) than female (1.4%) students; higher among white male (2.7%), black male (2.5%), and Hispanic male (6.0%) than white female (1.6%), black female (0.5%), and Hispanic female (1.2%) students, respectively; and higher among 10th grade male (3.9%), 11th grade male (2.6%), and 12th grade male (3.0%) than 10th grade female (1.1%), 11th grade female (1.0%), and 12th grade female (1.1%) students, respectively. Overall, the prevalence of lifetime heroin use was higher among Hispanic (3.6%) than white (2.2%) and black (1.5%) students; higher among white female (1.6%) than black female (0.5%) students; and higher among Hispanic male (6.0%) than white male (2.7%) and black male (2.5%) students. The prevalence of lifetime heroin use was higher among 9th grade female (2.2%) than 10th grade female (1.1%) and 11th grade female (1.0%) students. Prevalence of lifetime heroin use ranged from 1.3% to 5.3% across state surveys (median: 2.7%) and from 0.8% to 7.4% across local surveys (median: 2.2%) (Table 37). Lifetime Methamphetamine Use Nationwide, 6.2% of students had used methamphetamines (also called "speed," "crystal," "crank," or "ice") one or more times during their life (i.e., lifetime methamphetamine use) (Table 36). The prevalence of lifetime methamphetamine use was higher among black male (2.7%) than black female (0.8%) students and higher among 10th grade male (7.4%) than 10th grade female (4.4%) students. Overall, the prevalence of lifetime methamphetamine use was higher among white (6.5%) and Hispanic (8.8%) than black (1.7%) students; higher among Hispanic (8.8%) than white (6.5%) students; higher among white female (6.9%) and Hispanic female (7.7%) than black female (0.8%) students; higher among white male (6.1%) and Hispanic male (9.9%) than black male (2.7%) students; and higher among Hispanic male (9.9%) than white male (6.1%) students. Prevalence of lifetime methamphetamine use ranged from 2.6% to 11.7% across state surveys (median: 5.9%) and from 1.0% to 11.0% across local surveys (median: 3.7%) (Table 37). Lifetime Ecstasy Use Nationwide, 6.3% of students had used ecstasy (also called "MDMA") one or more times during their life (i.e., lifetime ecstasy use) (Table 36). Overall, the prevalence of lifetime ecstasy use was higher among male (7.2%) than female (5.3%) students; higher among black male (5.3%) and Hispanic male (12.8%) than black female (2.5%) and Hispanic female (6.5%) students, respectively; and higher among 10th grade male (6.8%) and 11th grade male (7.5%) than 10th grade female (5.1%) and 11th grade female (5.5%) students, respectively. Overall, the prevalence of lifetime ecstasy use was higher among white (5.8%) and Hispanic (9.6%) than black (3.9%) students; higher among Hispanic (9.6%) than white (5.8%) students; higher among white female (5.3%) and Hispanic female (6.5%) than black female (2.5%) students; and higher among Hispanic male (12.8%) than white male (6.2%) and black male (5.3%) students. Prevalence of lifetime ecstasy use ranged from 3.3% to 9.2% across state surveys (median: 6.1%) and from 3.3% to 9.1% across local surveys (median: 5.6%) (Table 37). Age of Initiation of Risk BehaviorsSmoked a Whole Cigarette Before Age 13 Years Nationwide, 16.0% of students had smoked a whole cigarette for the first time before age 13 years (Table 38). Overall, the prevalence of having smoked a whole cigarette before age 13 years was higher among male (18.3%) than female (13.6%) students; higher among white male (18.0%), black male (17.2%), and Hispanic male (20.0%) than white female (14.8%), black female (10.6%), and Hispanic female (12.0%) students, respectively; and higher among 9th grade male (21.3%), 10th grade male (17.9%), 11th grade male (16.2%), and 12th grade male (16.3%) than 9th grade female (15.8%), 10th grade female (14.0%), 11th grade female (12.7%), and 12th grade female (11.4%) students, respectively. Overall, the prevalence of having smoked a whole cigarette before age 13 years was higher among white (16.4%) than black (13.8%) students and higher among white female (14.8%) than black female (10.6%) students. Overall, the prevalence of having smoked a whole cigarette before age 13 years was higher among 9th grade (18.6%) than 10th grade (16.0%), 11th grade (14.4%), and 12th grade (13.9%) students; higher among 10th grade (16.0%) than 12th grade (13.9%) students; higher among 9th grade female (15.8%) than 12th grade female (11.4%) students; and higher among 9th grade male (21.3%) than 11th grade male (16.2%) and 12th grade male (16.3%) students. Prevalence of having smoked a whole cigarette before age 13 years ranged from 7.5% to 24.2% across state surveys (median: 16.1%) and from 9.0% to 18.9% across local surveys (median: 12.6%) (Table 39). Drank Alcohol Before Age 13 Years Nationwide, 25.6% of students had drunk alcohol (other than a few sips) for the first time before age 13 years (Table 38). Overall, the prevalence of having drunk alcohol before age 13 years was higher among male (29.2%) than female (22.0%) students; higher among white male (26.9%), black male (31.9%), and Hispanic male (34.8%) than white female (20.5%), black female (24.2%), and Hispanic female (24.7%) students, respectively; and higher among 9th grade male (36.4%), 10th grade male (30.0%), 11th grade male (24.2%) and 12th grade male (23.2%) than 9th grade female (31.3%), 10th grade female (22.2%), 11th grade female (17.0%), and 12th grade female (15.4%) students, respectively. Overall, the prevalence of having drunk alcohol before age 13 years was higher among black (27.9%) and Hispanic (29.8%) than white (23.7%) students; higher among black female (24.2%) and Hispanic female (24.7%) than white female (20.5%) students; and higher among black male (31.9%) and Hispanic male (34.8%) than white male (26.9%) students. Overall, the prevalence of having drunk alcohol before age 13 years was higher among 9th grade (33.9%) than 10th grade (26.2%), 11th grade (20.5%), and 12th grade (19.3%) students; and higher among 10th grade (26.2%) than 11th grade (20.5%) and 12th grade (19.3%) students; higher among 9th grade female (31.3%) than 10th grade female (22.2%), 11th grade female (17.0%), and 12th grade female (15.4%) students; higher among 10th grade female (22.2%) than 11th grade female (17.0%) and 12th grade female (15.4%) students; higher among 9th grade male (36.4%) than 10th grade male (30.0%), 11th grade male (24.2%), and 12th grade male (23.2%) students; and higher among 10th grade male (30.0%) than 11th grade male (24.2%) and 12th grade male (23.2%) students. Prevalence of having drunk alcohol before age 13 years ranged from 13.2% to 31.1% across state surveys (median: 24.9%) and from 18.2% to 34.3% across local surveys (median: 26.4%) (Table 39). Tried Marijuana Before Age 13 Years Nationwide, 8.7% of students had tried marijuana for the first time before age 13 years (Table 38). Overall, the prevalence of having tried marijuana before age 13 years was higher among male (11.0%) than female (6.3%) students; higher among white male (9.5%), black male (12.9%), and Hispanic male (16.5%) than white female (6.0%), black female (5.5%), and Hispanic female (8.3%) students, respectively; and higher among 9th grade male (13.3%), 10th grade male (10.9%), 11th grade male (9.7%), and 12th grade male (9.0%) than 9th grade female (9.0%), 10th grade female (7.3%), 11th grade female (4.7%), and 12th grade female (3.3%) students, respectively. Overall, the prevalence of having tried marijuana before age 13 years was higher among Hispanic (12.5%) than white (7.7%) and black (9.1%) students; higher among Hispanic female (8.3%) than white female (6.0%) and black female (5.5%) students; and higher among black male (12.9%) and Hispanic male (16.5%) than white male (9.5%) students. Overall, the prevalence of having tried marijuana before age 13 years was higher among 9th grade (11.2%) than 11th grade (7.1%) and 12th grade (6.2%) students; higher among 10th grade (9.1%) than 12th grade (6.2%) students; higher among 9th grade female (9.0%) and 10th grade female (7.3%) than 11th grade female (4.7%) and 12th grade female (3.3%) students; and higher among 9th grade male (13.3%) than 11th grade male (9.7%) and 12th grade male (9.0%) students. Prevalence of having tried marijuana before age 13 years ranged from 4.2% to 20.7% across state surveys (median: 9.1%) and from 6.5% to 15.4 % across local surveys (median: 10.1%) (Table 39). Tobacco, Alcohol, and Other Drug Use on School PropertySmoked Cigarettes on School Property Nationwide, 6.8% of students had smoked cigarettes on school property on >1 of the 30 days preceding the survey (Table 40). Overall, the prevalence of having smoked cigarettes on school property was higher among white (7.4%) and Hispanic (7.2%) than black (3.4%) students; higher among white female (6.9%) and Hispanic female (6.3%) than black female (3.3%) students; and higher among white male (7.9%) and Hispanic male (8.0%) than black male (3.6%) students. The prevalence of having smoked cigarettes on school property was higher among 12th grade male (9.5%) than 9th grade male (6.3%) and 10th grade male (6.3%) students. Prevalence of having smoked cigarettes on school property ranged from 1.7% to 10.7% across state surveys (median: 6.8%) and from 2.5% to 6.4% across local surveys (median: 4.5%) (Table 41). Used Smokeless Tobacco on School Property Nationwide, 5.0% of students had used smokeless tobacco (e.g., chewing tobacco, snuff, or dip) on school property on >1 of the 30 days preceding the survey (Table 40). Overall, the prevalence of having used smokeless tobacco on school property was higher among male (9.2%) than female (0.8%) students; higher among white male (11.7%), black male (2.2%), and Hispanic male (5.4%) than white female (0.8%), black female (0.2%), and Hispanic female (1.0%) students, respectively; and higher among 9th grade male (7.6%), 10th grade male (8.9%), 11th grade male (10.8%), and 12th grade male (10.1%) than 9th grade female (1.4%), 10th grade female (0.8%), 11th grade female (0.4%), and 12th grade female (0.4%) students, respectively. Overall, the prevalence of having used smokeless tobacco on school property was higher among white (6.3%) than black (1.2%) and Hispanic (3.2%) students; higher among Hispanic (3.2%) than black (1.2%) students; higher among white female (0.8%) and Hispanic female (1.0%) than black female (0.2%) students; higher among white male (11.7%) than black male (2.2%) and Hispanic male (5.4%) students; and higher among Hispanic male (5.4%) than black male (2.2%) students. The prevalence of having used smokeless tobacco on school property was higher among 9th grade female (1.4%) than 11th grade female (0.4%) and 12th grade female (0.4%) students and higher among 11th grade male (10.8%) than 9th grade male (7.6%) students. Prevalence of having used smokeless tobacco on school property ranged from 1.4% to 9.6% across state surveys (median: 4.4%) and from 0.6% to 4.9% across local surveys (median: 1.4%) (Table 41). Drank Alcohol on School Property Nationwide, 4.3% of students had drunk at least one drink of alcohol on school property on >1 of the 30 days preceding the survey (Table 40). Overall, the prevalence of having drunk alcohol on school property was higher among male (5.3%) than female (3.3%) students; higher among white male (5.0%) and Hispanic male (9.0%) than white female (2.6%) and Hispanic female (6.4%) students, respectively; and higher among 9th grade male (4.6%), 10th grade male (5.3%), 11th grade male (5.4%), and 12th grade male (5.9%) than 9th grade female (2.8%), 10th grade female (3.7%), 11th grade female (2.7%), and 12th grade female (3.7%) students, respectively. Overall, the prevalence of having drunk alcohol on school property was higher among Hispanic (7.7%) than white (3.8%) and black (3.2%) students; higher among Hispanic female (6.4%) than white female (2.6%) and black female (3.3%) students; higher among white male (5.0%) than black male (3.2%) students; and higher among Hispanic male (9.0%) than white male (5.0%) and black male (3.2%) students. Prevalence of having drunk alcohol on school property ranged from 2.1% to 8.8% across state surveys (median: 4.5%) and from 3.4% to 11.3% across local surveys (median: 4.7%) (Table 41). Used Marijuana on School Property Nationwide, 4.5% of students had used marijuana on school property one or more times during the 30 days preceding the survey (Table 42). Overall, the prevalence of having used marijuana on school property was higher among male (6.0%) than female (3.0%) students; higher among white male (5.1%) and Hispanic male (10.4%) than white female (2.4%) and Hispanic female (5.0%) students, respectively; and higher among 10th grade male (5.9%), 11th grade male (6.1%), and 12th grade male (5.8%) than 10th grade female (3.3%), 11th grade female (2.2%), and 12th grade female (2.3%) students, respectively. Overall, the prevalence of having used marijuana on school property was higher among Hispanic (7.7%) than white (3.8%) and black (4.9%) students; higher among Hispanic female (5.0%) than white female (2.4%) students; and higher among Hispanic male (10.4%) than white male (5.1%) and black male (5.9%) students. The prevalence of having used marijuana on school property was higher among 9th grade female (3.9%) than 11th grade female (2.2%) students. Prevalence of having used marijuana on school property ranged from 1.7% to 8.4% across state surveys (median: 4.0%) and from 3.5% to 8.7% across local surveys (median: 5.0%) (Table 43). Offered, Sold, or Given an Illegal Drug on School Property Nationwide, 25.4% of students had been offered, sold, or given an illegal drug by someone on school property during the 12 months preceding the survey (Table 42). Overall, the prevalence of having been offered, sold, or given an illegal drug on school property was higher among male (28.8%) than female (21.8%) students; higher among white male (26.2%), black male (28.7%), and Hispanic male (38.5%) than white female (20.9%), black female (19.2%), and Hispanic female (28.5%) students, respectively; and higher among 9th grade male (26.9%), 10th grade male (30.6%), 11th grade male (28.4%), and 12th grade male (29.3%) than 9th grade female (21.0%), 10th grade female (24.2%), 11th grade female (21.3%), and 12th grade female (20.4%) students, respectively. Overall, the prevalence of having been offered, sold, or given an illegal drug on school property was higher among Hispanic (33.5%) than white (23.6%) and black (23.9%) students; higher among Hispanic female (28.5%) than white female (20.9%) and black female (19.2%) students; and higher among Hispanic male (38.5%) than white male (26.2%) and black male (28.7%) students. Overall, the prevalence of having been offered, sold, or given an illegal drug on school property was higher among 10th grade (27.5%) than 9th grade (24.0%) and 12th grade (24.9%) students and higher among 10th grade female (24.2%) than 12th grade female (20.4%) students. Prevalence of having been offered, sold, or given an illegal drug on school property ranged from 15.5% to 38.7% across state surveys (median: 26.1%) and from 20.3% to 40.0% across local surveys (median: 29.4%) (Table 43). Sexual Behaviors That Contribute to Unintended Pregnancy and STD, Including HIV InfectionEver Had Sexual Intercourse Nationwide, 46.8% of students had had sexual intercourse during their life (Table 44). The prevalence of having had sexual intercourse was higher among black male (74.6%) and Hispanic male (57.6%) than black female (61.2%) and Hispanic female (44.4%) students, respectively, and higher among 9th grade male (39.3%) than 9th grade female (29.3%) students. Overall, the prevalence of having had sexual intercourse was higher among black (67.6%) than white (43.0%) and Hispanic (51.0%) students; higher among Hispanic (51.0%) than white (43.0%) students; higher among black female (61.2%) than white female (43.7%) and Hispanic female (44.4%) students; higher among black male (74.6%) than white male (42.2%) and Hispanic male (57.6%) students; and higher among Hispanic male (57.6%) than white male (42.2%) students. Overall, the prevalence of having had sexual intercourse was higher among 10th grade (42.8%), 11th grade (51.4%), and 12th grade (63.1%) than 9th grade (34.3%) students; higher among 11th grade (51.4%) and 12th grade (63.1%) than 10th grade (42.8%) students; higher among 12th grade (63.1%) than 11th grade (51.4%) students; higher among 10th grade female (44.0%), 11th grade female (52.1%), and 12th grade female (62.4%) than 9th grade female (29.3%) students; higher among 11th grade female (52.1%) and 12th grade female (62.4%) than 10th grade female (44.0%) students; higher among 12th grade female (62.4%) than 11th grade female (52.1%) students; higher among 11th grade male (50.6%) and 12th grade male (63.8%) than 9th grade male (39.3%) and 10th grade male (41.5%) students; and higher among 12th grade male (63.8%) than 11th grade male (50.6%) students. Prevalence of having had sexual intercourse ranged from 35.7% to 55.1% across state surveys (median: 44.8%) and from 31.3% to 69.3% across local surveys (median: 52.2%) (Table 45). Had First Sexual Intercourse Before Age 13 Years Nationwide, 6.2% of students had had sexual intercourse for the first time before age 13 years (Table 44). Overall, the prevalence of having had sexual intercourse before age 13 years was higher among male (8.8%) than female (3.7%) students; higher among white male (5.0%), black male (26.8%), and Hispanic male (11.1%) than white female (2.9%), black female (7.1%), and Hispanic female (3.6%) students, respectively; and higher among 9th grade male (12.0%), 10th grade male (7.7%), 11th grade male (8.0%), and 12th grade male (6.2%) than 9th grade female (5.4%), 10th grade female (4.1%), 11th grade female (2.6%), and 12th grade female (2.0%) students, respectively. Overall, the prevalence of having had sexual intercourse before age 13 years was higher among black (16.5%) than white (4.0%) and Hispanic (7.3%) students; higher among Hispanic (7.3%) than white (4.0%) students; higher among black female (7.1%) than white female (2.9%) and Hispanic female (3.6%) students; higher among black male (26.8%) than white male (5.0%) and Hispanic male (11.1%) students; and higher among Hispanic male (11.1%) than white male (5.0%) students. Overall, the prevalence of having had sexual intercourse before age 13 years was higher among 9th grade (8.7%) than 10th grade (5.9%), 11th grade (5.2%), and 12th grade (4.1%) students; higher among 10th grade (5.9%) than 12th grade (4.1%) students; higher among 9th grade female (5.4%) than 11th grade female (2.6%) and 12th grade female (2.0%) students; higher among 10th grade female (4.1%) than 12th grade female (2.0%) students; and higher among 9th grade male (12.0%) than 10th grade male (7.7%), 11th grade male (8.0%), and 12th grade male (6.2%) students. Prevalence of having had sexual intercourse before age 13 years ranged from 2.8% to 10.8% across state surveys (median: 5.8%) and from 5.3% to 18.8% across local surveys (median: 10.6%) (Table 45). Had Sexual Intercourse with Four or More Persons During Their Life Nationwide, 14.3% of students had had sexual intercourse with >4 persons during their life (Table 44). Overall, the prevalence of having had sexual intercourse with >4 persons was higher among male (16.5%) than female (12.0%) students; higher among black male (38.7%) and Hispanic male (21.7%) than black female (18.6%) and Hispanic female (10.4%) students, respectively; and higher among 9th grade male (13.2%), 10th grade male (13.2%), and 11th grade male (18.1%) than 9th grade female (5.7%), 10th grade female (9.7%), and 11th grade female (14.2%) students, respectively. Overall, the prevalence of having had sexual intercourse with >4 persons was higher among black (28.2%) than white (11.4%) and Hispanic (15.9%) students; higher among Hispanic (15.9%) than white (11.4%) students; higher among black female (18.6%) than white female (11.1%) and Hispanic female (10.4%) students; higher among black male (38.7%) than white male (11.6%) and Hispanic male (21.7%) students; and higher among Hispanic male (21.7%) than white male (11.6%) students. Overall, the prevalence of having had sexual intercourse with >4 persons was higher among 11th grade (16.2%) and 12th grade (21.4%) than 9th grade (9.4%) and 10th grade (11.5%) students; higher among 12th grade (21.4%) than 11th grade (16.2%) students; higher among 10th grade female (9.7%), 11th grade female (14.2%), and 12th grade female (20.2%) than 9th grade female (5.7%) students; higher among 11th grade female (14.2%) and 12th grade female (20.2%) than 10th grade female (9.7%) students; higher among 12th grade female (20.2%) than 11th grade female (14.2%) students; higher among 11th grade male (18.1%) and 12th grade male (22.6%) than 9th grade male (13.2%) and 10th grade male (13.2%) students; and higher among 12th grade male (22.6%) than 11th grade male (18.1%) students. Prevalence of having had sexual intercourse with >4 persons ranged from 9.0% to 19.1% across state surveys (median: 13.6%) and from 8.7% to 29.3% across local surveys (median: 17.7%) (Table 45). Currently Sexually Active Nationwide, 33.9% of students had had sexual intercourse with >1 person during the 3 months preceding the survey (i.e., currently sexually active) (Table 46). The prevalence of being currently sexually active was higher among black male (51.3%) than black female (43.8%) students and higher among 9th grade male (24.5%) and 10th grade female (31.1%) than 9th grade female (19.5%) and 10th grade male (27.2%) students, respectively. Overall, the prevalence of being currently sexually active was higher among black (47.4%) than white (32.0%) and Hispanic (35.0%) students; higher among black female (43.8%) than white female (33.5%) and Hispanic female (33.7%) students; higher among black male (51.3%) than white male (30.6%) and Hispanic male (36.3%) students; and higher among Hispanic male (36.3%) than white male (30.6%) students. The prevalence of being currently sexually active was higher among 10th grade (29.2%), 11th grade (39.4%), and 12th grade (49.4%) than 9th grade (21.9%) students; higher among 11th grade (39.4%) and 12th grade (49.4%) than 10th grade (29.2%) students; and higher among 12th grade (49.4%) than 11th grade (39.4%) students; higher among 10th grade female (31.1%), 11th grade female (40.8%), and 12th grade female (51.7%) than 9th grade female (19.5%) students; higher among 11th grade female (40.8%) and 12th grade female (51.7%) than 10th grade female (31.1%) students; higher among 12th grade female (51.7%) than 11th grade female (40.8%) students; higher among 11th grade male (37.9%) and 12th grade male (47.0%) than 9th grade male (24.5%) and 10th grade male (27.2%) students; and higher among 12th grade male (47.0%) than 11th grade male (37.9%) students. Prevalence of being currently sexually active ranged from 24.1% to 40.6% across state surveys (median: 33.3%) and from 22.0% to 51.1% across local surveys (median: 37.0%) (Table 47). Condom Use Among the 33.9% of currently sexually active students nationwide, 62.8% reported that either they or their partner had used a condom during last sexual intercourse (Table 46). Overall, the prevalence of having used a condom during last sexual intercourse was higher among male (70.0%) than female (55.9%) students; higher among white male (70.1%), black male (75.5%), and Hispanic male (65.3%) than white female (55.6%), black female (62.1%), and Hispanic female (49.8%) students, respectively; and higher among 10th grade male (74.4%) and 12th grade male (65.8%) than 10th grade female (57.1%) and 12th grade female (46.1%) students, respectively. Overall, the prevalence of having used a condom during last sexual intercourse was higher among black (68.9%) than white (62.6%) and Hispanic (57.7%) students; higher among white (62.6%) than Hispanic (57.7%) students; higher among white female (55.6%) and black female (62.1%) than Hispanic female (49.8%) students; and higher among black male (75.5%) than Hispanic male (65.3%) students. Overall, the prevalence of having used a condom during last sexual intercourse was higher among 9th grade (74.5%) than 10th grade (65.3%), 11th grade (61.7%), and 12th grade (55.4%) students; higher among 10th grade (65.3%) and 11th grade (61.7%) than 12th grade (55.4%) students; higher among 9th grade female (71.5%) than 10th grade female (57.1%), 11th grade female (57.8%), and 12th grade female (46.1%) students; higher among 10th grade female (57.1%) and 11th grade female (57.8%) than 12th grade female (46.1%) students; and higher among 9th grade male (77.1%) and 10th grade male (74.4%) than 11th grade male (66.0%) and 12th grade male (65.8%) students. Prevalence of having used a condom during last sexual intercourse ranged from 47.6% to 71.2% across state surveys (median: 62.6%) and from 59.1% to 79.2% across local surveys (median: 69.4%) (Table 47). Birth Control Pill Use Among the 33.9% of currently sexually active students nationwide, 17.6% reported that either they or their partner had used birth control pills to prevent pregnancy before last sexual intercourse (Table 46). Overall, the prevalence of having used birth control pills before last sexual intercourse was higher among female (20.6%) than male (14.6%) students; higher among white female (27.1%) than white male (17.2%) students; and higher among 10th grade female (18.0%) and 12th grade female (28.9%) than 10th grade male (10.3%) and 12th grade male (21.9%) students, respectively. Overall, the prevalence of having used birth control pills before last sexual intercourse was higher among white (22.3%) than black (10.0%) and Hispanic (9.8%) students; higher among white female (27.1%) than black female (10.7%) and Hispanic female (9.4%) students; and higher among white male (17.2%) than black male (9.4%) and Hispanic male (10.3%) students. Overall, the prevalence of having used birth control pills before last sexual intercourse was higher among 10th grade (14.3%), 11th grade (18.5%), and 12th grade (25.6%) than 9th grade (7.5%) students; higher among 12th grade (25.6%) than 10th grade (14.3%) and 11th grade (18.5%) students; higher among 10th grade female (18.0%), 11th grade female (20.2%), and 12th grade female (28.9%) than 9th grade female (8.8%) students; higher among 12th grade female (28.9%) than 10th grade female (18.0%) and 11th grade female (20.2%) students; and higher among 11th grade male (16.6%) and 12th grade male (21.9%) than 9th grade male (6.4%) and 10th grade male (10.3%) students. Prevalence of having used birth control pills before last sexual intercourse ranged from 12.7% to 34.6% across state surveys (median: 18.4%) and from 3.8% to 17.3% across local surveys (median: 8.6%) (Table 47). Alcohol or Drug Use Before Last Sexual Intercourse Among the 33.9% of currently sexually active students nationwide, 23.3% had drunk alcohol or used drugs before last sexual intercourse (Table 48). Overall, the prevalence of having drunk alcohol or used drugs before last sexual intercourse was higher among male (27.6%) than female (19.0%) students; higher among white male (29.9%) and Hispanic male (32.2%) than white female (20.5%) and Hispanic female (18.7%) students, respectively; and higher among 11th grade male (29.0%) and 12th grade male (27.6%) than 11th grade female (16.8%) and 12th grade female (19.2%) students, respectively. Overall, the prevalence of having drunk alcohol or used drugs before last sexual intercourse was higher among white (25.0%) and Hispanic (25.6%) than black (14.1%) students; higher among white female (20.5%) and Hispanic female (18.7%) than black female (12.8%) students; and higher among white male (29.9%) and Hispanic male (32.2%) than black male (15.4%) students. Prevalence of having drunk alcohol or used drugs before last sexual intercourse ranged from 18.6% to 30.9% across state surveys (median: 22.9%) and from 13.4% to 26.8% across local surveys (median: 16.6%) (Table 49). Taught in School About AIDS or HIV Infection Nationwide, 87.9% of students had ever been taught in school about acquired immunodeficiency syndrome (AIDS) or HIV infection (Table 48). Overall, the prevalence of having been taught in school about AIDS or HIV infection was higher among white (89.4%) than black (86.3%) and Hispanic (84.7%) students; higher among white female (90.1%) than Hispanic female (85.8%) students; and higher among white male (88.7%) than Hispanic male (83.6%) students. Overall, the prevalence of having been taught in school about AIDS or HIV infection was higher among 10th grade (88.4%), 11th grade (89.6%), and 12th grade (89.4%) than 9th grade (85.0%) students; higher among 10th grade female (89.4%) and 12th grade female (90.1%) than 9th grade female (85.5%) students; and higher among 11th grade male (89.5%) and 12th grade male (88.7%) than 9th grade male (84.4%) students. Prevalence of having been taught in school about AIDS or HIV infection ranged from 79.8% to 92.7 % across state surveys (median: 88.4%) and from 78.6% to 90.5% across local surveys (median: 85.9%) (Table 49). Tested for HIV Nationwide, 11.9% of students had been tested for HIV (Table 48). Overall, the prevalence of HIV testing was higher among female (13.2%) than male (10.6%) students; higher among white female (11.6%) and black female (24.1%) than white male (8.8%) and black male (17.9%) students, respectively; and higher among 10th grade female (13.2%), 11th grade female (14.1%), and 12th grade female (19.3%) than 10th grade male (10.2%), 11th grade male (10.2%), and 12th grade male (12.3%) students, respectively. Overall, the prevalence of HIV testing was higher among black (21.0%) than white (10.2%) and Hispanic (12.0%) students; higher among black female (24.1%) than white female (11.6%) and Hispanic female (11.2%) students; higher among black male (17.9%) than white male (8.8%) and Hispanic male (12.7%) students; and higher among Hispanic male (12.7%) than white male (8.8%) students. Overall, the prevalence of HIV testing was higher among 10th grade (11.6%), 11th grade (12.2%), and 12th grade (15.8%) than 9th grade (8.9%) students; higher among 12th grade (15.8%) than 10th grade (11.6%) and 11th grade (12.2%) students; higher among 10th grade female (13.2%), 11th grade female (14.1%), and 12th grade female (19.3%) than 9th grade female (7.9%) students; and higher among 12th grade female (19.3%) than 10th grade female (13.2%) and 11th grade female (14.1%) students. Dietary BehaviorsAte Fruits and Vegetables >5 Times/Day Nationwide, 20.1% of students had eaten fruits and vegetables†† >5 times/day during the 7 days preceding the survey (Table 50). Overall, the prevalence of having eaten fruits and vegetables >5 times/day was higher among male (21.4%) than female (18.7%) students; higher among black male (24.3%) than black female (19.9%) students; and higher among 10th grade male (23.7%) than 10th grade female (19.0%) students. Overall, the prevalence of having eaten fruits and vegetables >5 times/day was higher among black (22.1%) and Hispanic (23.2%) than white (18.6%) students; higher among Hispanic female (21.8%) than white female (17.4%) students; and higher among black male (24.3%) and Hispanic male (24.5%) than white male (19.7%) students. Overall, the prevalence of having eaten fruits and vegetables >5 times/day was higher among 9th grade (21.3%) than 11th grade (18.8%) and 12th grade (18.3%) students; higher among 9th grade male (22.3%) and 10th grade male (23.7%) than 12th grade male (18.8%) students; and higher among 10th grade male (23.7%) than 11th grade male (19.6%) students. Prevalence of having eaten fruits and vegetables >5 times/day ranged from 13.5% to 25.4% across state surveys (median: 17.4%) and from 16.4% to 28.4% across local surveys (median: 19.9%) (Table 51). Drank >3 Glasses of Milk/Day Nationwide, 16.2% of students had drunk >3 glasses/day of milk during the 7 days preceding the survey (Table 50). Overall, the prevalence of having drunk >3 glasses/day of milk was higher among male (20.8%) than female (11.6%) students; higher among white male (24.0%), black male (11.7%), and Hispanic male (18.2%) than white female (13.4%), black female (5.7%), and Hispanic female (9.6%) students, respectively; and higher among 9th grade male (23.7%), 10th grade male (19.9%), 11th grade male (21.2%), and 12th grade male (17.5%) than 9th grade female (13.6%), 10th grade female (11.0%), 11th grade female (12.0%), and 12th grade female (9.5%) students, respectively. Overall, the prevalence of having drunk >3 glasses/day of milk was higher among white (18.7%) than black (8.6%) and Hispanic (13.9%) students; higher among Hispanic (13.9%) than black (8.6%) students; higher among white female (13.4%) than black female (5.7%) and Hispanic female (9.6%) students; higher among Hispanic female (9.6%) than black female (5.7%) students; higher among white male (24.0%) than black male (11.7%) and Hispanic male (18.2%) students; and higher among Hispanic male (18.2%) than black male (11.7%) students. Overall, the prevalence of having drunk >3 glasses/day of milk was higher among 9th grade (18.7%) than 10th grade (15.5%) and 12th grade (13.5%) students; higher among 11th grade (16.5%) than 12th grade (13.5%) students; higher among 9th grade female (13.6%) than 12th grade female (9.5%) students; higher among 9th grade male (23.7%) than 10th grade male (19.9%) and 12th grade male (17.5%) students; and higher among 11th grade male (21.2%) than 12th grade male (17.5%) students. Prevalence of having drunk >3 glasses/day of milk ranged from 8.7% to 28.6% across state surveys (median: 16.2%) and from 6.2% to 16.0% across local surveys (median: 9.7%) (Table 51). Physical ActivityMet Currently Recommended Levels of Physical Activity Nationwide, 35.8% of students had been physically active doing any kind of physical activity that increased their heart rate and made them breathe hard some of the time for a total of at least 60 minutes/day on >5 of the 7 days preceding the survey (i.e., met currently recommended levels of physical activity) (Table 52). Overall, the prevalence of having met currently recommended levels of physical activity was higher among male (43.8%) than female (27.8%) students; higher among white male (46.9%), black male (38.2%), and Hispanic male (39.0%) than white female (30.2%), black female (21.3%), and Hispanic female (26.5%) students, respectively; and higher among 9th grade male (42.8%), 10th grade male (46.8%), 11th grade male (43.8%), and 12th grade male (41.9%) than 9th grade female (30.8%), 10th grade female (30.0%), 11th grade female (25.1%), and 12th grade female (24.0%) students, respectively. Overall, the prevalence of having met currently recommended levels of physical activity was higher among white (38.7%) than black (29.5%) and Hispanic (32.9%) students; higher among white female (30.2%) and Hispanic female (26.5%) than black female (21.3%) students; and higher among white male (46.9%) than black male (38.2%) and Hispanic male (39.0%) students. Overall, the prevalence of having met currently recommended levels of physical activity was higher among 9th grade (36.9%) than 12th grade (32.9%) students; higher among 10th grade (38.5%) than 11th grade (34.4%) and 12th grade (32.9%) students; higher among 9th grade female (30.8%) and 10th grade female (30.0%) than 11th grade female (25.1%) and 12th grade female (24.0%) students; and higher among 10th grade male (46.8%) than 12th grade male (41.9%) students. Prevalence of having met currently recommended levels of physical activity ranged from 29.6% to 45.9% across state surveys (median: 33.9%) and from 18.2% to 38.5% across local surveys (median: 27.1%) (Table 53). Met Previously Recommended Levels of Physical Activity Nationwide, 68.7% of students had participated in at least 20 minutes of vigorous physical activity (i.e., physical activity that made them sweat and breathe hard) on >3 of the 7 days preceding the survey and/or at least 30 minutes of moderate physical activity (i.e., physical activity that did not make them sweat and breathe hard) on >5 of the 7 days preceding the survey (i.e., met previously recommended levels of physical activity) (Table 52). Overall, the prevalence of having met previously recommended levels of physical activity was higher among male (75.8%) than female (61.5%) students; higher among white male (77.0%), black male (71.7%), and Hispanic male (76.0%) than white female (63.3%), black female (53.1%), and Hispanic female (62.6%) students, respectively; and higher among 9th grade male (78.4%), 10th grade male (77.8%), 11th grade male (74.2%), and 12th grade male (71.9%) than 9th grade female (68.4%), 10th grade female (63.0%), 11th grade female (60.7%), and 12th grade female (51.7%) students, respectively. Overall, the prevalence of having met previously recommended levels of physical activity was higher among white (70.2%) and Hispanic (69.4%) than black (62.0%) students; higher among white female (63.3%) and Hispanic female (62.6%) than black female (53.1%) students; and higher among white male (77.0%) than black male (71.7%) students. Overall, the prevalence of having met previously recommended levels of physical activity was higher among 9th grade (73.5%) than 11th grade (67.4%) and 12th grade (61.8%) students; higher among 10th grade (70.5%) and 11th grade (67.4%) than 12th grade (61.8%) students; higher among 9th grade female (68.4%) than 10th grade female (63.0%), 11th grade female (60.7%), and 12th grade female (51.7%) students; higher among 10th grade female (63.0%) and 11th grade female (60.7%) than 12th grade female (51.7%) students; higher among 9th grade male (78.4%) than 11th grade male (74.2%) and 12th grade male (71.9%) students; and higher among 10th grade male (77.8%) than 12th grade male (71.9%) students. Prevalence of having met previously recommended levels of physical activity ranged from 58.7% to 76.7% across state surveys (median: 67.7%) and from 45.4% to 68.9% across local surveys (median: 59.3%) (Table 53). No Vigorous or Moderate Physical Activity Nationwide, 9.6% of students had not participated in any vigorous or moderate physical activity during the 7 days preceding the survey (Table 52). Overall, the prevalence of having not participated in any vigorous or moderate physical activity was higher among female (11.3%) than male (7.9%) students; higher among white female (9.3%), black female (18.2%), and Hispanic female (12.3%) than white male (6.9%), black male (10.2%), and Hispanic male (8.9%) students, respectively; and higher among 10th grade female (10.3%), 11th grade female (12.4%), and 12th grade female (15.2%) than 10th grade male (7.5%), 11th grade male (8.4%), and 12th grade male (8.4%) students, respectively. Overall, the prevalence of having not participated in any vigorous or moderate physical activity was higher among black (14.4%) than white (8.1%) and Hispanic (10.6%) students; higher among Hispanic (10.6%) than white (8.1%) students; higher among black female (18.2%) than white female (9.3%) and Hispanic female (12.3%) students; and higher among black male (10.2%) than white male (6.9%) students. Overall, the prevalence of having not participated in any vigorous or moderate physical activity was higher among 11th grade (10.4%) and 12th grade (11.8%) than 9th grade (7.7%) students; higher among 12th grade (11.8%) than 10th grade (8.9%) students; higher among 11th grade female (12.4%) and 12th grade female (15.2%) than 9th grade female (8.2%) students; and higher among 12th grade female (15.2%) than 10th grade female (10.3%) students. Prevalence of having not participated in any vigorous or moderate physical activity ranged from 4.2% to 15.6% across state surveys (median: 9.1%) and from 8.5% to 23.5% across local surveys (median: 13.7%) (Table 53). Used Computers >3 Hours/Day Nationwide, 21.1% of students played video or computer games or used a computer for something that was not school work >3 hours/day on an average school day (i.e., computer use) (Table 54). Overall, the prevalence of computer use was higher among male (27.4%) than female (14.8%) students; higher among white male (25.4%), black male (34.9%), and Hispanic male (24.4%) than white female (13.7%), black female (16.1%), and Hispanic female (14.9%) students, respectively; and higher among 9th grade male (30.4%), 10th grade male (27.9%), 11th grade male (24.6%), and 12th grade male (25.3%) than 9th grade female (16.9%), 10th grade female (16.9%), 11th grade female (12.2%), and 12th grade female (12.0%) students, respectively. Overall, the prevalence of computer use was higher among black (25.2%) than white (19.6%) and Hispanic (19.8%) students and higher among black male (34.9%) than white male (25.4%) and Hispanic male (24.4%) students. Overall, the prevalence of computer use was higher among 9th grade (23.7%) and 10th grade (22.5%) than 11th grade (18.4%) and 12th grade (18.7%) students; higher among 9th grade female (16.9%) and 10th grade female (16.9%) than 11th grade female (12.2%) and 12th grade female (12.0%) students; and higher among 9th grade male (30.4%) than 11th grade male (24.6%) and 12th grade male (25.3%) students. Watched Television >3 Hours/Day Nationwide, 37.2% of students watched television >3 hours/day on an average school day (Table 54). The prevalence of having watched television >3 hours/day was higher among 10th grade male (42.7%) than 10th grade female (37.4%) students. Overall, the prevalence of having watched television >3 hours/day was higher among black (64.1%) than white (29.2%) and Hispanic (45.8%) students; higher among Hispanic (45.8%) than white (29.2%) students; higher among black female (64.5%) than white female (28.1%) and Hispanic female (45.8%) students; higher among Hispanic female (45.8%) than white female (28.1%) students; higher among black male (63.5%) than white male (30.2%) and Hispanic male (45.8%) students; and higher among Hispanic male (45.8%) than white male (30.2%) students. Overall, the prevalence of having watched television >3 hours/day was higher among 9th grade (42.4%) and 10th grade (40.1%) than 11th grade (32.9%) and 12th grade (31.4%) students; higher among 9th grade female (42.4%) than 10th grade female (37.4%), 11th grade female (31.7%), and 12th grade female (32.4%) students; higher among 10th grade female (37.4%) than 11th grade female (31.7%) and 12th grade female (32.4%) students; and higher among 9th grade male (42.4%) and 10th grade male (42.7%) than 11th grade male (34.1%) and 12th grade male (30.3%) students. Prevalence of having watched television >3 hours/day ranged from 19.0% to 44.6% across state surveys (median: 34.7%) and from 39.2% to 70.5% across local surveys (median: 48.3%) (Table 55). Attended Physical Education Classes Nationwide, 54.2% of students went to physical education (PE) classes on one or more days in an average week when they were in school (i.e., attended PE classes) (Table 56). Overall, the prevalence of attending PE classes was higher among male (60.0%) than female (48.3%) students; higher among white male (58.1%), black male (61.7%), and Hispanic male (65.9%) than white female (46.1%), black female (50.5%), and Hispanic female (57.1%) students, respectively; and higher among 10th grade male (65.4%), 11th grade male (51.1%), and 12th grade male (45.9%) than 10th grade female (53.0%), 11th grade female (32.9%), and 12th grade female (32.0%) students, respectively. Overall, the prevalence of attending PE classes was higher among Hispanic (61.5%) than white (52.1%) students; higher among Hispanic female (57.1%) than white female (46.1%) students; and higher among Hispanic male (65.9%) than white male (58.1%) students. Overall, the prevalence of attending PE classes was higher among 9th grade (71.5%) than 10th grade (59.2%), 11th grade (41.8%), and 12th grade (38.8%) students; higher among 10th grade (59.2%) than 11th grade (41.8%) and 12th grade (38.8%) students; higher among 9th grade female (70.3%) than 10th grade female (53.0%), 11th grade female (32.9%), and 12th grade female (32.0%) students; higher among 10th grade female (53.0%) than 11th grade female (32.9%) and 12th grade female (32.0%) students; higher among 9th grade male (72.8%) than 10th grade male (65.4%), 11th grade male (51.1%), and 12th grade male (45.9%) students; and higher among 10th grade male (65.4%) than 11th grade male (51.1%) and 12th grade male (45.9%) students. Prevalence of attending PE classes ranged from 25.2% to 94.2% across state surveys (median: 48.9%) and from 27.9% to 85.8% across local surveys (median: 45.9%) (Table 57). Attended PE Classes Daily Nationwide, 33.0% of students went to PE classes 5 days in an average week when they were in school (i.e., attended PE classes daily) (Table 56). Overall, the prevalence of having attended PE classes daily was higher among male (37.1%) than female (29.0%) students; higher among white male (36.7%) and black male (37.5%) than white female (26.6%) and black female (31.6%) students, respectively; and higher among 10th grade male (39.0%), 11th grade male (33.5%), and 12th grade male (26.1%) than 10th grade female (31.5%), 11th grade female (19.4%), and 12th grade female (18.8%) students, respectively. Overall, the prevalence of having attended PE classes daily was higher among 9th grade (44.8%) than 10th grade (35.3%), 11th grade (26.3%), and 12th grade (22.4%) students; higher among 10th grade (35.3%) than 11th grade (26.3%) and 12th grade (22.4%) students; and higher among 11th grade (26.3%) than 12th grade (22.4%) students; higher among 9th grade female (43.1%) than 10th grade female (31.5%), 11th grade female (19.4%), and 12th grade female (18.8%) students; higher among 10th grade female (31.5%) than 11th grade female (19.4%) and 12th grade female (18.8%) students; higher among 9th grade male (46.5%) than 11th grade male (33.5%) and 12th grade male (26.1%) students; and higher among 10th grade male (39.0%) and 11th grade male (33.5%) than 12th grade male (26.1%) students. Prevalence of having attended PE classes daily ranged from 6.7% to 60.7% across state surveys (median: 27.2%) and from 4.0% to 50.6% across local surveys (median: 27.7%) (Table 57). Exercised or Played Sports >20 Minutes During an Average PE Class Among the 54.2% of students nationwide who attended PE classes, 84.0% actually exercised or played sports >20 minutes during an average PE class (Table 56). Overall, the prevalence of having exercised or played sports >20 minutes during an average PE class was higher among male (87.2%) than female (80.3%) students; higher among white male (89.3%), black male (83.8%) students; and Hispanic male (85.0%) than white female (82.5%), black female (73.1%), and Hispanic female (77.5%) students, respectively; higher among 9th grade male (86.3%), 10th grade male (88.0%), and 11th grade male (87.5%) than 9th grade female (80.3%), 10th grade female (81.0%), and 11th grade female (79.5%) students, respectively. Overall, the prevalence of having exercised or played sports >20 minutes during an average PE class was higher among white (86.3%) than black (78.7%) and Hispanic (81.6%) students; higher among white female (82.5%) than black female (73.1%) students; and higher among white male (89.3%) than Hispanic male (85.0%) students. Prevalence of having exercised or played sports >20 minutes during an average PE class ranged from 76.2% to 92.3% across state surveys (median: 85.1%) and from 56.4% to 84.7% across local surveys (median: 75.6%) (Table 57). Played on >1 Sports Teams Nationwide, 56.0% of students had played on >1 sports teams (run by their school or community groups) during the 12 months preceding the survey (Table 58). Overall, the prevalence of having played on one or more sports teams was higher among male (61.8%) than female (50.2%) students; higher among white male (61.5%), black male (64.6%), and Hispanic male (62.0%) than white female (53.9%), black female (43.6%), and Hispanic female (43.8%) students, respectively; and higher among 9th grade male (64.7%), 10th grade male (63.4%), 11th grade male (61.0%), and 12th grade male (57.3%) than 9th grade female (56.1%), 10th grade female (52.3%), 11th grade female (48.9%), and 12th grade female (41.3%) students, respectively. Overall, the prevalence of having played on one or more sports teams was higher among white (57.8%) than black (53.7%) and Hispanic (53.0%) students and higher among white female (53.9%) than black female (43.6%) and Hispanic female (43.8%) students. Overall, the prevalence of having played on one or more sports teams was higher among 9th grade (60.4%) than 11th grade (54.9%) and 12th grade (49.2%) students; higher among 10th grade (58.0%) and 11th grade (54.9%) than 12th grade (49.2%) students; higher among 9th grade female (56.1%) than 11th grade female (48.9%) and 12th grade female (41.3%) students; higher among 10th grade female (52.3%) and 11th grade female (48.9%) than 12th grade female (41.3%) students; and higher among 9th grade male (64.7%) and 10th grade male (63.4%) than 12th grade male (57.3%) students. Prevalence of having played on one or more sports teams ranged from 47.1% to 66.9% across state surveys (median: 57.5%) and from 42.5% to 56.3% across local surveys (median: 46.2%) (Table 59). Injured While Exercising or Playing Sports Among the 78.8% of students nationwide who exercised or played sports during the 30 days preceding the survey, 22.2% had had to see a doctor or nurse for an injury that happened while exercising or playing sports (Table 58). Overall, the prevalence of having been injured while exercising or playing sports was higher among male (24.4%) than female (19.7%) students; higher among black male (30.4%) and Hispanic male (24.5%) than black female (17.6%) and Hispanic female (19.9%) students, respectively; and higher among 12th grade male (24.4%) than 12th grade female (14.7%) students. The prevalence of having been injured while exercising or playing sports was higher among black male (30.4%) than white male (22.7%) and Hispanic male (24.5%) students. The prevalence of having been injured while exercising or playing sports was higher among 9th grade female (20.9%), 10th grade female (22.2%), and 11th grade female (19.4%) than 12th grade female (14.7%) students. Overweight and Weight ControlAt Risk for Becoming Overweight Nationwide, 15.7% of students were at risk for becoming overweight (Table 60). The prevalence of being at risk for becoming overweight was higher among black female (22.6%) than black male (16.7%) students. Overall, the prevalence of being at risk for becoming overweight was higher among black (19.8%) than white (14.5%) and Hispanic (16.7%) students and higher among black female (22.6%) than white female (13.8%) and Hispanic female (16.8%) students. Overall, the prevalence of being at risk for becoming overweight was higher among 9th grade (17.1%) than 12th grade (14.8%) students and higher among 9th grade male (18.3%) than 10th grade male (14.5%) and 12th grade male (14.1%) students. Prevalence of being at risk for becoming overweight ranged from 10.3% to 17.8% across state surveys (median: 14.6%) and from 13.3% to 20.7 % across local surveys (median: 17.3%) (Table 61). Overweight Nationwide, 13.1% of students were overweight (Table 60). Overall, the prevalence of being overweight was higher among male (16.0%) than female (10.0%) students; higher among white male (15.2%) and Hispanic male (21.3%) than white female (8.2%) and Hispanic female (12.1%) students, respectively; and higher among 9th grade male (15.0%), 10th grade male (16.5%), 11th grade male (17.2%), and 12th grade male (15.5%) than 9th grade female (10.4%), 10th grade female (10.6%), 11th grade female (9.4%), and 12th grade female (9.7%) students, respectively. Overall, the prevalence of being overweight was higher among black (16.0%) and Hispanic (16.8%) than white (11.8%) students; higher among black female (16.1%) than white female (8.2%) and Hispanic female (12.1%) students; higher among Hispanic female (12.1%) than white female (8.2%) students; and higher among Hispanic male (21.3%) than white male (15.2%) and black male (15.9%) students. Prevalence of being overweight ranged from 5.6% to 15.6% across state surveys (median: 12.0%) and from 10.4% to 21.5% across local surveys (median: 12.7%) (Table 61). Described Themselves as Overweight Nationwide, 31.5% of students described themselves as slightly or very overweight (Table 62). Overall, the prevalence of describing themselves as overweight was higher among female (38.1%) than male (25.1%) students; higher among white female (37.7%), black female (36.3%), and Hispanic female (42.4%) than white male (24.7%), black male (17.6%), and Hispanic male (32.0%) students, respectively; and higher among 9th grade female (36.2%), 10th grade female (36.2%), 11th grade female (39.1%), and 12th grade female (41.8%) than 9th grade male (24.3%), 10th grade male (24.5%), 11th grade male (26.0%), and 12th grade male (25.6%) students, respectively. Overall, the prevalence of describing themselves as overweight was higher among white (31.1%) than black (27.2%) students; higher among Hispanic (37.1%) than white (31.1%) and black (27.2%) students; higher among Hispanic female (42.4%) than white female (37.7%) and black female (36.3%) students; higher among white male (24.7%) than black male (17.6%) students; and higher among Hispanic male (32.0%) than white male (24.7%) and black male (17.6%) students. Overall, the prevalence of describing themselves as overweight was higher among 12th grade (33.7%) than 9th grade (30.2%) and 10th grade (30.2%) students and higher among 12th grade female (41.8%) than 9th grade female (36.2%) and 10th grade female (36.2%) students. Prevalence of describing themselves as overweight ranged from 24.0% to 34.0% across state surveys (median: 30.9%) and from 20.8% to 36.0% across local surveys (median: 28.0%) (Table 63). Were Trying to Lose Weight Nationwide, 45.6% of students were trying to lose weight (Table 62). Overall, the prevalence of trying to lose weight was higher among female (61.7%) than male (29.9%) students; higher among white female (63.5%), black female (52.7%), and Hispanic female (64.1%) than white male (28.8%), black male (24.4%), and Hispanic male (38.6%) students, respectively; and higher among 9th grade female (60.1%), 10th grade female (61.5%), 11th grade female (61.7%), and 12th grade female (64.0%) than 9th grade male (31.9%), 10th grade male (28.2%), 11th grade male (30.5%), and 12th grade male (28.7%) students, respectively. Overall, the prevalence of trying to lose weight was higher among white (45.9%) than black (38.9%) students; higher among Hispanic (51.2%) than white (45.9%) and black (38.9%) students; higher among white female (63.5%) and Hispanic female (64.1%) than black female (52.7%) students; and higher among Hispanic male (38.6%) than white male (28.8%) and black male (24.4%) students. The prevalence of trying to lose weight was higher among 9th grade male (31.9%) than 10th grade male (28.2%) students. Prevalence of trying to lose weight ranged from 41.0% to 50.9% across state surveys (median: 46.3%) and from 32.9% to 54.4% across local surveys (median: 43.1%) (Table 63). Ate Less Food, Fewer Calories, or Foods Low in Fat to Lose Weight or to Keep From Gaining Weight During the 30 days preceding the survey, 40.7% of students nationwide had eaten less food, fewer calories, or foods low in fat to lose weight or to keep from gaining weight (Table 64). Overall, the prevalence of having eaten less food, fewer calories, or foods low in fat to lose weight or to keep from gaining weight was higher among female (54.8%) than male (26.8%) students; higher among white female (58.8%), black female (39.6%), and Hispanic female (53.2%) than white male (26.4%), black male (22.0%), and Hispanic male (31.5%) students, respectively; and higher among 9th grade female (50.8%), 10th grade female (55.3%), 11th grade female (55.6%), and 12th grade female (58.4%) than 9th grade male (27.1%), 10th grade male (25.7%), 11th grade male (26.8%), and 12th grade male (27.6%) students, respectively. Overall, the prevalence of having eaten less food, fewer calories, or foods low in fat to lose weight or to keep from gaining weight was higher among white (42.4%) and Hispanic (42.2%) than black (31.1%) students; higher among white female (58.8%) than black female (39.6%) and Hispanic female (53.2%) students; higher among Hispanic female (53.2%) than black female (39.6%) students; and higher among Hispanic male (31.5%) than white male (26.4%) and black male (22.0%) students. Overall, the prevalence of having eaten less food, fewer calories, or foods low in fat to lose weight or to keep from gaining weight was higher among 12th grade (43.0%) than 9th grade (38.8%) students and higher among 10th grade female (55.3%), 11th grade female (55.6%), and 12th grade female (58.4%) than 9th grade female (50.8%) students. Prevalence of having eaten less food, fewer calories, or foods low in fat to lose weight or to keep from gaining weight ranged from 35.5% to 45.0% across state surveys (median: 39.8%) and from 29.5% to 42.9% across local surveys (median: 35.9%) (Table 65). Exercised to Lose Weight or to Keep From Gaining Weight Nationwide, 60.0% of students had exercised to lose weight or to keep from gaining weight during the 30 days preceding the survey (Table 64). Overall, the prevalence of having exercised to lose weight or to keep from gaining weight was higher among female (67.4%) than male (52.9%) students; higher among white female (69.8%), black female (56.5%), and Hispanic female (68.9%) than white male (51.2%), black male (51.6%), and Hispanic male (63.0%) students, respectively; and higher among 9th grade female (68.3%), 10th grade female (69.0%), 11th grade female (66.3%), and 12th grade female (65.5%) than 9th grade male (57.7%), 10th grade male (52.1%), 11th grade male (49.4%), and 12th grade male (51.2%) students, respectively. Overall, the prevalence of having exercised to lose weight or to keep from gaining weight was higher among white (60.4%) and Hispanic (65.9%) than black (54.1%) students; higher among Hispanic (65.9%) than white (60.4%) students; higher among white female (69.8%) and Hispanic female (68.9%) than black female (56.5%) students; and higher among Hispanic male (63.0%) than white male (51.2%) and black male (51.6%) students. Overall, the prevalence of having exercised to lose weight or to keep from gaining weight was higher among 9th grade (62.9%) than 11th grade (58.0%) and 12th grade (58.3%) students and higher among 9th grade male (57.7%) than 10th grade male (52.1%), 11th grade male (49.4%), and 12th grade male (51.2%) students. Prevalence of having exercised to lose weight or to keep from gaining weight ranged from 54.9% to 65.6% across state surveys (median: 60.9%) and from 46.7% to 66.6% across local surveys (median: 58.7%) (Table 65). Went Without Eating for >24 Hours to Lose Weight or To Keep From Gaining Weight Nationwide, 12.3% of students had gone without eating for >24 hours to lose weight or to keep from gaining weight during the 30 days preceding the survey (Table 66). Overall, the prevalence of having gone without eating for >24 hours to lose weight or to keep from gaining weight was higher among female (17.0%) than male (7.6%) students; higher among white female (17.6%), black female (14.0%), and Hispanic female (17.7%) than white male (7.5%), black male (8.6%), and Hispanic male (7.4%) students, respectively; and higher among 9th grade female (18.4%), 10th grade female (16.2%), 11th grade female (17.2%), and 12th grade female (16.0%) than 9th grade male (8.1%), 10th grade male (7.4%), 11th grade male (6.8%), and 12th grade male (7.8%) students, respectively. The prevalence of having gone without eating for >24 hours to lose weight or to keep from gaining weight was higher among Hispanic female (17.7%) than black female (14.0%) students. Prevalence of having gone without eating for >24 hours to lose weight or to keep from gaining weight ranged from 8.9% to 16.1% across state surveys (median: 12.0%) and from 8.2% to 18.5% across local surveys (median: 11.5%) (Table 67). Took Diet Pills, Powders, or Liquids to Lose Weight or to Keep From Gaining Weight During the 30 days preceding the survey, 6.3% of students nationwide had taken diet pills, powders, or liquids without a doctor's advice to lose weight or to keep from gaining weight (Table 66). Overall, the prevalence of having taken diet pills, powders, or liquids without a doctor's advice to lose weight or to keep from gaining weight was higher among female (8.1%) than male (4.6%) students; higher among white female (9.2%) and Hispanic female (7.5%) than white male (4.2%) and Hispanic male (5.7%) students, respectively; and higher among 10th grade female (7.7%), 11th grade female (9.2%), and 12th grade female (10.2%) than 10th grade male (4.4%), 11th grade male (4.8%), and 12th grade male (4.4%) students, respectively. Overall, the prevalence of having taken diet pills, powders, or liquids without a doctor's advice to lose weight or to keep from gaining weight was higher among white (6.6%) than black (5.0%) students and higher among white female (9.2%) and Hispanic female (7.5%) than black female (4.9%) students. Overall, the prevalence of having taken diet pills, powders, or liquids without a doctor's advice to lose weight or to keep from gaining weight was higher among 11th grade (7.0%) and 12th grade (7.3%) than 9th grade (5.2%) students and higher among 11th grade female (9.2%) and 12th grade female (10.2%) than 9th grade female (6.0%) students. Prevalence of having taken diet pills, powders, or liquids without a doctor's advice to lose weight or to keep from gaining weight ranged from 3.9% to 11.8% across state surveys (median: 6.4%) and from 3.0% to 9.1% across local surveys (median: 5.0%) (Table 67). Vomited or Took Laxatives to Lose Weight or To Keep From Gaining Weight Nationwide, 4.5% of students had vomited or taken laxatives to lose weight or to keep from gaining weight during the 30 days preceding the survey (Table 66). Overall, the prevalence of having vomited or taken laxatives to lose weight or to keep from gaining weight was higher among female (6.2%) than male (2.8%) students; higher among white female (6.7%) and Hispanic female (6.8%) than white male (2.3%) and Hispanic male (3.9%) students, respectively; and higher among 9th grade female (5.5%), 10th grade female (7.2%), 11th grade female (6.1%), and 12th grade female (5.9%) than 9th grade male (2.7%), 10th grade male (3.0%), 11th grade male (2.5%), and 12th grade male (2.6%) students, respectively. Overall, the prevalence of having vomited or taken laxatives to lose weight or to keep from gaining weight was higher among Hispanic (5.4%) than black (3.4%) students; higher among white female (6.7%) and Hispanic female (6.8%) than black female (4.0%) students; and higher among Hispanic male (3.9%) than white male (2.3%) students. Prevalence of having vomited or taken laxatives to lose weight or to keep from gaining weight ranged from 3.2% to 8.9% across state surveys (median: 5.5%) and from 3.7% to 9.9% across local surveys (median: 4.8%) (Table 67). Other Health-Related TopicsLifetime Asthma Nationwide, 17.1% of students had ever been told by a doctor or nurse that they had asthma (i.e., lifetime asthma) (Table 68). The prevalence of lifetime asthma was higher among 11th grade male (18.2%) than 11th grade female (14.6%) students. Overall, the prevalence of lifetime asthma was higher among black (18.8%) than white (16.4%) students and higher among black male (20.1%) than white male (16.1%) students. The prevalence of lifetime asthma was higher among 9th grade female (18.7%) than 11th grade female (14.6%) and higher among 10th grade male (17.7%) and 11th grade male (18.2%) than 12th grade male (14.1%) students. Prevalence of lifetime asthma ranged from 16.2% to 30.4% across state surveys (median: 19.9%) and from 12.7% to 27.9% across local surveys (median: 21.6%) (Table 69). Current Asthma Nationwide, 14.5% of students had lifetime asthma and, during the 12 months preceding the survey, reported either having asthma but no episode or attack or having an asthma episode or attack (i.e., current asthma) (Table 68). The prevalence of current asthma was higher among 11th grade male (15.6%) than 11th grade female (12.7%) students. The prevalence of current asthma was higher among 9th grade female (16.0%) and 10th grade female (15.6%) than 11th grade female (12.7%) students and higher among 11th grade male (15.6%) than 12th grade male (11.6%) students. Prevalence of current asthma ranged from 12.3% to 23.3% across state surveys (median: 16.2%) and from 10.0% to 19.4% across local surveys (median: 16.4%) (Table 69). Asthma Episode or Attack Among the 14.5% of students nationwide with current asthma, 37.9% had had an asthma episode or attack during the 12 months preceding the survey (i.e., asthma episode or attack) (Table 68). Overall, the prevalence of having had an asthma episode or attack was higher among female (45.7%) than male (30.4%) students; higher among white female (48.9%) and black female (42.2%) than white male (31.6%) and black male (23.8%) students, respectively; and higher among 9th grade female (44.7%), 10th grade female (48.8%), 11th grade female (45.6%), and 12th grade female (43.4%) than 9th grade male (32.3%), 10th grade male (32.2%), 11th grade male (30.7%), and 12th grade male (23.2%) students, respectively. Overall, the prevalence of having had an asthma episode or attack was higher among white (40.5%) than black (33.0%) students. Prevalence of having had an asthma episode or attack ranged from 24.2% to 46.2% across state surveys (median: 37.0%) and from 27.1% to 40.4% across local surveys (median: 32.4%) (Table 69). Described Health as Fair or Poor Nationwide, 8.3% of students had described their health, in general, as fair or poor (Table 70). Overall, the prevalence of having described their health as fair or poor was higher among female (9.6%) than male (7.1%) students; higher among white female (8.3%), black female (11.5%), and Hispanic female (12.9%) than white male (6.8%), black male (6.0%), and Hispanic male (7.8%) students, respectively; and higher among 11th grade female (10.4%) and 12th grade female (9.6%) than 11th grade male (6.3%) and 12th grade male (6.4%) students, respectively. Overall, the prevalence of having described their health as fair or poor was higher among Hispanic (10.3%) than white (7.5%) students and higher among black female (11.5%) and Hispanic female (12.9%) than white female (8.3%) students. Prevalence of having described their health in general as fair or poor ranged from 5.9% to 11.0% across state surveys (median: 7.9%) and from 5.3% to 11.8% across local surveys (median: 8.7%) (Table 71). Had Physical Disabilities or Long-term Health Problems Nationwide, 10.3% of students had had any physical disabilities or long-term health problems (Table 70). Overall, the prevalence of physical disabilities or long-term health problems was higher among female (12.4%) than male (8.3%) students; higher among white female (13.5%) and black female (12.3%) than white male (8.1%) and black male (7.7%) students, respectively; and higher among 9th grade female (12.4%), 10th grade female (13.0%), and 11th grade female (12.3%) than 9th grade male (8.0%), 10th grade male (8.0%), and 11th grade male (8.0%) students, respectively. Overall, the prevalence of physical disabilities or long-term health problems was higher among white (10.8%) than Hispanic (8.6%) students and higher among white female (13.5%) than Hispanic female (8.7%) students. Routine Sunscreen Use Nationwide, 9.0% of students most of the time or always wore sunscreen with an SPF of 15 or higher when outside for >1 hour on a sunny day (i.e., routine sunscreen use) (Table 72). Overall, the prevalence of routine sunscreen use was higher among female (11.7%) than male (6.3%) students; higher among white female (13.0%), black female (4.2%), and Hispanic female (10.4%) than white male (7.4%), black male (2.5%), and Hispanic male (4.9%) students, respectively; and higher among 9th grade female (12.7%), 10th grade female (12.7%), and 11th grade female (11.3%) than 9th grade male (6.5%), 10th grade male (5.5%), and 11th grade male (5.2%) students, respectively. Overall, the prevalence of routine sunscreen use was higher among white (10.2%) than black (3.4%) and Hispanic (7.6%) students and higher among Hispanic (7.6%) than black (3.4%) students; higher among white female (13.0%) and Hispanic female (10.4%) than black female (4.2%) students; and higher among white male (7.4%) than black male (2.5%) and Hispanic male (4.9%) students; and higher among Hispanic male (4.9%) than black male (2.5%) students. The prevalence of routine sunscreen use was higher among 12th grade male (8.3%) than 10th grade male (5.5%) and 11th grade male (5.2%) students. Routine Practice of Sun Safety Behaviors Nationwide, 18.2% of students most of the time or always stayed in the shade, wore long pants, wore a long-sleeved shirt, or wore a hat that shaded their face, ears, and neck when outside for >1 hour on a sunny day (i.e., routine practice of sun-safety behaviors) (Table 72). Overall, the prevalence of routine practice of sun safety behaviors was higher among male (20.5%) than female (15.9%) students; higher among white male (20.4%) than white female (11.7%) students; higher among black female (23.0%) than black male (17.5%) students; and higher among 10th grade male (23.9%), 11th grade male (20.3%), and 12th grade male (19.8%) than 10th grade female (16.5%), 11th grade female (13.9%), and 12th grade female (15.7%) students, respectively. Overall, the prevalence of routine practice of sun safety behaviors was higher among black (20.3%) and Hispanic (22.4%) than white (16.1%) students; higher among black female (23.0%) and Hispanic female (22.9%) than white female (11.7%) students; and higher among Hispanic male (21.9%) than black male (17.5%) students. Overall, the prevalence of routine practice of sun safety behaviors was higher among 10th grade (20.3%) than 9th grade (17.8%), 11th grade (17.1%), and 12th grade (17.8%) students and higher among 10th grade male (23.9%) than 9th grade male (18.2%) and 12th grade male (19.8%) students. Trends During 1991--2005During 1991--2005, a significant linear decrease occurred in the percentage of students who never or rarely wore a seat belt (25.9%--10.2%). During 2003--2005, a significant decrease also occurred in the percentage of students who never or rarely wore a seat belt (18.2%--10.2%). During 1991--2005, a significant linear decrease occurred in the percentage of students who never or rarely wore a motorcycle helmet (42.9%--36.5%) and in the percentage of students who rode with a driver who had been drinking alcohol (39.9%--28.5%). The percentage of students who drove when they had been drinking alcohol did not change significantly during 1991--1997 (16.7%--16.9%) and then decreased during 1997--2005 (16.9%--9.9%). During 2003--2005, a significant decrease also occurred in the percentage of students who drove when they had been drinking alcohol (12.1%--9.9%). The percentage of students who carried a weapon decreased during 1991--1999 (26.1%--17.3%) and then did not change significantly during 1999--2005 (17.3%--18.5%). The percentage of students who were in a physical fight decreased during 1991--2003 (42.5%--33.0%) and then increased during 2003--2005 (33.0%--35.9%). The percentage of students who seriously considered attempting suicide decreased during 1991--2003 (29.0%--16.9%) and then did not change significantly during 2003--2005 (16.9%--16.9%). During 1991--2005, a significant linear decrease occurred in the percentage of students who made a suicide plan (18.6%--13.0%). During 1991--2005, the percentage of students who attempted suicide did not change significantly (7.3%--8.4%). The percentage of students who reported lifetime cigarette use did not change significantly during 1991--1999 (70.1%--70.4%) and then decreased during 1999--2005 (70.4%--54.3%). The percentage of students who reported current cigarette use increased during 1991--1997 (27.5%--36.4%) and then decreased during 1997--2005 (36.4%--23.0%) and the percentage of students who reported current frequent cigarette use increased during 1991--1999 (12.7%--16.8%) and then decreased during 1999--2005 (16.8%--9.4%). During 1995--2005, a significant linear decrease occurred in the percentage of students who reported current smokeless tobacco use (11.4%--8.0%), during 1997--2005, a significant linear decrease occurred in the percentage of students who reported current cigar use (22.0%--14.0%), and during 1997--2005, a significant linear decrease occurred in the percentage of students who reported current tobacco use (43.4%--28.4%). During 2003--2005, no significant changes occurred in any of these tobacco use variables. The percentage of students who reported lifetime alcohol use did not change significantly during 1991--1999 (81.6%--81.0%) and then decreased during 1999--2005 (81.0%--74.3%), the percentage of students who reported current alcohol use did not change significantly during 1991--1999 (50.8%--50.0%) and then decreased during 1999--2005 (50.0%--43.3%), and the percentage of students who reported episodic heavy drinking did not change significantly during 1991--1997 (31.3%--33.4%) and then decreased during 1997--2005 (33.4%--25.5%). The percentage of students who reported lifetime marijuana use increased during 1991--1999 (31.3%--47.2%) and then decreased during 1999--2005 (47.2%--38.4%) and the percentage of students who reported current marijuana use increased during 1991--1999 (14.7%--26.7%) and then decreased during 1999--2005 (26.7%--20.2%). The percentage of students who reported lifetime cocaine use increased during 1991--1999 (5.9%--9.5%) and then decreased during 1999--2005 (9.5%--7.6%) and the percentage of students who reported current cocaine use increased during 1991--2001 (1.7%--4.2%) and then did not change significantly during 2001--2005 (4.2%--3.4%). The percentage of students who reported lifetime inhalant use decreased during 1995--2003 (20.3%--12.1%) and then did not change significantly during 2003--2005 (12.1%--12.4%). The percentage of students who reported lifetime steroid use increased during 1991--2003 (2.7%--6.1%) and then decreased during 2003--2005 (6.1%--4.0%). During 1999--2005, a significant linear decrease occurred in the percentage of students who reported lifetime methamphetamine use (9.1%--6.2%) and during 2001--2005, a significant linear decrease occurred in the percentage of students who reported lifetime ecstasy use (11.1%--6.3%) and lifetime hallucinogenic drug use (13.3%--8.5%). In addition, lifetime methamphetamine use and lifetime ecstasy use decreased during 2003--2005 (7.6%--6.2% and 11.1%--6.3%, respectively). During 1991--2005, significant linear decreases occurred in the percentage of students who ever had sexual intercourse (54.1%--46.8%), who had sexual intercourse with >4 people during their lifetime (18.7%--14.3%), and who were currently sexually active (37.5%--33.9%). During 1991--2005, a significant linear increase occurred in the percentage of sexually active students who used a condom at last sexual intercourse (46.2%--62.8%). The percentage of students who were taught in school about AIDS or HIV infection increased during 1991--1997 (83.3%--91.5%) and then decreased during 1997--2005 (91.5%--87.9%). During 2003--2005, no significant changes occurred in any of these sexual behavior variables. During 1999--2005, significant linear increases occurred in the percentage of students who were at risk for becoming overweight (14.4%--15.7%) and who were overweight (10.7%--13.1%). During 1991--2005, a significant linear increase occurred in the percentage of students who were trying to lose weight (41.8%--45.6%) and during 1999--2005, a significant linear decrease occurred in the percentage of students who ate fruits and vegetables >5 times/day (23.9%--20.1%). During 2003--2005, no significant changes occurred in any of these variables. During 1999--2005, a significant linear decrease occurred in the percentage of students who watched >3 hours/day of television (42.8%--37.2%). During 1991--2005, the percentage of students who attended PE classes did not change significantly (48.9%--54.2%). The percentage of students who attended PE classes daily decreased during 1991--1995 (41.6%--25.4%) and then did not change significantly during 1995--2005 (25.4%--33.0%). Among students attending PE classes, the percentage who exercised or played sports >20 minutes during an average PE class decreased during 1991--1995 (80.7%--70.3%) and then increased during 1995--2005 (70.3%--84.0%). During 2003--2005, no significant changes occurred in any of these physical activity variables. DiscussionCertain risk behaviors are more likely to occur among subpopulations of students defined by sex, race/ethnicity, and grade. However, this analysis could not isolate the effects of sex, race/ethnicity, or grade from the effects of socioeconomic status (SES) or culture on risk behaviors with substantial disparities. In a 1992 national study, after controlling for age, sex, race/ethnicity, and school enrollment status (in or out of school), adolescents aged 12--17 years were less likely to report selected risk behaviors (e.g., smoking, physical inactivity, eating too little fruit and vegetables, and episodic heavy drinking) as the SES (education or family income) of the responsible adult in their family increased (16). Additional research is needed to assess the effect of specific educational, socioeconomic, cultural, and racial/ethnic factors on the prevalence of health-risk behaviors among high school students. For the majority of risk behaviors, prevalence does not vary substantially across states or across cities. However, across state surveys, a range of >25 percentage points or a fivefold variation or greater was identified for the following risk behaviors:
Across local surveys, a range of >25 percentage points or a fivefold variation or greater was identified for the following risk behaviors:
These variations might occur, in part, because of differences in state and local laws and policies, enforcement practices, access to illegal drugs, availability of effective school and community interventions, prevailing behavioral and social norms, demographic characteristics of the population, and adult practices. Longitudinal research is needed to better understand the effect of these factors on the development and prevalence of risk behaviors. Healthy People 2010 The national YRBS is the primary source of data to measure 15 Healthy People 2010 objectives and three leading health indicators (10). The Healthy People 2010 objectives provide a comprehensive agenda for improving the health of all persons in the United States during the first decade of the 21st century. This report provides the 2010 target and data from the 2005 national YRBS for all 15 objectives (Table 73). Limitations The findings in this report are subject to at least three limitations. First, these data apply only to youth who attend school and, therefore, are not representative of all persons in this age group. Nationwide, in 2001, of persons aged 16--17 years, approximately 5% were not enrolled in a high school program and had not completed high school (17). Second, the extent of underreporting or overreporting of behaviors cannot be determined, although the survey questions demonstrate good test-retest reliability (8). Third, BMI is calculated on the basis of self-reported height and weight, and, therefore, tends to underestimate the prevalence of overweight and at risk for becoming overweight (12). ConclusionUses of YRBS DataThe national YRBS data are used routinely by CDC and other federal agencies. For example, CDC uses YRBS data to
State and local agencies and nongovernmental organizations use YRBS data to set school health and health promotion program goals, support modification of school health curricula or other programs, support new legislation and policies that promote health, and seek funding for new initiatives. For example, Milwaukee Public Schools (MPS) used YRBS data to support adoption of evidence-based curricula in MPS schools, community schools, after-school programs, and alternative settings for school-aged youth. In Montana, YRBS data are used by the Montana Office of Public Instruction and its partners, including the Montana Department of Public Health and Human Services, the Montana Board of Crime Control, Indian Health Service, Healthy Mothers/Healthy Babies, Montana Department of Transportation, and Blue Cross and Blue Shield of Montana, for program planning and improvement. In Vermont, YRBS data were used to examine the success of statewide tobacco control programs and promote tobacco prevention programs for youth. In Wisconsin, classroom activities designed to teach social norms were developed based on YRBS data. Also, the majority of states and local agencies post their YRBS data on their websites to ensure use of their data by community agencies. Eighty percent of all states have YRBS data representative of their high school students attending public schools. Continued support for and expansion of the YRBSS will help monitor and ensure effectiveness of public health and school health programs for youth. References
* Black students refers to black or African-American, non-Hispanic students. † Hispanic students refers to Hispanic or Latino students of any race. § A questionnaire that fails quality control has <20 remaining responses after editing or has the same answer to >15 questions in a row. ¶ Pellet-sized pieces of highly purified cocaine. ** A process in which cocaine is dissolved in ether or sodium hydroxide and the precipitate is filtered off. †† Refers to 100% fruit juice, green salad, potatoes (excluding French fries, fried potatoes, or potato chips), carrots, or other vegetables.
State and Local Youth Risk Behavior Survey Coordinators States: Alabama, Marchina Toodle, MS, Department of Education; Arizona, Denise Muller, MPH, Department of Education; Arkansas, Kathleen Courtney, MS, Department of Education; Colorado, Jim Adams-Berger, PhD, Omni Research and Training; Connecticut, Diane Aye, PhD, Department of Public Health; Delaware, Janet Arns Ray, MS, Department of Education; Florida, Melissa R. Murray, MS, Department of Health; Georgia, Dafna Kanny, PhD, Department of Human Resources; Hawaii, Dave Randall, MEd; Department of Education; Idaho, Barbara Eisenbarth, MS, Department of Education; Indiana, Tanya S. Parrish, MPH, Department of Health; Iowa, Sara Peterson, MA, Department of Education; Kansas, Melissa Brooks, MEd, Department of Education Kentucky, Barbara Donica, MA, Department of Education; Maine, Joni Foster, Department of Education; Maryland, Alicia Mezu, Department of Education; Massachusetts, Carol Goodenow, PhD, Department of Education; Michigan, Kim Kovalchick, MPH, Department of Education; Missouri, Kevin Miller, MA, Department of Elementary and Secondary Education; Montana, Susan Court; Office of Public Instruction; Nebraska, Jeff Armitage, Health and Human Services System; Nevada, Robinette J. Bacon, Department of Education; New Hampshire, Mary Bubnis, MEd, Department of Education; New Jersey, Sarah Kleinman, MPH, Department of Education; New Mexico, Kristine Meurer, PhD, Public Education Department; New York, Patricia Kocialski, MSE, Department of Education; North Carolina, Sarah Langer, MPH, Department of Public Instruction; North Dakota, Andrea Pena, MS Department of Public Instruction; Ohio, Angela Norton, MPA, Department of Health; Oklahoma, Tracy N. McKeown, MPH, Department of Health; Rhode Island, Donald K. Perry, MPA, Department of Health; South Carolina, Elaine C. Maney, MPH, Department of Education; South Dakota, April Hodges, Department of Education; Tennessee, Jerry Swaim, MS, Department of Education; Texas, Phil Huang, MD, Department of State Health Services; Utah, Verne C. Larsen, Office of Education; Vermont, Kelly Hale LaMonda, MA, Department of Health; West Virginia, J. Dean Lee, Department of Education; Wisconsin, Brian Weaver, MPH, Department of Public Instruction; and Wyoming, Gerald M. Maas, PhD, Department of Education. Cities: Baltimore, Maryland, Patricia J. Brownlee, MHS, Baltimore City Public School System; Boston, Massachusetts, Barbara A. Huscher, MEd, Boston Public Schools; Broward County, Florida, Mike Weissberg, MS, School Board of Broward County; Charlotte-Mecklenburg, North Carolina, Nancy Langenfeld, MS, Charlotte-Mecklenburg Board of Education; Chicago, Illinois, Inez R. Drummond, EdD, Chicago Public Schools; Dallas, Texas, Becky Beck, Dallas Independent School District; DeKalb County, Georgia, Shannon L. Williams, MA, DeKalb County School System; Detroit, Michigan, Arlene Richardson, EdD, Detroit Public Schools; District of Columbia, Marc D. Clark, PhD, District of Columbia Public Schools; Hillsborough County, Florida, Lloyd Zimet, PhD, Hillsborough County Public Schools; Los Angeles, California, Ric Loya, MS, Los Angeles Unified School District; Memphis, Tennessee, Deborah L. Slawson, PhD, Memphis City Schools; Miami-Dade County, Florida, Rodolfo Abella, PhD, Miami-Dade County Public Schools; Milwaukee, Wisconsin, David Braby, Milwaukee Public Schools; New Orleans, Stephanie Turlich, New Orleans Public Schools; New York City, New York, Donna Eisenhower, PhD, New York City Department of Health and Mental Hygiene; Orange County, Florida, Kathy Bowman, MS, Orange Country Public Schools; Palm Beach County, Florida, Dannette Fitzgerald, MEd, School District of Palm Beach County; San Bernardino, California, Charlene D. Long, MS, San Bernardino City Unified School District; San Diego, California, Marge Kleinsmith-Hildebrand, MS, San Diego City Schools District; and San Francisco, California, Phong Pham, MA, San Francisco Unified School District. Table 1 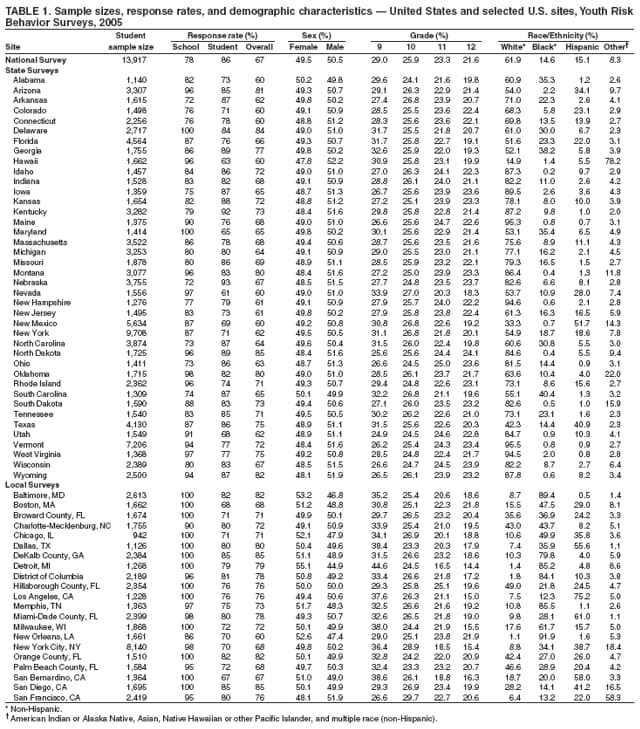 Return to top. Figure 1 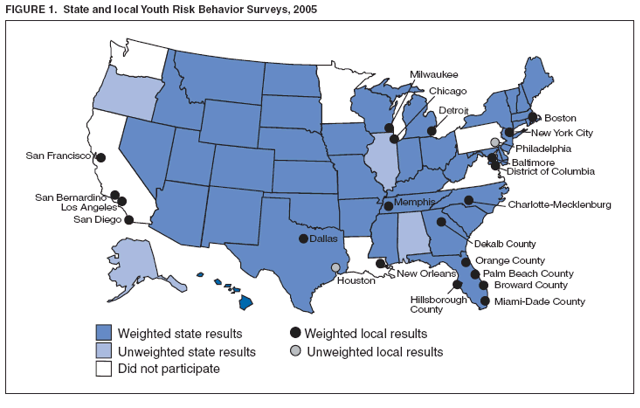 Return to top. Table 2 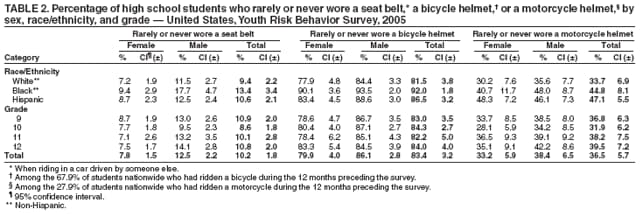 Return to top. Table 3 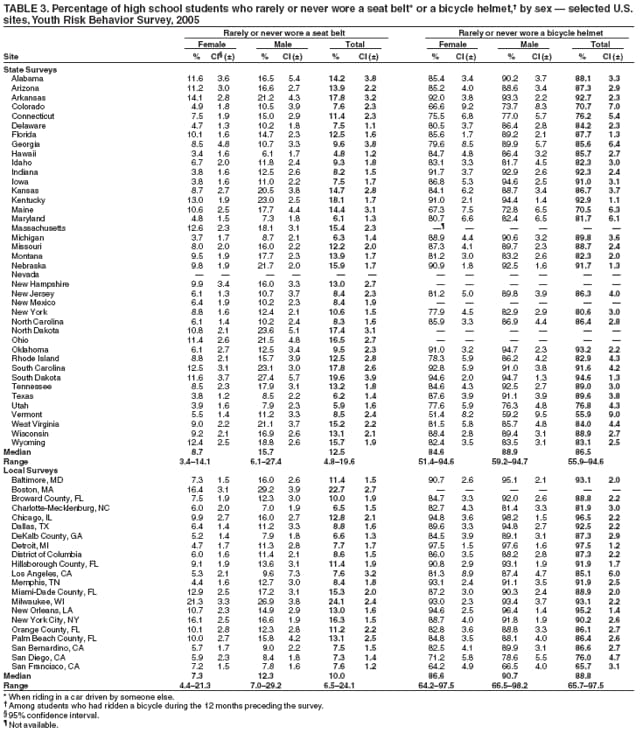 Return to top. Table 4 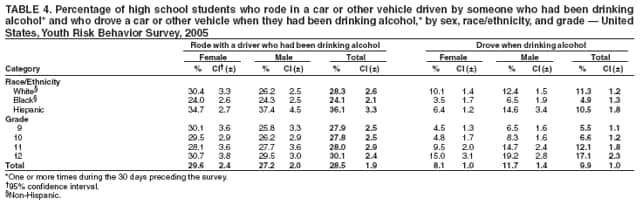 Return to top. Table 5 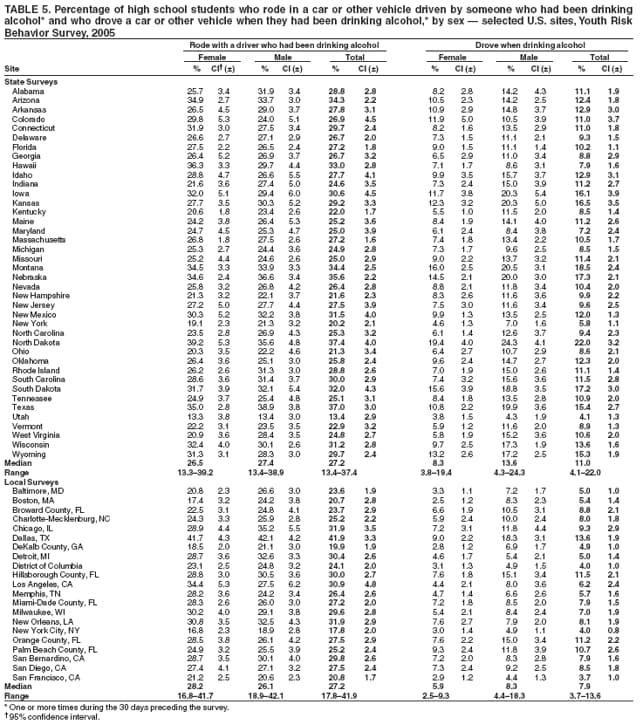 Return to top. Table 6 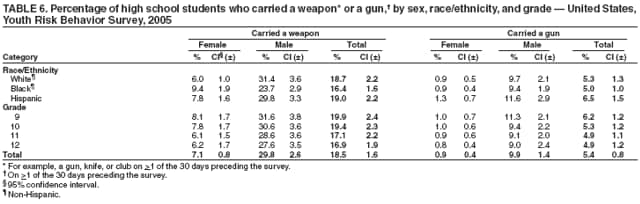 Return to top. Table 7 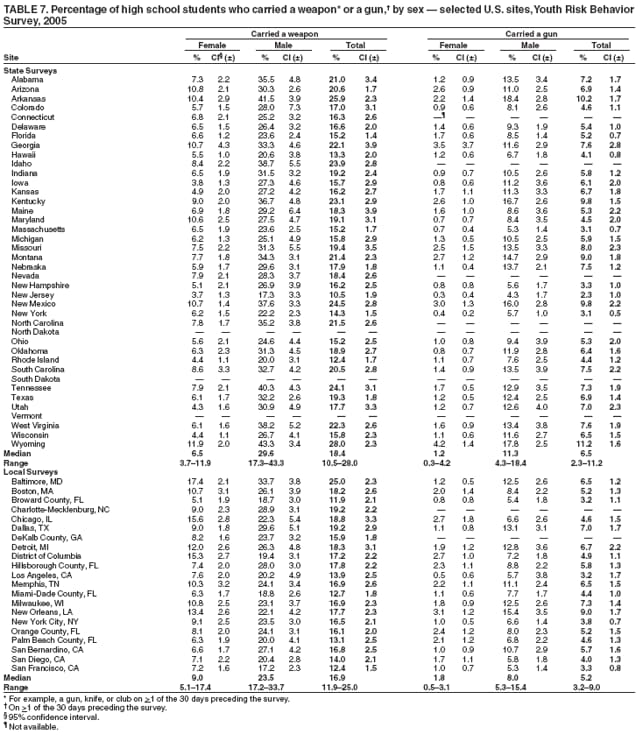 Return to top. Table 8 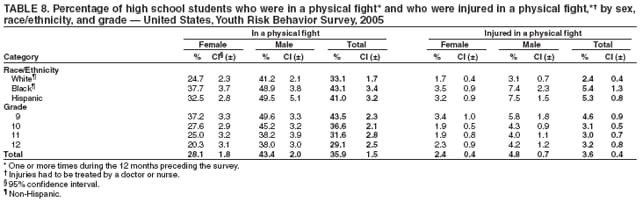 Return to top. Table 9 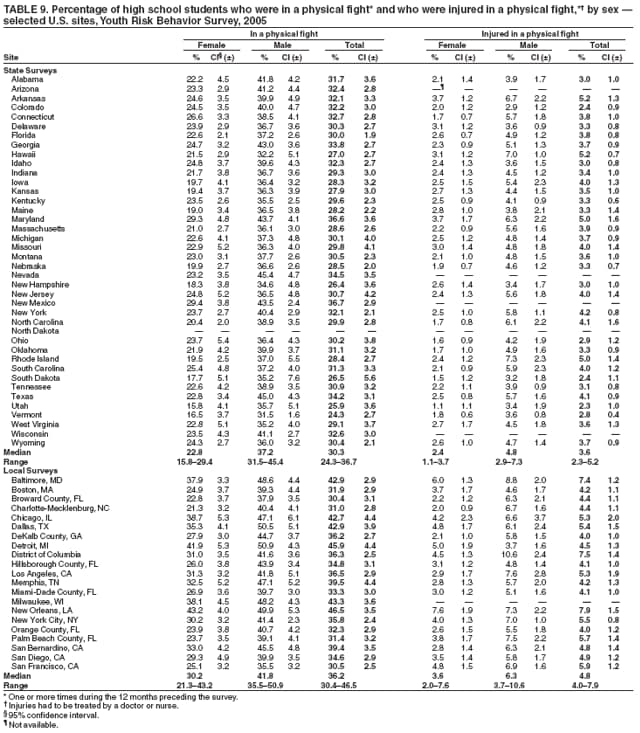 Return to top. Table 10 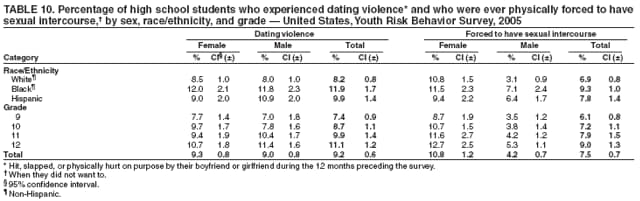 Return to top. Table 11 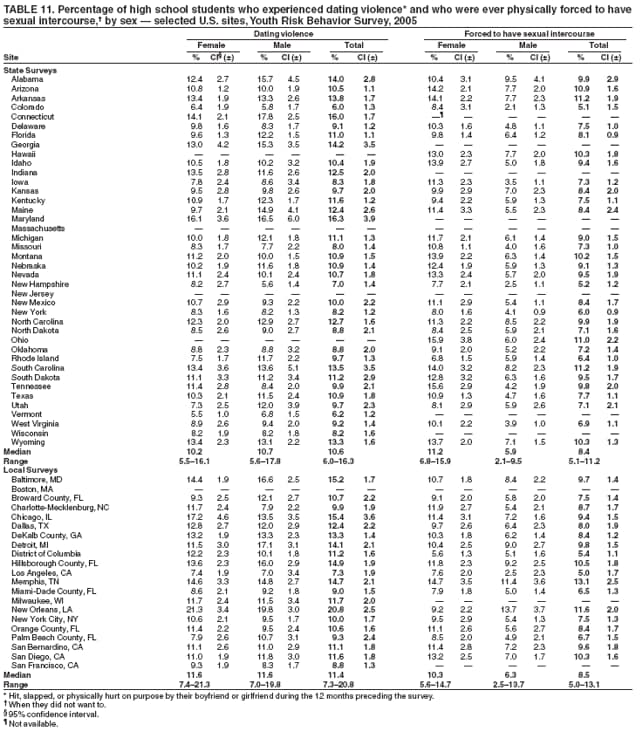 Return to top. Table 12 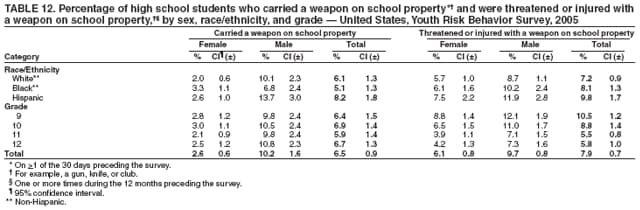 Return to top. Table 13 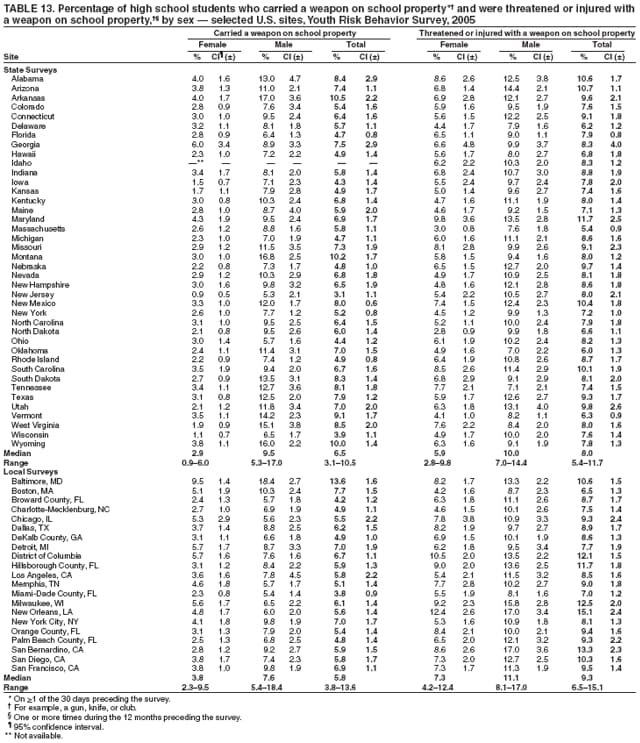 Return to top. Table 14 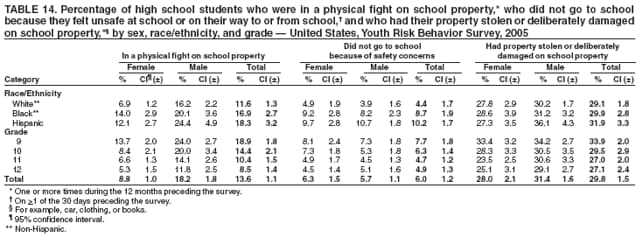 Return to top. Table 15 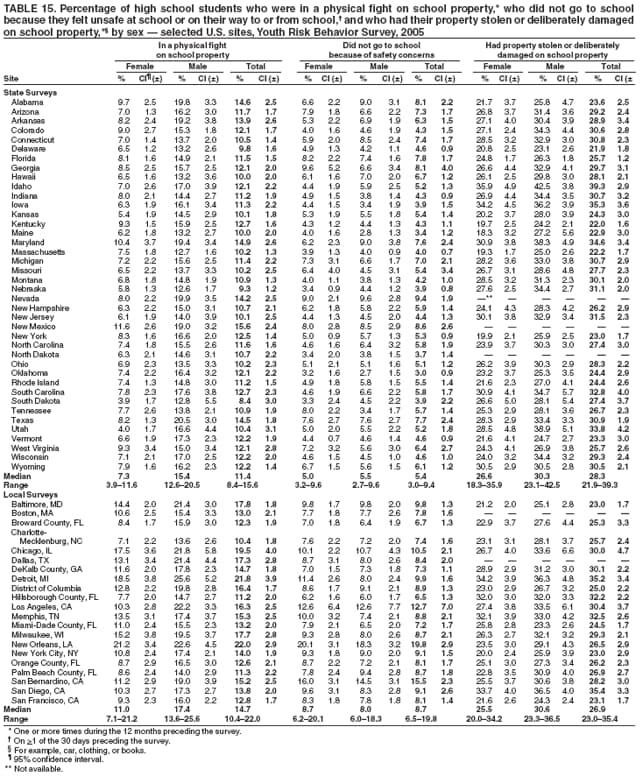 Return to top. Table 16 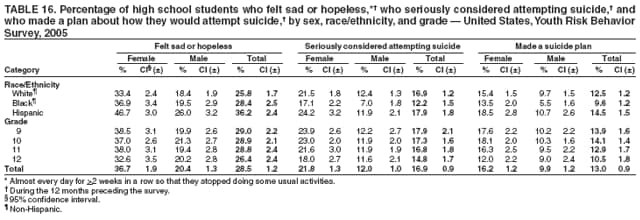 Return to top. Table 17 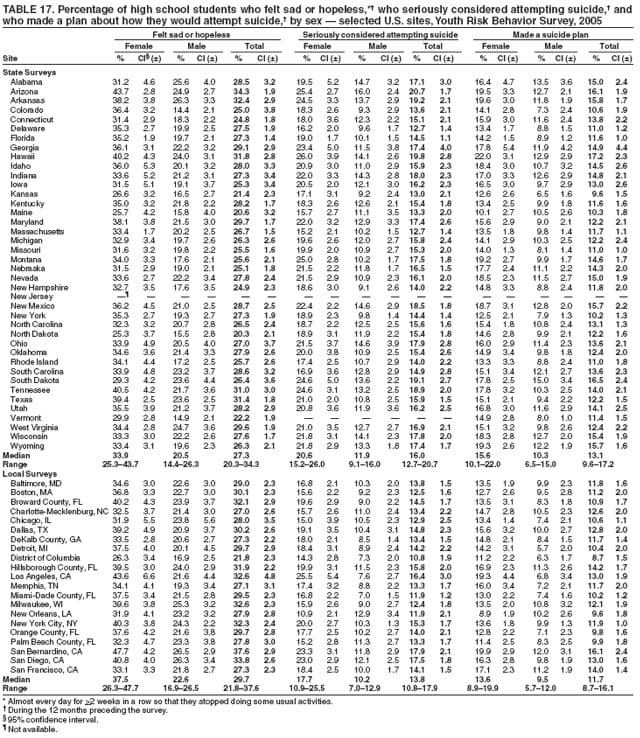 Return to top. Table 18 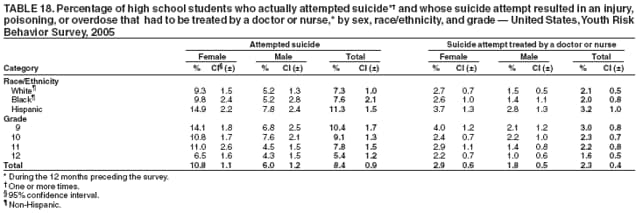 Return to top. Table 19 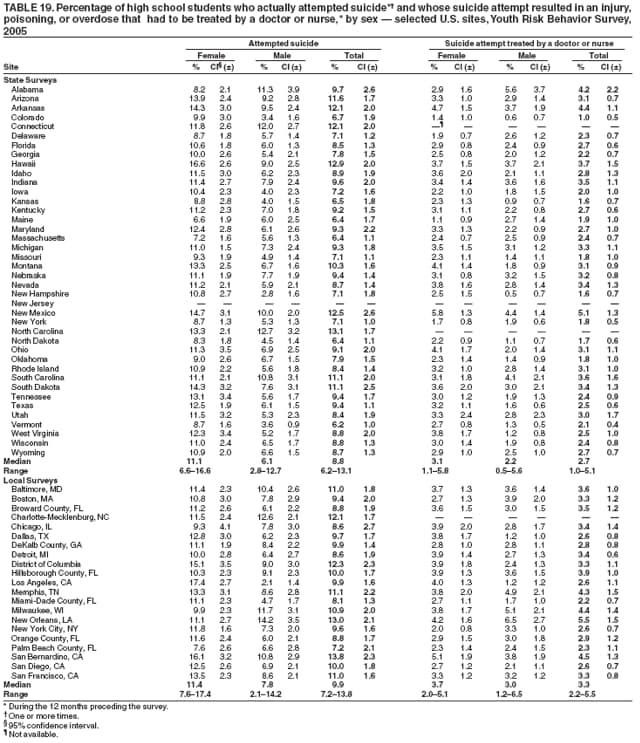 Return to top. Table 20 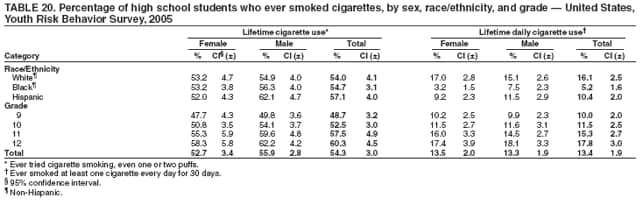 Return to top. Table 21 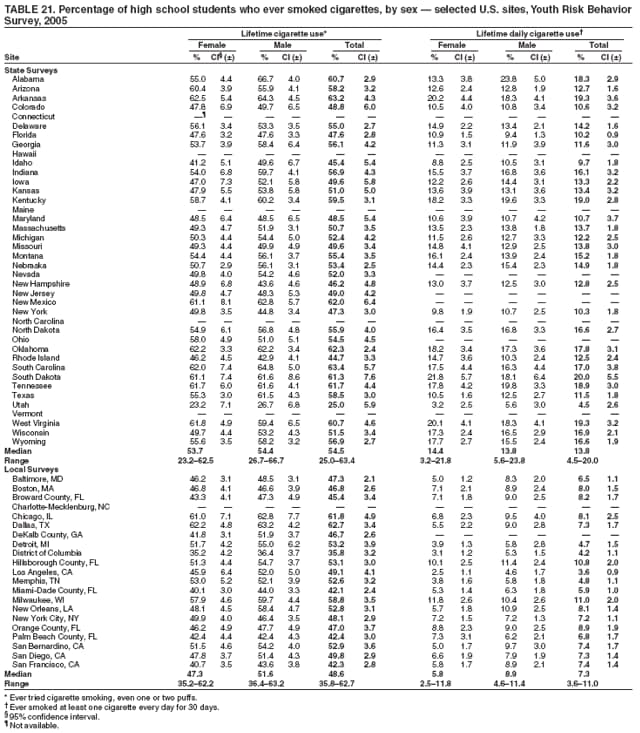 Return to top. Table 22 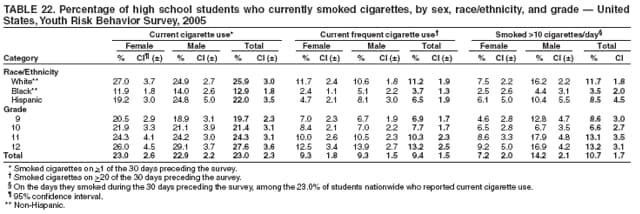 Return to top. Table 23 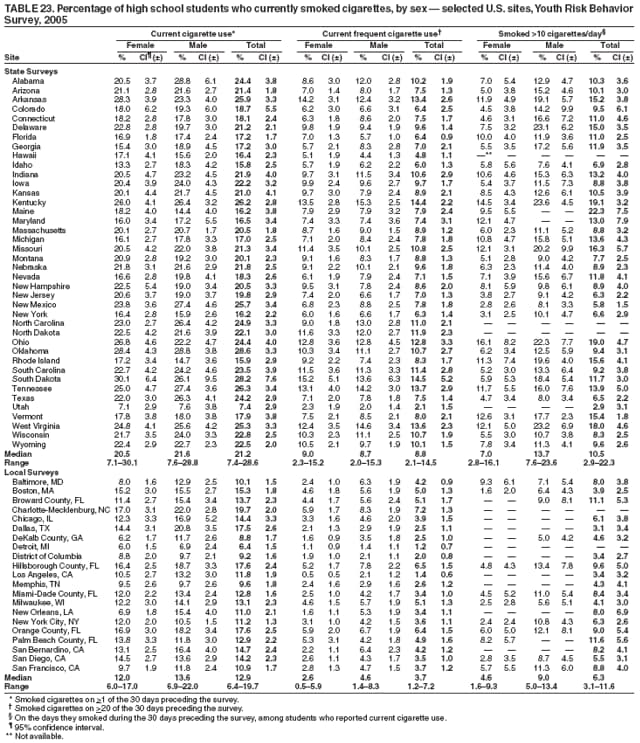 Return to top. Table 24 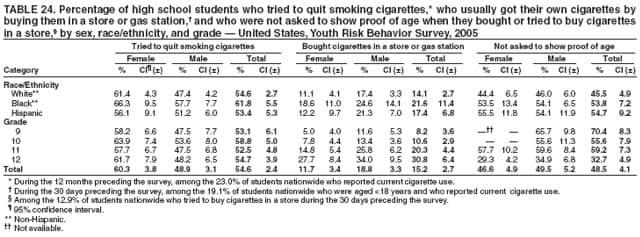 Return to top. Table 25 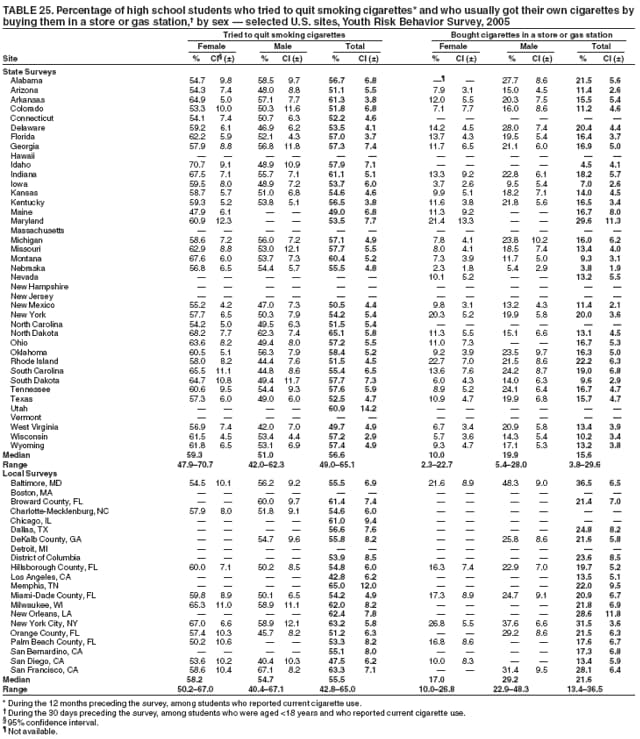 Return to top. Table 26 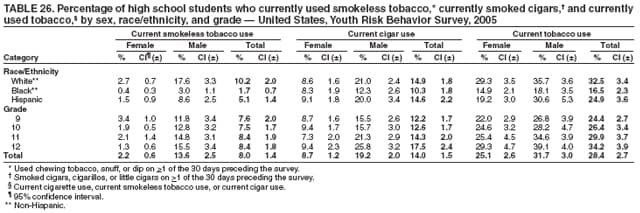 Return to top. Table 27 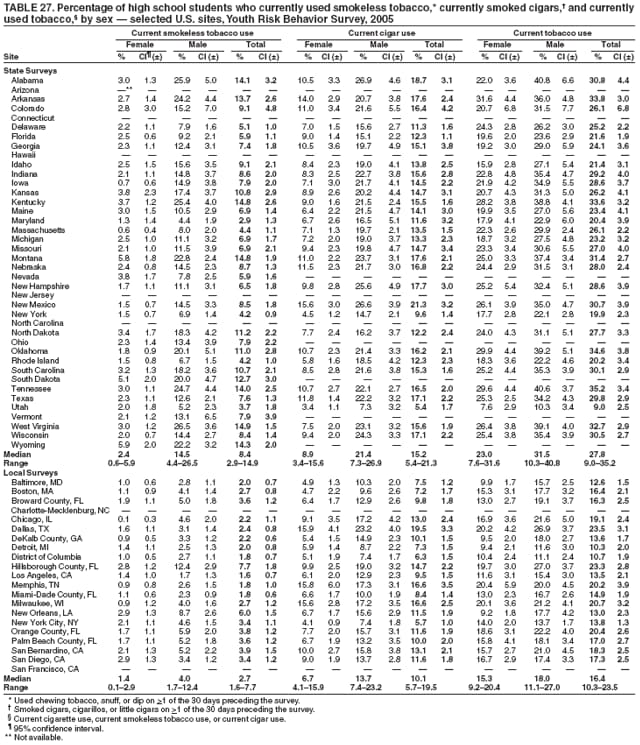 Return to top. Table 28 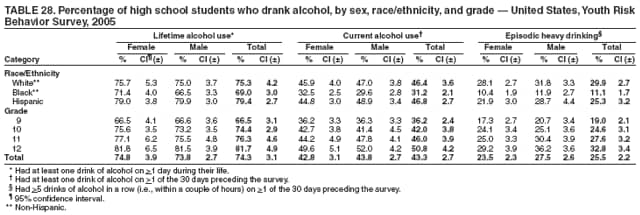 Return to top. Table 29 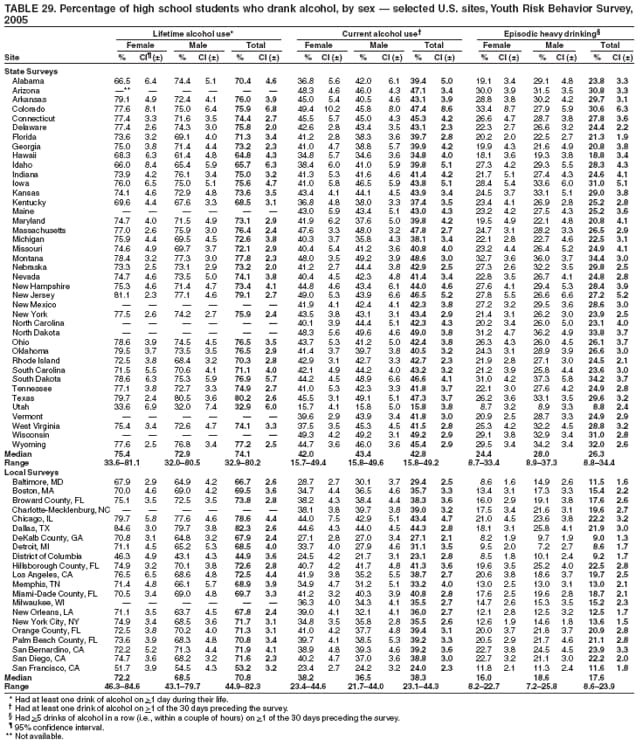 Return to top. Table 30 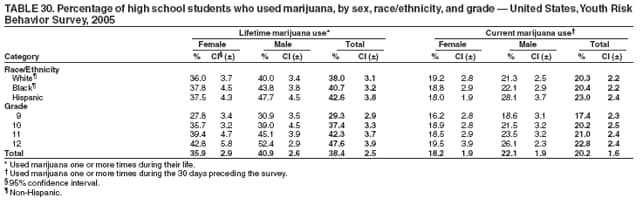 Return to top. Table 31 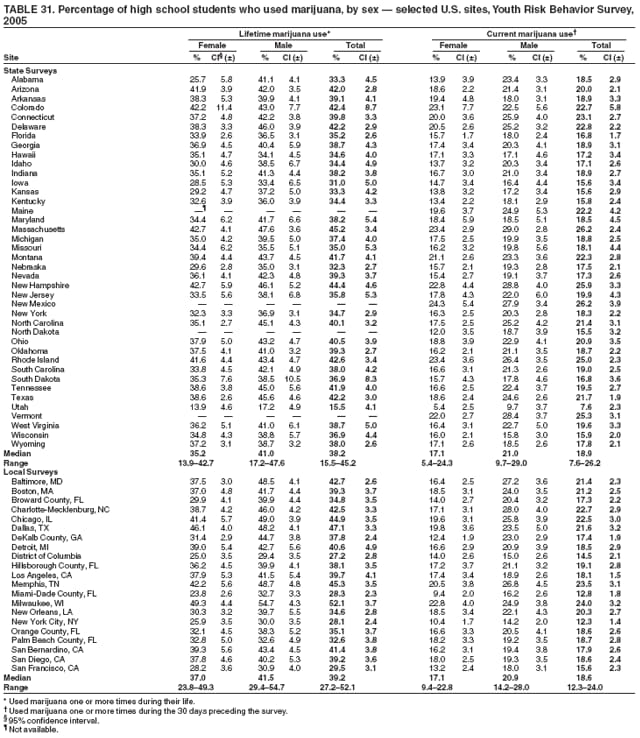 Return to top. Table 32 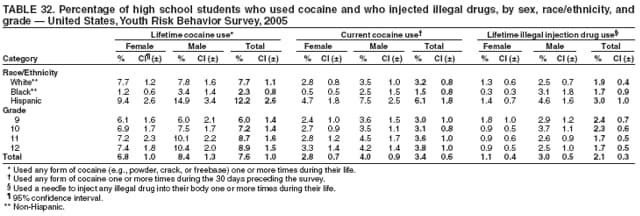 Return to top. Table 33 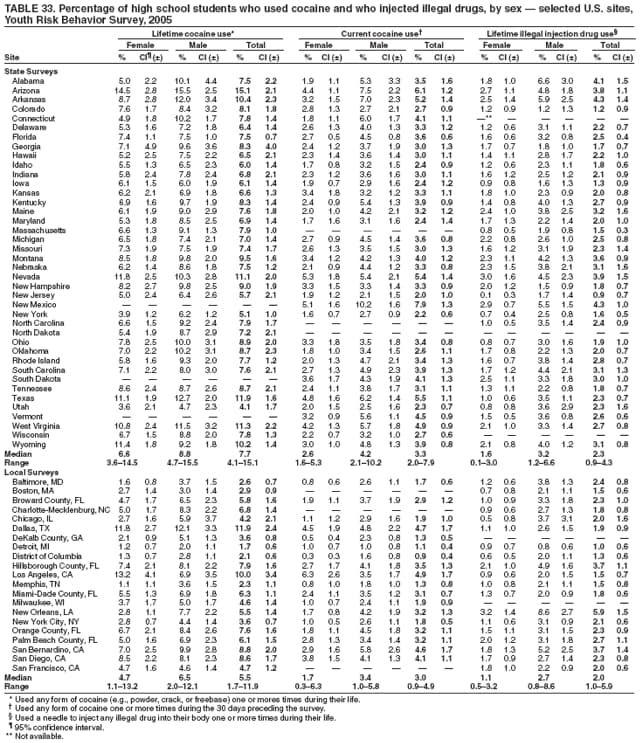 Return to top. Table 34 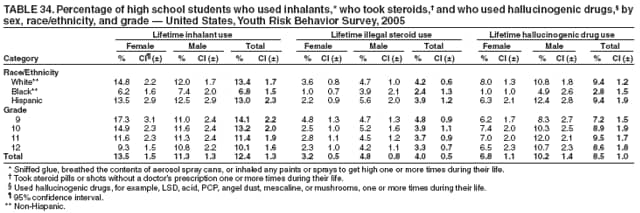 Return to top. Table 35 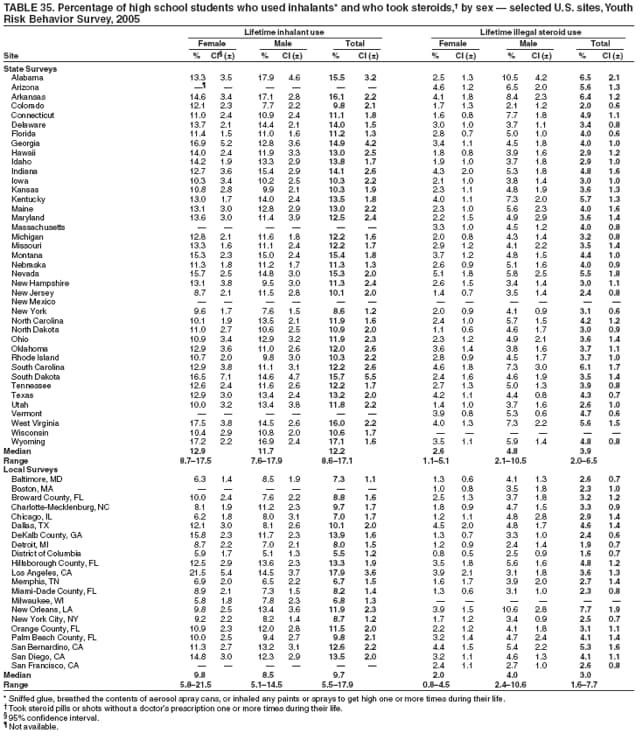 Return to top. Table 36 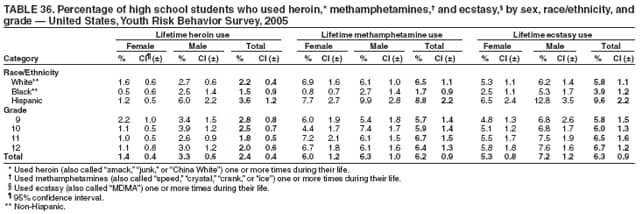 Return to top. Table 37 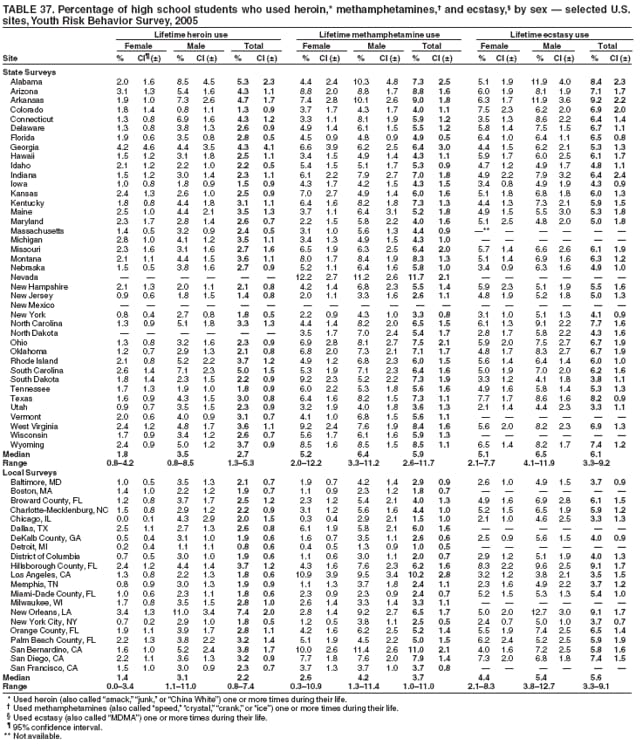 Return to top. Table 38 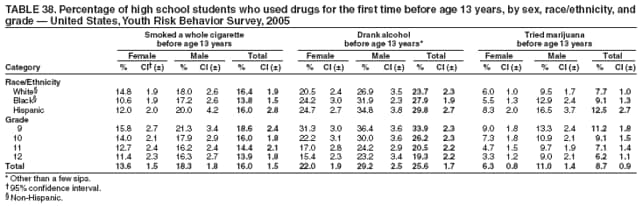 Return to top. Table 39 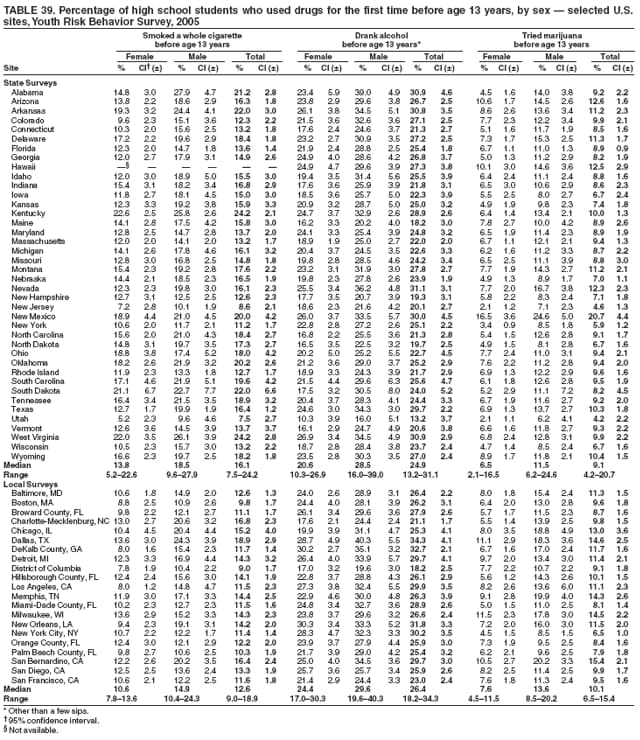 Return to top. Table 40 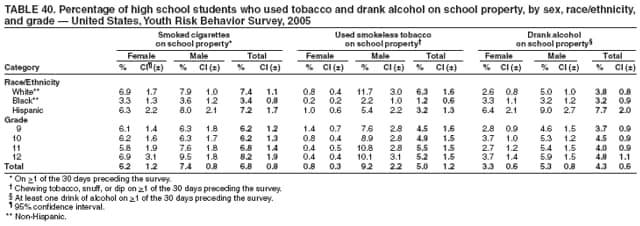 Return to top. Table 41 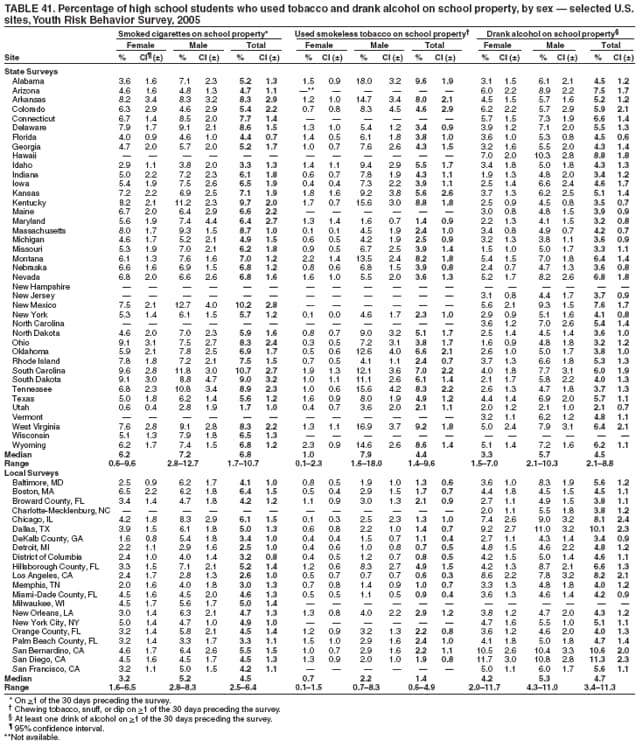 Return to top. Table 42 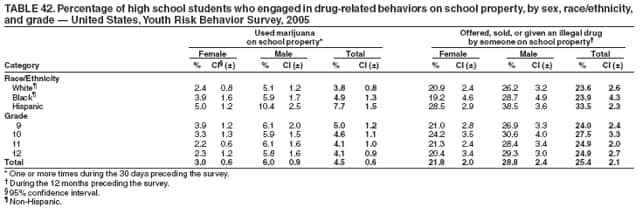 Return to top. Table 43 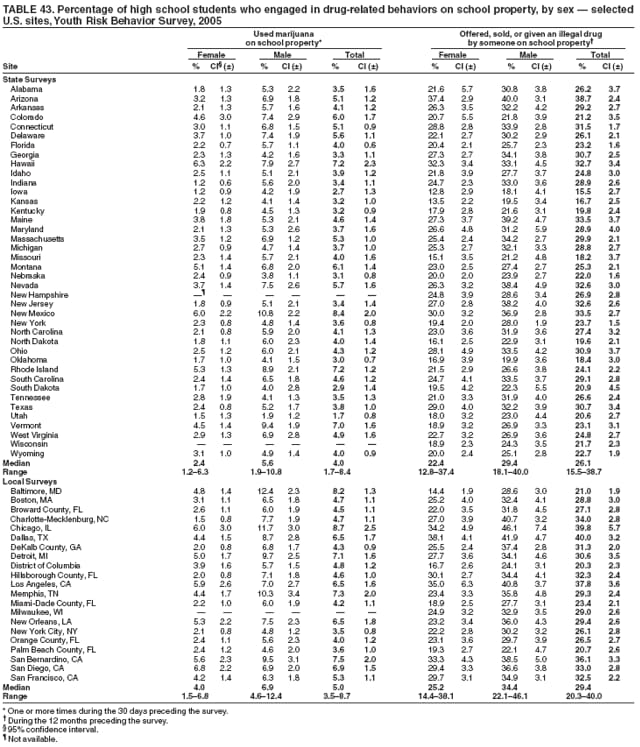 Return to top. Table 44 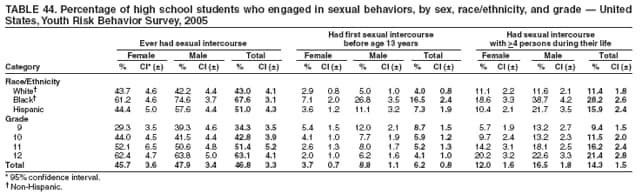 Return to top. Table 45 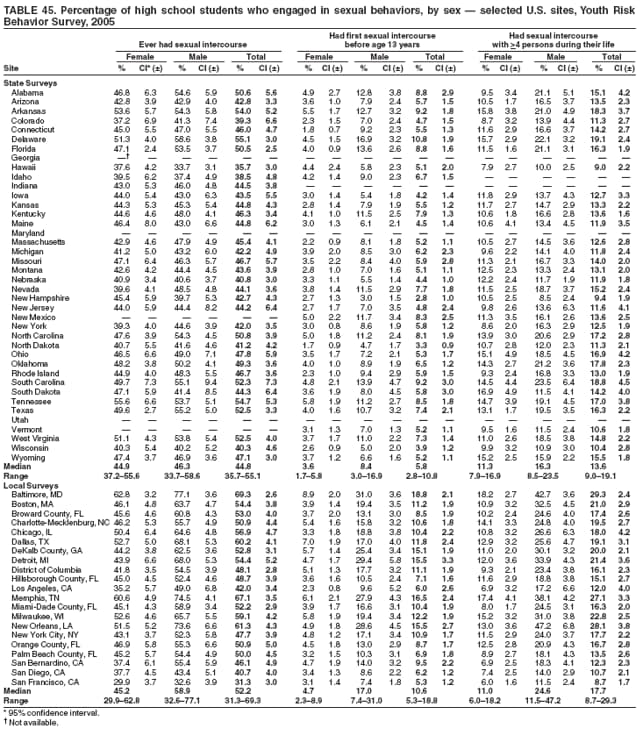 Return to top. Table 46 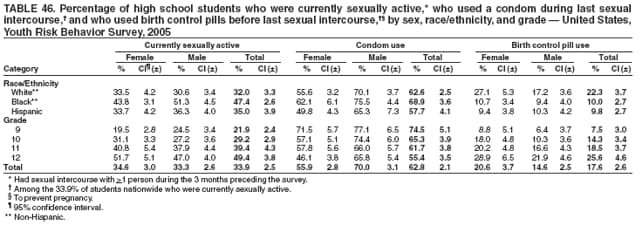 Return to top. Table 47  Return to top. Table 48 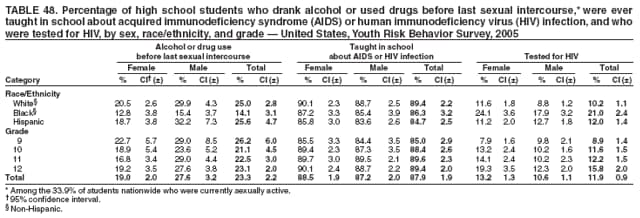 Return to top. Table 49 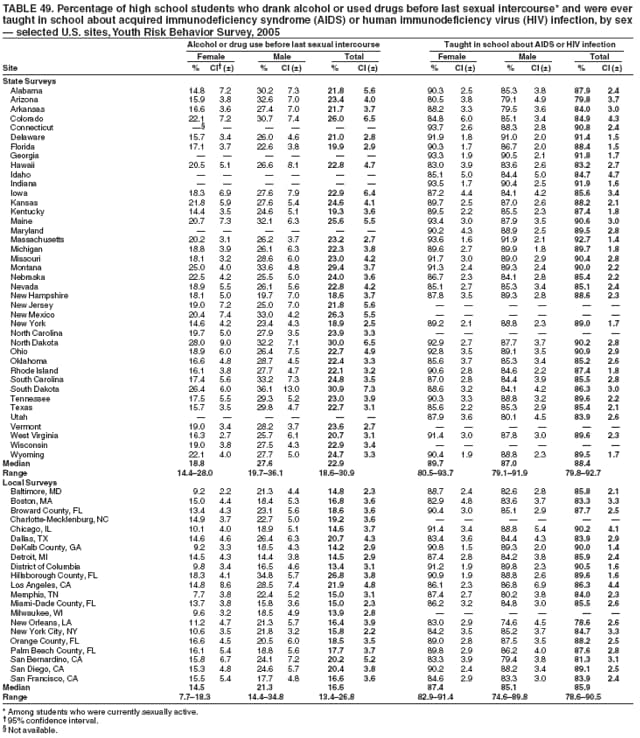 Return to top. Table 50 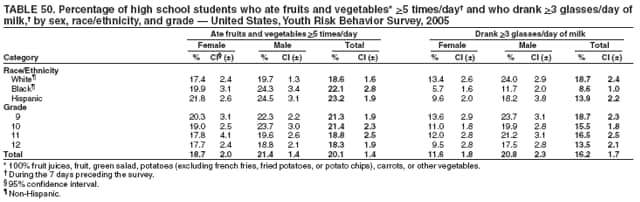 Return to top. Table 51 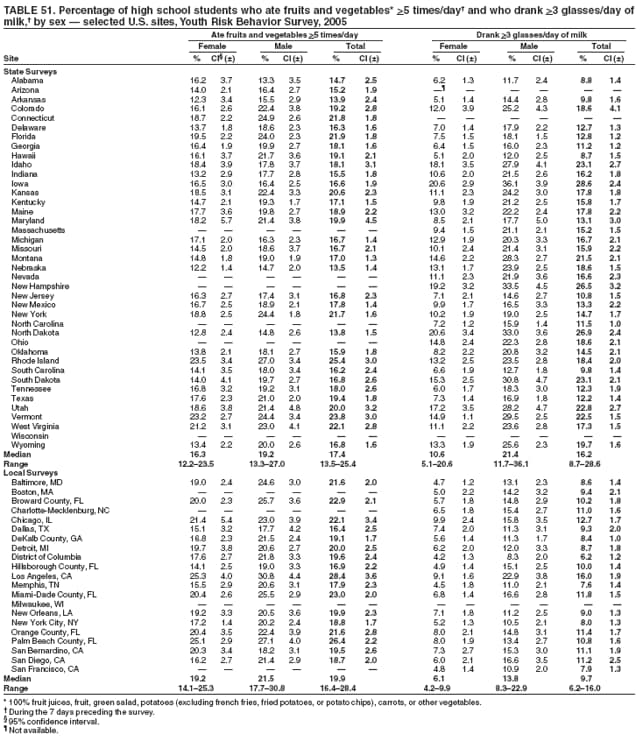 Return to top. Table 52 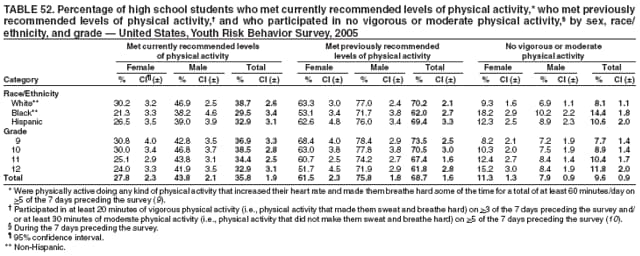 Return to top. Table 53 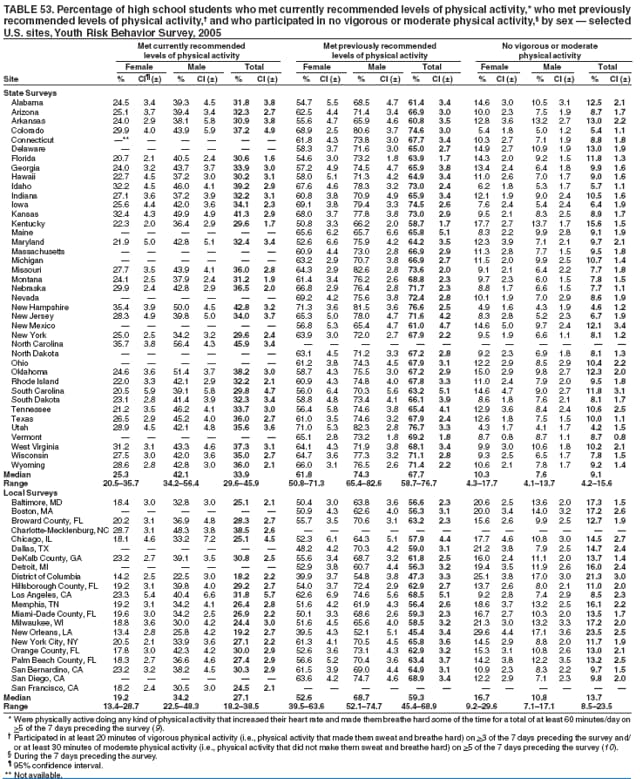 Return to top. Table 54 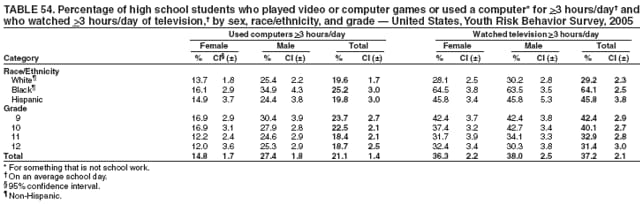 Return to top. Table 55 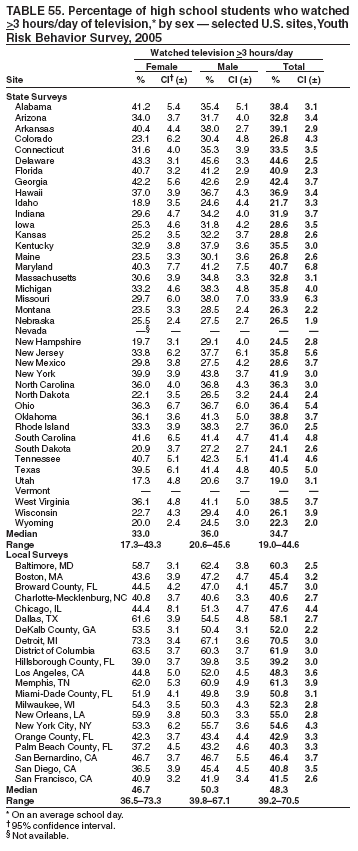 Return to top. Table 56 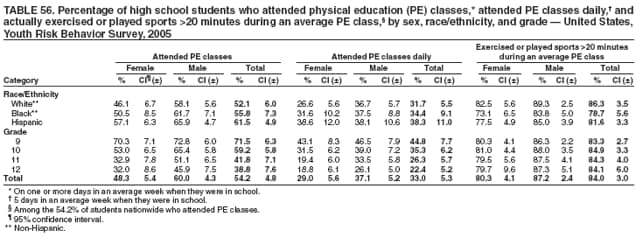 Return to top. Table 57 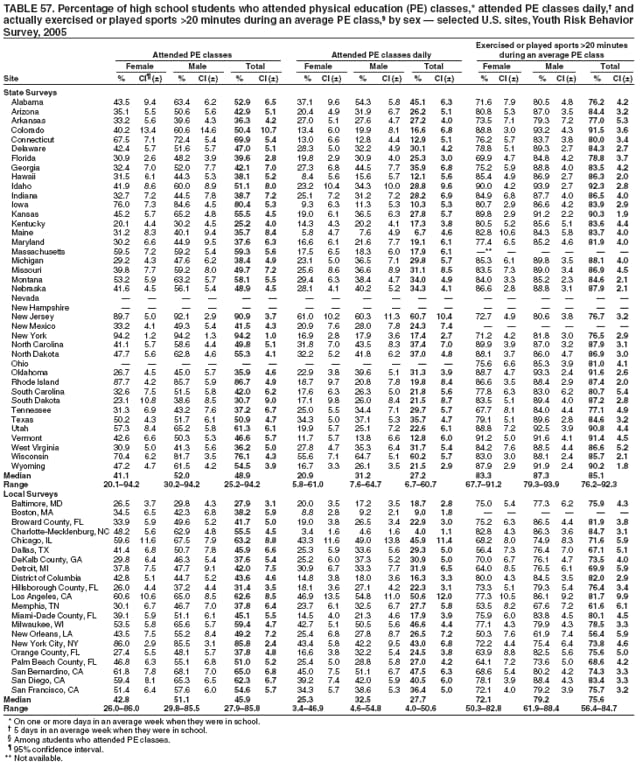 Return to top. Table 58 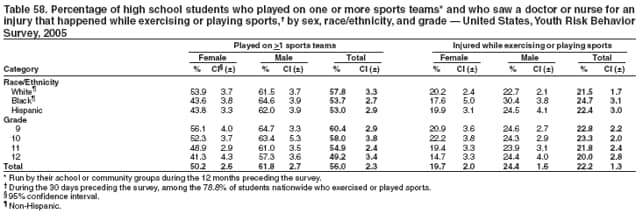 Return to top. Table 59 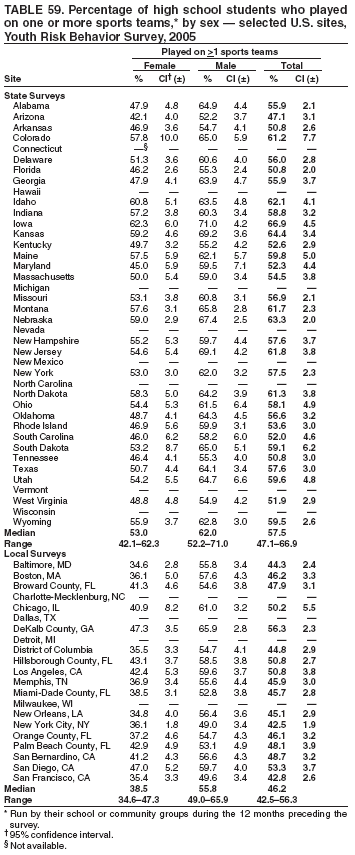 Return to top. Table 60 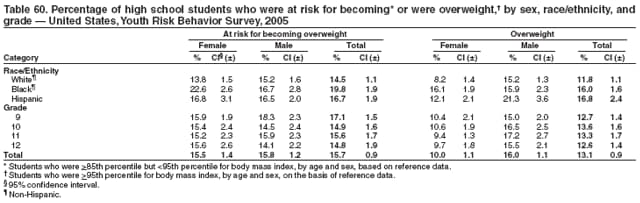 Return to top. Table 61 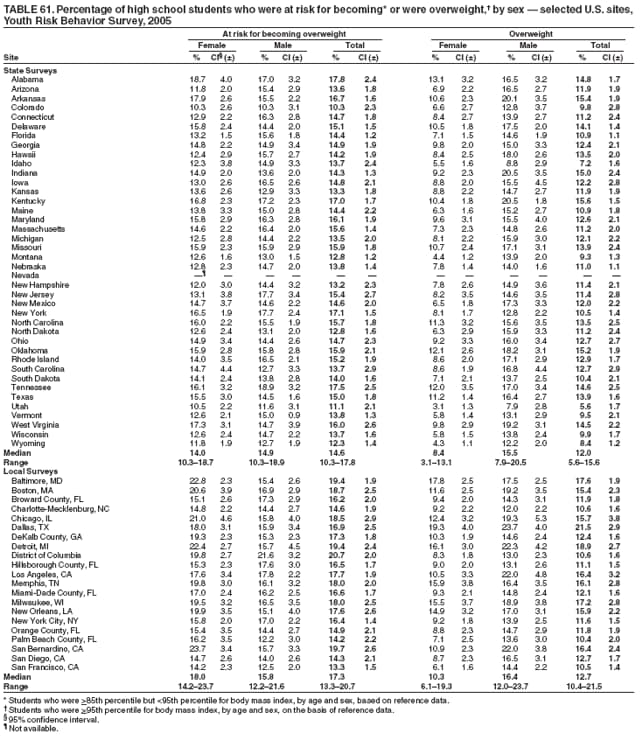 Return to top. Table 62 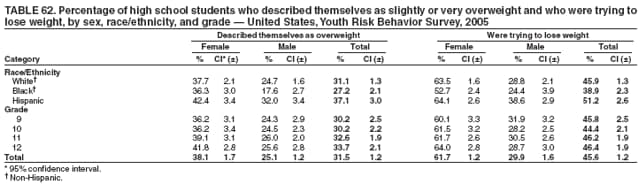 Return to top. Table 63 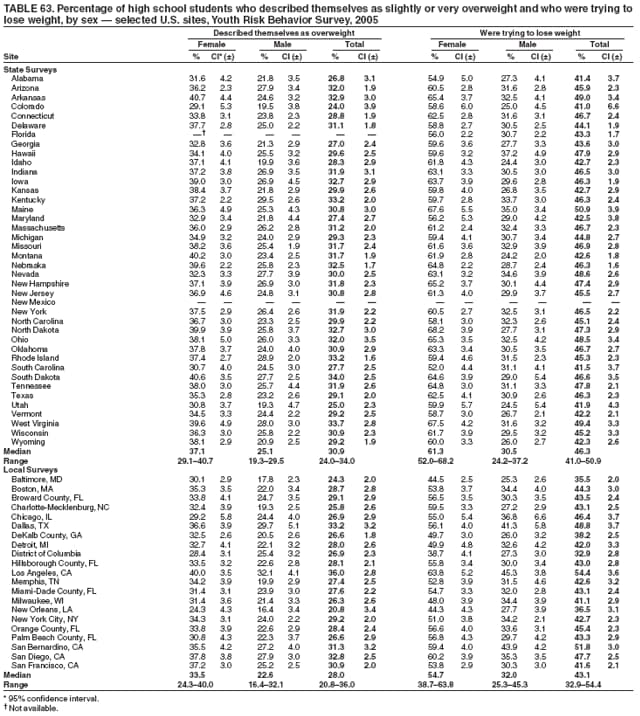 Return to top. Table 64 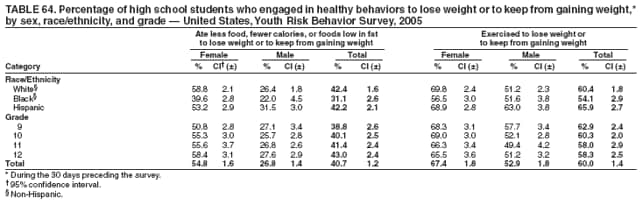 Return to top. Table 65 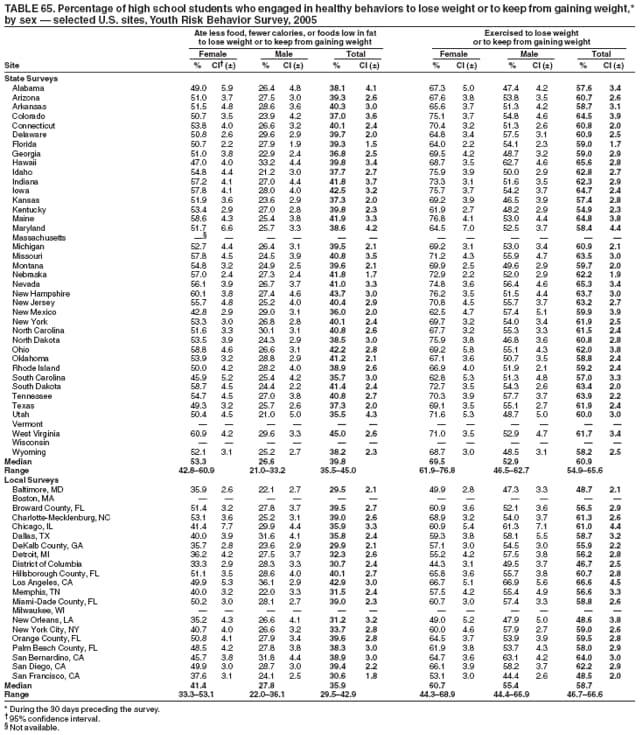 Return to top. Table 66 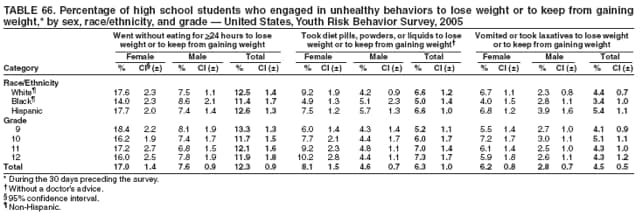 Return to top. Table 67 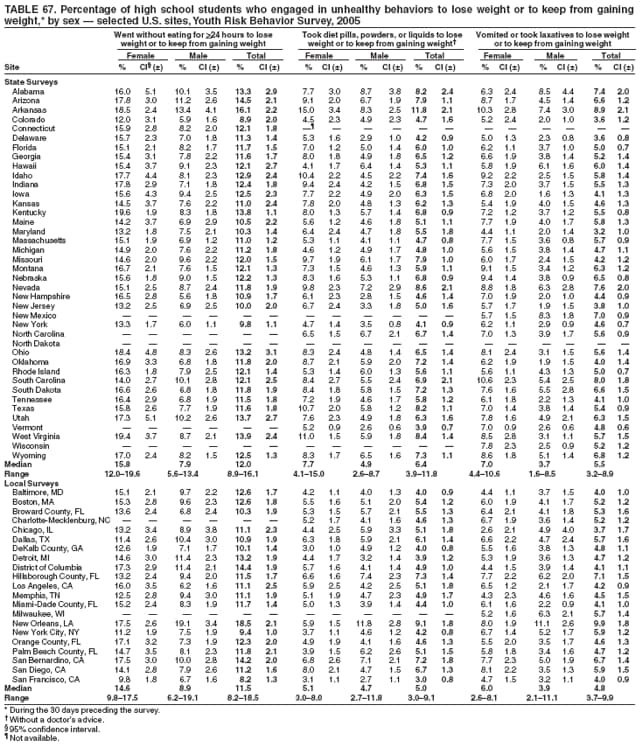 Return to top. Table 68 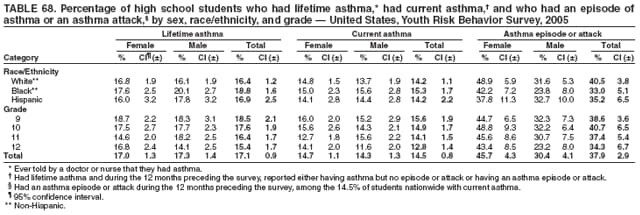 Return to top. Table 69 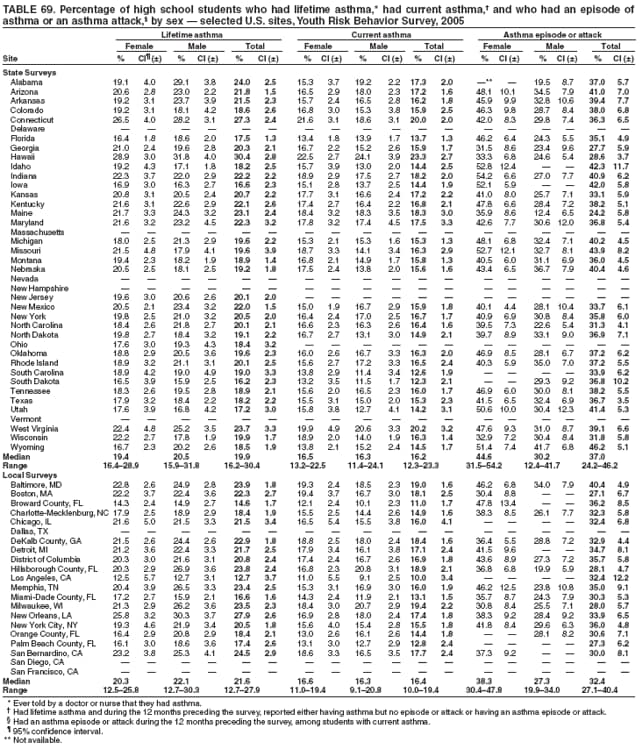 Return to top. Table 70 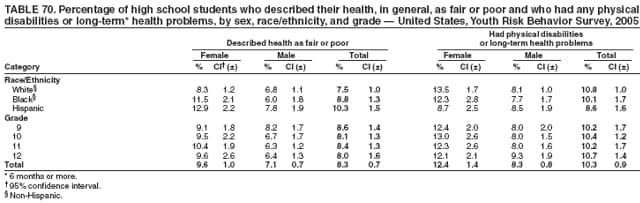 Return to top. Table 71 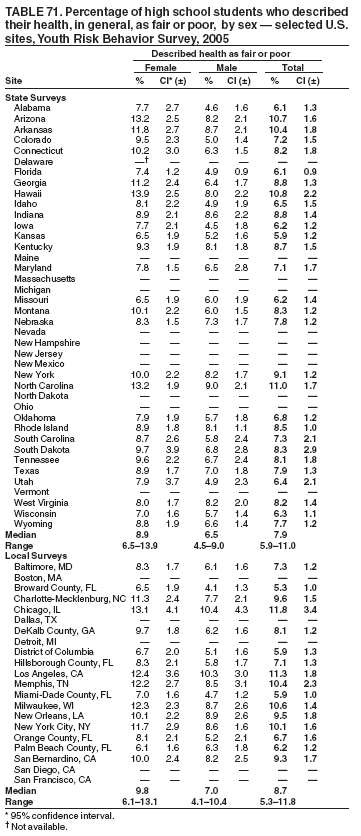 Return to top. Table 72 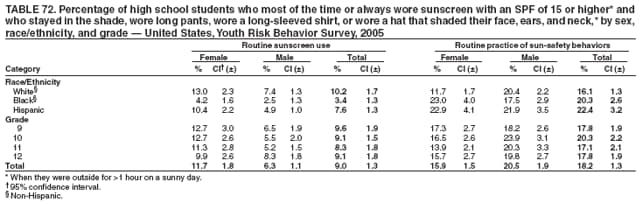 Return to top. Table 73 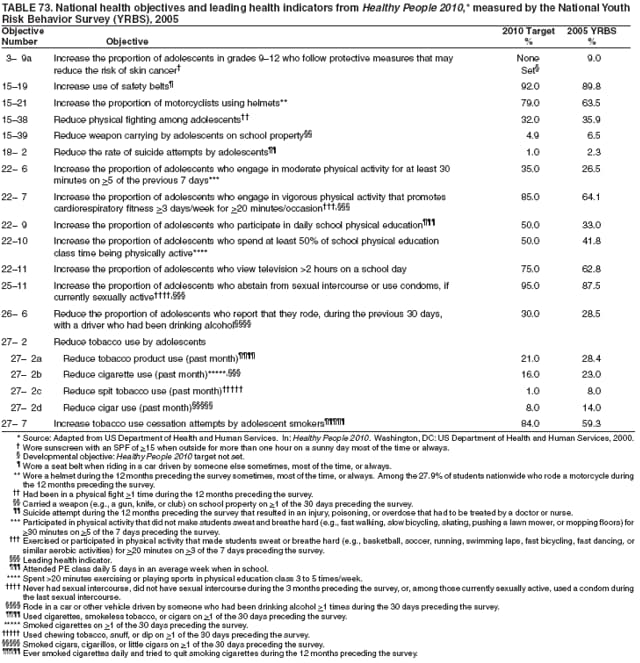 Return to top. Box 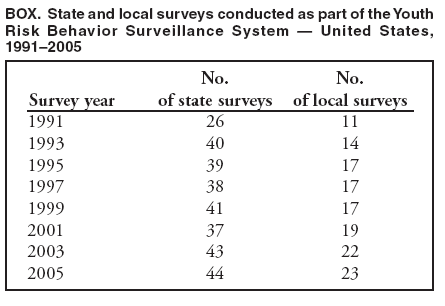 Return to top.
Disclaimer All MMWR HTML versions of articles are electronic conversions from ASCII text into HTML. This conversion may have resulted in character translation or format errors in the HTML version. Users should not rely on this HTML document, but are referred to the electronic PDF version and/or the original MMWR paper copy for the official text, figures, and tables. An original paper copy of this issue can be obtained from the Superintendent of Documents, U.S. Government Printing Office (GPO), Washington, DC 20402-9371; telephone: (202) 512-1800. Contact GPO for current prices. **Questions or messages regarding errors in formatting should be addressed to mmwrq@cdc.gov.Date last reviewed: 5/25/2006 |
|||||||||
|