 |
|
|
|
|
|
|
| ||||||||||
|
|
|
|
|
|
|
||||
| ||||||||||
|
|
|
|
|
Persons using assistive technology might not be able to fully access information in this file. For assistance, please send e-mail to: mmwrq@cdc.gov. Type 508 Accommodation and the title of the report in the subject line of e-mail. Surveillance for AIDS-Defining Opportunistic Illnesses, 1992-1997Jeffrey L. Jones, M.D., M.P.H.(1) Debra L. Hanson, M.S.(1) Mark S. Dworkin, M.D., M.P.H.T.M. (1) David L. Alderton, Ph.D.(1) Patricia L. Fleming, Ph.D.(1) Jon E. Kaplan, M.D.(1),(2) John Ward, M.D.(1) 1 Division of HIV/AIDS Prevention-Surveillance and Epidemiology, National Center for HIV, STD, and TB Prevention 2 Division of AIDS, STD, and TB Laboratory Research, National Center for Infectious Diseases Abstract Problem/Condition: Acquired immunodeficiency syndrome (AIDS)-defining opportunistic illnesses (OIs) are the major cause of morbidity and mortality among persons infected with human immunodeficiency virus (HIV). As a result of new treatments that reduce mortality for persons with AIDS, the number of persons living with AIDS is increasing, and the incidence of AIDS is decreasing. In 1997, an estimated 271,245 persons were living with AIDS in the United States and thus were at high risk for OIs. In 1997, an estimated 21,909 HIV-infected persons died with AIDS, nearly all as a result of OIs. Reporting Period Covered: Aggregate data and trends for 1992-1997 were examined to determine a) the frequencies at which OIs occurred first; b) the incidence of OIs; c) the percentage of persons among those who have died who had had a given OI during their course of AIDS, and d) the frequency of prescriptions for antiretroviral therapy and prophylaxis for Pneumocystis carinii pneumonia (PCP) and for Mycobacterium avium complex disease (MAC). Description of System: Data were analyzed from the Adult/Adolescent Spectrum of HIV Disease (ASD) sentinel surveillance project, a prospective medical record review of HIV-infected persons aged greater than or equal to 13 years conducted in 11 U.S. cities. ASD data were standardized to national AIDS surveillance data for 1992-1997 by age; race; sex; country of birth; year of AIDS diagnosis; HIV exposure mode; and for incidence calculations, by CD4+ T-lymphocyte distribution. Results: The incidence declined significantly for each of 15 of the 26 specific AIDS-defining OIs (p less than 0.05). PCP was the most common AIDS-defining OI to occur first (PCP was the first OI to occur for 36% of HIV-infected persons), the most common incident AIDS-defining OI (274 cases per 1000 person-years), and the most common AIDS-defining OI to have occurred during the course of AIDS (53% of persons who died with AIDS had PCP diagnosed at some time during their course of AIDS). Of persons with CD4+ T-lymphocyte counts less than 500 cells/uL, the number with prescriptions for triple combination therapy increased from zero in 1992 to 40% in 1997, and 80% of persons had a prescription for any antiretroviral therapy in 1997. Of persons with CD4+ T-lymphocyte counts less than 200 cells/uL, the percentage with prescriptions for PCP prophylaxis remained stable from 1992 through 1997 (range: 75% to 80%). Of persons with CD4+ T-lymphocyte counts less than 50 cells/uL, the percentage with prescriptions for MAC prophylaxis increased from 9% in 1992 to 44% in 1997. Interpretations: The incidences of many OIs are decreasing primarily because of advances in HIV-related therapy. However, OIs are still occurring, especially when patients access care late during the course of disease. Even after accessing care, persons may develop OIs because of lack of prescription for prophylaxis, antiretroviral drug resistance, or poor adherence to therapy. During 1992-1997, most patients in need of PCP prophylaxis received a prescription for it; however, even in 1997, most patients in need of MAC prophylaxis did not receive a prescription for it. Actions Taken: These surveillance data are used by persons involved with developing guidelines for preventing OIs to determine the importance of and trends in OIs and preventive therapy. CDC is developing population-based approaches for surveillance of HIV disease progression, OIs, and therapies with the goal of making these data available in more geographic areas to help assess public health and health-care programs. INTRODUCTION Acquired immunodeficiency syndrome (AIDS)-defining opportunistic illnesses (OIs) are the major cause of morbidity and mortality among human immunodeficiency virus (HIV)-infected persons. As a result of new treatments that improve outcomes for HIV-infected persons, the prevalence of AIDS is increasing (1). In 1997, an estimated 271,245 persons were living with AIDS in the United States and thus were at high risk for OIs (1). In 1997, an estimated 21,909 HIV-infected persons died with AIDS, nearly all from OIs. The incidence of major OIs (2-4) and the percentage of HIV-infected persons with various OIs during a specified period have been documented (5). However, few studies have reported the occurrence of each AIDS-defining OI during the course of AIDS (6,7). Such analyses are helpful for determining the preventive medications and treatments needed for HIV-infected persons. In addition, examination of the frequencies and trends in the AIDS-defining OIs first to occur can assist in determining the first severe and potentially preventable life-threatening event encountered by HIV-infected persons. To determine the frequencies and trends in the OIs first to occur, the incidence of OIs, and the OIs that occurred during the course of AIDS, data were analyzed from the CDC-sponsored Adult/Adolescent Spectrum of HIV Disease (ASD) sentinel surveillance project. METHODS ASD was implemented by CDC in collaboration with state and local health departments to monitor the spectrum and frequency of HIV-associated illnesses. Data collection started in 1990. The methods for ASD have been described previously (8). At selected sites in Denver, Colo.; Los Angeles, Calif.; Atlanta, Ga.; New Orleans, La.; Detroit, Mich.; New York, N.Y.; Dallas, Houston, and San Antonio, Tex.; Seattle, Wash.; and Bayamon, Puerto Rico, HIV-infected persons aged greater than or equal to 13 years are identified at their first health-care encounter in an ASD clinic, regardless of the stage of their HIV infection. Approximately 100 medical facilities that provide inpatient and/or outpatient care for HIV-infected patients were included in this analysis. The facilities comprised public (73%) and private (27%) institutions. All HIV-infected persons who attend participating clinics are eligible for enrollment. To prevent oversampling of certain groups relative to the national population with AIDS, sampling of patients for inclusion is conducted at some sites: 50% of African American males in Atlanta since January 1994; 25%-50% of white males in Dallas, San Antonio, and selected sites in Seattle since 1990-1991; no white males (except injecting-drug users {IDUs}) at some Los Angeles sites since 1992; 40%-50% of all men at Detroit sites since 1993; and 16%-50% of white males at some New York City sites since January 1995. Information is collected about demographic characteristics, mode of HIV exposure, and any previous occurrences of conditions listed in the 1993 AIDS surveillance case definition (9). ASD data are reported to CDC without personal identifying information. During successive 6-month follow-up intervals, medical records are reviewed for illnesses, AIDS-defining conditions, prescriptions, laboratory tests (including CD4+ T-lymphocyte tests), and use of medical care. The CDC hierarchical classification is used for HIV exposure mode (1). OIs were defined by using the clinical AIDS conditions in the 1993 AIDS surveillance case definition (9). Definitive and presumptive diagnoses were combined for this analysis. Cytomegalovirus (CMV) retinitis was analyzed separately from other CMV disease. For ASD, lost to follow-up was defined as unable to locate a patient for greater than or equal to 18 months; during 1992-1997, 15.5% of ASD participants were lost to follow-up. Frequencies at Which OIs Occurred First The frequencies at which AIDS-defining OIs occurred first were calculated by analyzing cases diagnosed with clinical AIDS from 1992 through 1997 and reported to the ASD project through June 1998. The results are reported as the percentage of persons with any AIDS-defining OI who had a given OI as the first OI. The numerator for each OI is the number of persons for which that OI occurred first, and the denominator is all persons with at least one OI. The percentages for all 26 AIDS-defining OIs add to more than 100% because a person may have had more than one OI occur first. In this analysis, ASD data were weighted by age, race, country of birth (United States or foreign), year of AIDS diagnosis, sex, and HIV exposure mode (except when examining year-, sex-, and exposure-specific strata, respectively). The standard population used in the weighting process was defined as persons who had AIDS diagnosed in the United States during 1992-1997 and who were reported to CDC AIDS surveillance through June 1998. The national AIDS surveillance data used for the standard population were adjusted for reporting delays (10). The number of AIDS-defining OIs for each year in the standard population was estimated by the sum of the reported OIs and the predicted OIs under the immunologic criteria (11). Incidence of OIs The incidence of the first occurrence of each AIDS-defining OI for persons in the ASD population was calculated as a rate per 1,000 person-years. The first occurrence of a specific OI was defined as the initial diagnosis of that OI (i.e., it could be the first, second, or any subsequent diagnosis in a series of different OIs). Data were weighted using a procedure similar to that described for the frequencies at which OIs occurred first, except the CD4+ T-lymphocyte distribution was included when weighting to the standard population. The distribution of CD4+ T-lymphocyte counts used in the standard population was obtained from CDC national AIDS surveillance data for 1994-1997 because reporting of CD4+ counts was most complete during these years compared with previous years. Using this CD4+ T-lymphocyte distribution emphasizes the incidence of AIDS-defining OIs at CD4 counts that occur in the range at which AIDS typically occurs. Percentage of Persons with Specific OIs During the Course of AIDS The percentage of persons with specific OIs during the course of AIDS was calculated by analyzing cases among persons who died from 1992 through 1997 and who were reported to the CDC ASD project through June 1998. For this calculation, the numerator was the number of persons who ever had a given OI, and the denominator was the number of persons who died with one or more AIDS-defining OIs from 1992 through 1997. The standard population for the percentage of persons with specific OIs diagnosed during the course of AIDS was defined as persons with AIDS who died during 1992-1997 who were recorded in national AIDS surveillance and who were reported to CDC through June 1998. The national AIDS surveillance data used for the standard population were adjusted for delays in reporting deaths. Data were weighted using a procedure similar to that described for the frequencies at which OIs occurred first. Frequencies of Prescriptions for Antiretroviral Therapy and Prophylaxis for Pneumocystis carinii Pneumonia and Mycobacterium avium Complex Disease Trends in prescribing antiretroviral therapy were assessed for persons with CD4+ T-lymphocyte counts less than 500 cells/uL. Triple combination therapy was defined as two nucleoside analogue reverse transcriptase inhibitors combined with a protease inhibitor or nonnucleoside reverse transcriptase inhibitor as recommended in the Guidelines for the Use of Antiretroviral Agents in HIV-Infected Adults and Adolescents (12). Dual combination therapies assessed were zidovudine combined with didanosine, zalcitabine, or lamivudine and stavudine combined with didanosine or lamivudine. Monotherapies were defined as zidovudine, didanosine, or stavudine. Trends in prescribing medications for primary prophylaxis of Pneumocystis carinii pneumonia (PCP) (trimethoprim-sulfamethoxazole {TMP-SMZ}, dapsone, or aerosolized pentamidine) were assessed for persons with CD4+ T-lymphocyte counts less than 200 cells/uL. Trends in prescribing primary prophylaxis for Mycobacterium avium complex disease (MAC) (rifabutin, clarithromycin, or azithromycin) were assessed for persons with CD4+ T-lymphocyte counts less than 50 cells/uL. Data about treatment and prophylaxis were weighted using a procedure similar to that described for the incidence calculations. Data were analyzed using SAS software (13). Trends were examined and frequencies and incidence rates by sex and HIV exposure mode were compared using the stratified Cochran-Mantel-Haenszel statistic. RESULTS Frequencies at Which OIs Occurred First From January 1992 through December 1997, AIDS-defining OIs were diagnosed in 12,982 HIV-infected persons. Of these, 10,658 (82%) were males, and 2,324 (18%) were females. The percentage of males with an AIDS-defining OI for whom a given OI occurred first ranged from zero (for chronic isosporiasis) to 35.7% (for PCP) (Table_1). Similarly, the percentage of women with an AIDS-defining OI for whom a given OI occurred first ranged from zero (for chronic isosporiasis, Burkitts lymphoma, and recurrent Salmonella septicemia) to 33.7% (for PCP) (Table_2). The frequency at which AIDS-defining OIs occurred first varied by sex. For example, for males, the OIs more likely to occur first were Kaposi sarcoma (KS), extrapulmonary cryptococcosis, and CMV disease (Table_1). For females, the OIs more likely to occur first were esophageal candidiasis, recurrent pneumonia, pulmonary tuberculosis (TB), and chronic herpes simplex (Table_2). However, among IDUs, pulmonary TB was more likely to occur first among males than among females. The frequency at which AIDS-defining OIs occurred first also varied by HIV exposure mode (Table_1) and (Table_2). The OIs that occurred first more frequently among men who have sex with men (MSM) were KS, CMV retinitis, CMV disease, and chronic cryptosporidiosis. However, the OIs that occurred first more frequently among both male IDUs and males exposed to HIV through heterosexual contact were pulmonary TB, extrapulmonary TB, recurrent pneumonia, toxoplasmosis of the brain, and disseminated histoplasmosis. In addition, chronic herpes simplex and disseminated coccidioidomycosis occurred first more frequently among men exposed to HIV through heterosexual contact. There were few statistically significant differences in the frequency at which OIs occurred first between female IDUs and females exposed to HIV through heterosexual contact. However, toxoplasmosis of the brain occurred first more frequently among females exposed to HIV through heterosexual contact, and immunoblastic lymphoma occurred first more frequently among female IDUs (values in Table 2 are rounded). During 1992-1997, the frequency at which OIs occurred first increased for five OIs and decreased for five OIs (Table_3). The frequency at which PCP occurred first remained constant during this period, and the frequency at which esophageal candidiasis occurred first increased. Incidence of OIs Overall, 22,558 HIV-infected persons (17,404 {77%} males and 5,154 {23%} females) were followed 35,933 person-years; 6,113 persons had incident OIs. The incidence of AIDS-defining OIs varied by sex. Overall, the incidences of KS, CMV disease, and extrapulmonary cryptococcosis were higher in males than in females (Table_4) and (Table_5); however, among IDUs and persons exposed to HIV through heterosexual contact, the incidence of CMV disease was higher in females than in males. Overall, the incidences of pulmonary TB, chronic herpes simplex disease, and extrapulmonary TB were higher in females than in males. However, among IDUs, the incidence of extrapulmonary TB was higher in males than in females. The incidence of AIDS-defining OIs also varied by HIV exposure mode (Table_4) and (Table_5). The incidences of MAC, CMV retinitis, KS, CMV disease, and chronic cryptosporidiosis were higher for MSM than for other male groups. However, the incidences of PCP, recurrent pneumonia, toxoplasmosis of the brain, pulmonary TB, and extrapulmonary TB were higher for male IDUs and males exposed to HIV through heterosexual contact (except PCP) than for MSM. The incidences of any OI (combined) and of esophageal candidiasis were higher for female IDUs than females exposed to HIV through heterosexual contact. The incidence of CMV retinitis was higher for females with a heterosexual HIV exposure risk than for female IDUs. During 1992-1997, the incidence decreased significantly for any AIDS-defining OI (combined) and for 15 of the 26 specific AIDS-defining OIs (p less than 0.05) (Table_6). Even for many OIs without statistically significant declines over all years, incidences declined in 1997. For example, in 1997, incidences declined for esophageal candidiasis, recurrent pneumonia, progressive multifocal leukoencepalopathy, immunoblastic lymphoma, primary brain lymphoma, and disseminated histoplasmosis. No significant increases in incidence occurred during 1992-1997. In general, the largest decreases in incidence occurred during the most recent years. Percentage of Persons with Specific OIs During the Course of AIDS During 1992-1997, a total of 10,353 HIV-infected persons observed in the ASD project died with AIDS. Of these, 8,811 (85%) were males, and 1,542 (15%) were females. Overall, the percentages of males who ever had a given OI during the course of AIDS ranged from 0.1% (for chronic isosporiasis) to 52.8% (for PCP) (Table_7). Overall, the percentages of females who ever had a given OI during the course of AIDS ranged from zero (for Burkitts lymphoma and chronic isosporiasis) to 52.2% (for PCP) (Table_8). OIs diagnosed more frequently among males than among females were KS, CMV retinitis, CMV disease, extrapulmonary cryptococcosis, and toxoplasmosis of the brain (Table_7) and (Table_8). However, for IDUs, CMV disease was diagnosed more frequently among females than among males. Overall, OIs diagnosed more frequently among females than among males were esophageal candidiasis, pulmonary TB, and chronic herpes simplex. However, for IDUs and persons exposed to HIV through heterosexual contact, pulmonary TB was diagnosed more frequently among males than among females. The frequency of OIs during the course of AIDS also varied by sex and HIV exposure mode. For example, MAC, KS, CMV retinitis, CMV disease, and chronic cryptosporidiosis were diagnosed more frequently among MSM than among other groups of men (Table_7). However, male IDUs had pulmonary TB and extrapulmonary TB diagnosed more frequently than other groups of men. There were few significant differences in the frequency of OIs during the course of AIDS among women (Table_8). However, pulmonary TB was diagnosed more frequently among female IDUs, and CMV retinitis was diagnosed more frequently among females exposed to HIV through heterosexual contact. For many AIDS-defining OIs, the annual percentage of persons with specific OIs during the course of AIDS remained constant during 1992-1997 (Table_9). However, the percentage decreased for persons who ever had PCP, toxoplasmosis of the brain, extrapulmonary TB, disseminated non-MAC Mycobacterium, and pulmonary candidiasis, and the percentage increased for persons who ever had wasting syndrome, recurrent pneumonia, or pulmonary TB. The median number of unique AIDS-defining OIs per person during the course of AIDS was two (25th percentile, one unique AIDS-defining OI; 75th percentile, three unique AIDS-defining OIs) (range: 1-10 unique AIDS-defining OIs). Frequencies of Prescriptions for Antiretroviral Therapy and Prophylaxis for PCP and MAC From 1992 through 1997, among persons with CD4+ T-lymphocyte counts less than 500 cells/uL, prescription of dual combination therapy increased from 22% to 32%, and prescription of triple combination therapy increased from zero to 40% (Figure_1). During this period, prescription of monotherapy decreased from 58% to 7% (Figure_1). Among persons with CD4+ T-lymphocyte counts less than 200 cells/uL, prescriptions to prevent PCP remained relatively stable (75%-80%), but the percentage of persons receiving TMP-SMZ increased from 1992 through 1995 (from 57% to 64%) (Figure_2). Although prescriptions to prevent MAC increased each year during 1993-1997 among persons with CD4+ T-lymphocyte counts less than 50 cells/uL (Figure_3), most (56%) of these severely immunosuppressed HIV-infected persons still had not had this medication prescribed in 1997. DISCUSSION During 1992-1997, PCP was the most common AIDS-defining OI to occur first (36%), the most common incident AIDS-defining OI, and the most common AIDS-defining OI to have occurred among persons who had died with AIDS. The incidence of PCP decreased, and the percentage of persons who ever had PCP during the course of AIDS decreased. However, previous analyses in ASD during this period indicated that PCP remained the most common OI to occur first because of a) delays in diagnosis of HIV infection and in access to care for some groups, b) occurrence despite use of prophylaxis at low CD4+ T-lymphocyte counts, and c) probable lack of compliance with prophylaxis (14). Previous analyses in ASD also have indicated that up to 50% of PCP cases occur in persons who have not been tested for HIV or who have not accessed care (14). In the current analysis, the percentage of PCP that ever occurred among persons who had died with AIDS was substantially lower (53% during 1992-1997 and 43% in 1997) than that found in 1990 and before (67%) (6). The recommendations for PCP prophylaxis were promulgated in 1989 (15) and probably account for much of the decline in the incidence of PCP. The percentage of persons with prescriptions for TMP-SMZ increased from 57% in 1992 to 64% in 1995 and remained relatively stable thereafter (Figure_2). TMP-SMZ is easy to administer and is effective at preventing PCP (16). Since late 1995, triple combination antiretroviral therapy probably has had a substantial impact on PCP (and other OIs) by slowing the progression of HIV disease. Other studies indicate a substantial reduction from January 1994 through June 1997 in the incidence of PCP and other OIs associated with an increase in combination therapy (including protease inhibitors) (17). However, PCP still occurs, particularly among persons who were tested late for HIV or who failed to access care (18-21). In addition, the incidence of toxoplasmic encephalitis decreased, and the percentage of persons who had toxoplasmic encephalitis diagnosed during the course of AIDS decreased. These decreases are probably a result of PCP prophylaxis with TMP-SMZ, a medication that also prevents toxoplasmic encephalitis (22-24). The frequency at which toxoplasmosis occurred first has remained relatively stable over time. Reasons for this lack of decline may be similar to the reasons for the lack of decline in the frequency at which PCP occurred first (i.e., late HIV testing and failure to access care). Prophylaxis for toxoplasmic encephalitis was recommended in 1995 for adults and adolescents seropositive for Toxoplasma and with CD4+ T-lymphocyte counts less than 100 cells/uL (25). During 1992-1997, both the frequency at which MAC occurred first and the incidence of MAC decreased, but the percentage of persons who had MAC diagnosed during the course of AIDS remained stable. MAC prophylaxis and antiretroviral therapy probably have contributed to the decline in the incidence of MAC, but occurrence at low CD4+ T-lymphocyte counts (despite prescription of prophylaxis) and poor compliance with therapy may result in eventual development of MAC in some persons. MAC prophylaxis was first recommended in 1993 for adults and adolescents with CD4+ T-lymphocyte counts less than 75 cells/uL (26); the recommendations were updated in 1997 to limit use in adults and adolescents to those with CD4+ T-lymphocyte counts less than 50 cells/uL (27). The findings that the rates of esophageal candidiasis and chronic herpes simplex were higher for females than for males have been noted previously (28-31). Higher rates of esophageal candidiasis may occur in women because of vaginal colonization with Candida (29). Higher rates of herpes simplex may occur in women because the disease is more common in female IDUs than in male IDUs (32). Researchers have suggested that the exchange of sex or money for drugs may be more common among female than among male IDUs, resulting in a higher rate of sexually transmitted diseases (including herpes simplex virus infection) among women (33,34). In addition, rates of TB were higher for females than for males. Injecting-drug use has been associated with TB among persons with AIDS (35-37). Because a greater proportion of women than men are IDUs, women are more likely to have TB. However, among IDUs only, the rates of TB generally were higher for males than for females. Rates of KS, CMV disease, and CMV retinitis were higher for males than for females. These diseases are associated with sexual transmission, and a larger proportion of men than women have sexual HIV risks. However, the higher rate of CMV disease among female IDUs than male IDUs may be associated with the practice of exchange of sex for money or drugs. The findings in this report are subject to at least four limitations associated with the ASD data. First, ASD data may not be complete because illnesses in general are not always diagnosed and, even when diagnosed, are not always recorded in the medical chart. However, because AIDS-defining OIs are serious medical conditions, they usually are recorded in the chart. Second, because ASD does not represent the entire population of persons in the United States with HIV infection and AIDS, these findings may not be generalizable to the entire U.S. population. The frequency of some OIs (e.g., TB and coccidioidomycosis) varies by region. However, ASD has a large patient population enrolled from a diverse group of clinics and hospitals nationwide. Third, medications recorded in ASD are those prescribed any time during each 6-month data abstraction interval, regardless of the duration of treatment. The reasons for prescribing medications are not recorded, and adherence to therapy is not assessed. Fourth, ASD may exclude diagnoses that occur outside the enrolled hospitals and clinics. However, whenever possible, hospital and clinic staff attempt to obtain medical records from other facilities to help ensure optimal patient care. Many persons are enrolled in ASD when their first OI occurs, and they may not have medical care before their first major illness. As a result, preventable OIs occur in ASD patients at a higher frequency than in populations in which most patients obtain care early during the course of HIV disease. One previous study in ASD indicated that, for IDUs, incidences have not decreased as frequently or for as many OIs as for MSM (35). Persons at risk for HIV infection must receive HIV testing and access medical care before onset of advanced immunosuppression. This enables administration of chemoprophylaxis to prevent OIs, vaccinations to prevent illnesses (e.g., pneumococcal disease), and antiretroviral treatment to prevent progression and the serious manifestations of HIV-related disease. In addition, the progression of HIV infection to AIDS should be monitored. Antiretroviral drug resistance and poor adherence to medications can substantially increase the rate of disease progression. Surveillance for severe HIV-related illnesses will continue to be essential in determining how well HIV-related morbidity is being prevented. Acknowledgments The authors gratefully acknowledge the administrative assistance of Scott B. McCombs, MPH, and data management of Pei-Chun Wan, MS, with the Adult and Adolescent Spectrum of HIV Disease surveillance project. The Adult and Adolescent Spectrum of HIV Disease investigators are Melanie Thompson, MD, Julia Gable, MS, and William McCarthy, PhD, AIDS Research Consortium of Atlanta, Atlanta; Sylvia Odem, MPH, and Sharon Melville, MD, Texas Department of Health, Austin; Arthur Davidson, MD, David L. Cohn, MD, and Cornelius Rietmeijer, MD, Denver Department of Health and Hospitals, Denver; Linda L. Wotring, PhD, MPH, and Eve D. Mokotoff, MPH, Michigan Department of Community Health, Detroit; Wes McNeely, MS, and Kaye Reynolds, Houston Department of Health and Human Services, Houston; Frank Sorvillo, PhD, and Dorothy Masters, Los Angeles County Department of Health Services, Los Angeles; Susan Troxler, MPH, and Anne Morse, Louisiana Office of Public Health, New Orleans; Judy Sackoff, PhD, and Jeffrey McFarland, MD, The City of New York Department of Health, New York City; Jose Otero, MPH, Robert Hunter, MD, and Maria de los Angeles Gomez, PhD, University Central del Caribe, Bayamon, and Sandra Miranda, MPH, Puerto Rico Department of Health, San Juan; and Susan Buskin, PhD, and Sharon G. Hopkins, DVM, Seattle-King County Department of Public Health, Seattle. References
Table_1 Note: To print large tables and graphs users may have to change their printer settings to landscape and use a small font size.
TABLE 1. Percentage* of males with at least one acquired immunodeficiency
syndrome-defining opportunistic illness (OI) for whom a given OI occurred first, by
disease and human immunodeficiency virus (HIV) exposure mode+ --
Adult/Adolescent Spectrum of HIV Disease project,& 1992-1997
====================================================================================================
                                                                                   Males exposed
                                                                                   to HIV through
                                                Men who have     Injecting-drug     heterosexual
                                    Total       sex with men          users            contact
Disease                           (N=10,658)      (N=5,964)         (N=1,865)          (N=372)
-------------------------------------------------------------------------------------------------
Pneumocystis carinii
  pneumonia                          35.7            34.6              35.4              35.1
Kaposi sarcoma@                      12.5**          15.0               2.0**             3.7
Esophageal candidiasis               11.9++          11.0              15.5++            15.2
Wasting syndrome                      7.8             7.7              10.6               6.9
Mycobacterium avium
  complex                             6.4             6.6               6.2               9.5
Pulmonary tuberculosis@               4.8++           3.1              13.7**             8.1
Extrapulmonary
  cryptococcosis                      4.3**           4.0               4.4               4.6
HIV encephalopathy                    4.2             4.3               3.3               3.2
Cytomegalovirus retinitis@            3.8             4.4               1.6               1.6
Cytomegalovirus disease@              3.4**           4.1               0.9               0.7++
Toxoplasmosis of brain@               2.9             2.3               6.7**             5.1
Chronic cryptosporidiosis@            2.9             3.3               0.7               1.1
Recurrent pneumonia@                  2.3++           1.8               4.9++             5.0
Extrapulmonary tuberculosis@          2.0             1.6               4.6               4.6
Chronic herpes simplex@               2.0++           1.9               1.6++             2.9
Immunoblastic lymphoma                1.6             1.9               0.7               0.7
Progressive multifocal
  leukoencephalopathy                 1.1             1.2               0.8               0.9
Disseminated
  histoplasmosis@                     0.7             0.7               0.9               2.1
Burkitts lymphoma                     0.7             1.0               0.0               0.5
Other disseminated
  Mycobacterium                       0.6             0.6               0.8               0.3
Primary brain lymphoma                0.4             0.5               0.4               0.0
Pulmonary candidiasis                 0.3             0.2               0.8               0.3
Disseminated
  coccidioidomycosis@                 0.1             0.1               0.1               0.4
Recurrent Salmonella
  septicemia                          0.1             0.1               0.3               0.4
Chronic isosporiasis                  0.0             0.0               0.0               0.0
-------------------------------------------------------------------------------------------------
 * Data for each opportunistic illness are standardized to the sex- or risk-specific proportion
   of national acquired immunodeficiency syndrome surveillance cases by age, race, year of
   diagnosis, and country of birth. Data from all cities are weighted equally.
 + Data in this analysis are for the three largest single HIV exposure modes for males observed
   in the Adult/Adolescent Spectrum of HIV Disease project. Exposure mode-specific data are
   not presented for 2,457 males with other HIV exposure modes.
 & A CDC-sponsored surveillance project that collects data at selected sites in 11 U.S. cities.
 @ Differences by HIV exposure mode were significant using the stratified
   Cochran-Mantel-Haenszel (CMH) statistic (p<0.05).
** In a comparison of data in Tables 1 and 2, the difference by sex for this item was significant
   using the stratified CMH statistic; the percentage was higher for males (p<0.05).
++ In a comparison of data in Tables 1 and 2, the difference by sex for this item was significant
   using the stratified CMH statistic; the percentage was higher for females (p<0.05).
====================================================================================================
Return to top. Table_2 Note: To print large tables and graphs users may have to change their printer settings to landscape and use a small font size.
TABLE 2. Percentage* of females with at least one acquired immunodeficiency
syndrome-defining opportunistic illness (OI) for whom a given OI occurred first, by
disease and human immunodeficiency virus (HIV) exposure mode+ --
Adult/Adolescent Spectrum of HIV Disease project,& 1992-1997
===================================================================================================
                                                                      Females exposed
                                                                       to HIV through
                                                    Injecting-drug      heterosexual
                                       Total             users             contact
Disease                              (N=2,324)          (N=819)            (N=878)
-------------------------------------------------------------------------------------
Pneumocystis carinii
  pneumonia                             33.7              32.2               35.1
Esophageal candidiasis                  19.9@             19.8@              19.6
Wasting syndrome                         9.0               9.6                8.3
Recurrent pneumonia                      7.1@             10.2@               4.2
Mycobacterium avium  complex             6.8               5.1                8.2
Pulmonary tuberculosis                   6.6@              8.3**              5.3
Chronic herpes simplex                   4.1@              4.6@               3.8
Toxoplasmosis of brain++                 3.8               2.4**              5.6
Cytomegalovirus retinitis                3.4               2.9                3.8
HIV encephalopathy                       3.2               3.5                3.0
Extrapulmonary cryptococcosis            3.1**             3.2                3.0
Extrapulmonary tuberculosis              3.0               4.2                1.9
Cytomegalovirus disease                  2.1**             1.6                2.5@
Chronic cryptosporidiosis                1.5               0.9                2.0
Kaposi sarcoma                           1.3**             1.2**              1.3
Disseminated histoplasmosis              1.1               1.1                1.0
Invasive cervical cancer                 0.9               1.0                0.8
Progressive multifocal
  leukoencephalopathy                    0.9               1.0                0.7
Pulmonary candidiasis                    0.5               0.7                0.4
Other disseminated
  Mycobacterium                          0.4               0.3                0.4
Disseminated coccidioidomycosis          0.4               0.3                0.6
Primary brain lymphoma                   0.3               0.1                0.5
Immunoblastic lymphoma++                 0.1               0.1                0.1
Chronic isosporiasis                     0.0               0.0                0.0
Burkitts lymphoma                        0.0               0.0                0.0
Recurrent Salmonella septicemia          0.0               0.0                0.0
-------------------------------------------------------------------------------------
 * Data for each opportunistic illness is standardized to the sex- or risk-specific proportion of
   national acquired immunodeficiency syndrome surveillance cases by age, race, year of
   diagnosis, and country of birth. Data from all cities are weighted equally.
 + Data in this analysis are for the two largest HIV exposure modes for females observed in
   the Adult/Adolescent Spectrum of HIV Disease project. Exposure mode-specific data are not
   presented for 627 females with other HIV exposure modes.
 & A CDC-sponsored surveillance project that collects data at selected sites in 11 U.S. cities.
 @ In a comparison of data in Tables 1 and 2, the difference by sex for this item was significant
   using the stratified Cochran-Mantel-Haenszel (CMH) statistic; the percentage was higher for
   females (p<0.05).
** In a comparison of data in Tables 1 and 2, the difference by sex for this item was significant
   using the stratified CMH statistic; the percentage was higher for males (p<0.05).
++ Differences by HIV exposure mode were significant using the stratified CMH statistic
   (p<0.05).
===================================================================================================
Return to top. Table_3 Note: To print large tables and graphs users may have to change their printer settings to landscape and use a small font size.
TABLE 3. Percentage* of persons with at least one acquired immunodeficiency syndrome-defining opportunistic illness (OI)
for whom a given OI occurred first, by disease and year of diagnosis -- Adult/Adolescent Spectrum of HIV Disease project,+
1992-1997
===========================================================================================================================================
                                    Total        1992       1993       1994       1995       1996      1997
Disease                           (N=12,982)  (N=3,023)  (N=2,804)  (N=2,648)  (N=2,107)  (N=1,602)  (N=798)  Trend&
------------------------------------------------------------------------------------------------------------------------
Pneumocystis carinii
  pneumonia                          35.9        36.6       35.0       34.7       34.7       38.1      42.6   none
Esophageal candidiasis               12.4        11.5       11.4       11.2       14.1       14.8      15.0   increasing
Kaposi sarcoma                       11.6        11.1       12.0       11.6       13.2        9.5      10.7   none
Wasting syndrome                      7.8        10.5        6.1        5.8        7.2        8.4      12.2   increasing
Mycobacterium avium  complex          6.4         5.7        5.7        8.2        7.2        5.6       4.8   decreasing
Pulmonary tuberculosis                5.0         6.4        5.9        5.2        3.7        2.6       3.6   decreasing
Extrapulmonary cryptococcosis         4.3         4.0        5.0        3.8        4.6        4.3       3.8   none
HIV encephalopathy                    4.2         3.8        4.7        4.1        3.5        5.1       3.6   none
Cytomegalovirus retinitis             3.7         3.4        3.8        4.3        3.5        4.0       2.6   none
Cytomegalovirus disease               3.2         3.7        2.7        3.1        4.0        3.3       1.1   none
Toxoplasmosis of brain                3.0         2.9        3.0        3.0        3.1        3.3       2.6   none
Chronic cryptosporidiosis             2.7         1.8        3.2        3.2        3.1        2.8       1.5   none
Recurrent pneumonia                   2.5         2.1        2.7        2.5        2.5        2.8       3.0   none
Extrapulmonary tuberculosis           2.1         2.6        2.4        2.0        1.8        1.2       0.9   decreasing
Chronic herpes simplex                2.1         2.4        3.1        1.7        1.8        1.3       0.5   decreasing
Immunoblastic lymphoma                1.5         1.2        1.4        2.3        0.8        2.1       1.9   increasing
Progressive multifocal
  leukoencephalopathy                 1.0         0.5        0.7        1.5        1.3        1.6       0.7   increasing
Invasive cervical cancer@             0.9         1.1        0.5        1.5        1.1        0.1       0.9   none
Disseminated histoplasmosis           0.7         0.9        0.7        0.7        0.7        0.3       1.0   none
Burkitts lymphoma                     0.7         0.6        0.7        0.7        0.4        0.9       1.5   none
Other disseminated
  Mycobacterium                       0.6         1.2        0.6        0.4        0.3        0.5       0.4   decreasing
Primary brain lymphoma                0.4         0.6        0.3        0.6        0.3        0.3       0.1   none
Pulmonary candidiasis                 0.3         0.2        0.6        0.4        0.2        0.2       0.2   none
Disseminated coccidioidomycosis       0.1         0.0        0.1        0.0        0.0        0.4       0.7   increasing
Recurrent Salmonella  septicemia      0.1         0.1        0.1        0.1        0.0        0.2       0.0   none
Chronic isosporiasis                  0.0         0.0        0.1        0.0        0.0        0.0       0.1   none
------------------------------------------------------------------------------------------------------------------------
* Data for each opportunistic illness are standardized to national acquired immunodeficiency syndrome surveillance cases by age, race,
  country of birth, sex, and human immunodeficiency virus (HIV) exposure mode. Data from all cities are weighted equally.
+ A CDC-sponsored surveillance project that collects data at selected sites in 11 U.S. cities.
& The direction of change is given for trends that were significant (p< 0.05) based on the stratified (HIV exposure mode, race, sex, age,
  metropolitan area, and country of birth) Cochran-Mantel-Haenszel statistic.
@ Restricted to women.
===========================================================================================================================================
Return to top. Table_4 Note: To print large tables and graphs users may have to change their printer settings to landscape and use a small font size.
TABLE 4. Incidence* of acquired immunodeficiency syndrome-defining opportunistic
illnesses (OIs) among males, by disease and human immunodeficiency virus (HIV)
exposure mode+ -- Adult/Adolescent Spectrum of HIV Disease project,& 1992-1997,
====================================================================================================
                                                                                    Males exposed
                                                                                   to HIV through
                                                Men who have     Injecting-drug     heterosexual
                                    Total       sex with men          users            contact
Disease                          (N=17,404)      (N=10,180)         (N=2,762)          (N=534)
-------------------------------------------------------------------------------------------------
Any OI                              277.0           281.2             271.6             284.6
Pneumocystis carinii
  pneumonia@                         87.8            86.2              97.2              81.0
Mycobacterium avium
  complex@                           77.9            81.4              54.7              70.3
Esophageal candidiasis               57.6            54.6              76.3              65.8
Cytomegalovirus retinitis@           53.9            61.7              18.7              33.9
Kaposi sarcoma@                      48.7**          56.6              10.4**            14.3
Wasting syndrome                     50.6            52.2              53.9              52.7
HIV encephalopathy                   35.0            35.4              22.4              32.9
Cytomegalovirus disease@             34.2**          40.0               7.8++            10.3++
Recurrent pneumonia@                 19.5            18.1              30.3              31.8
Extrapulmonary
  cryptococcosis                     16.2**          15.3              16.8**            19.3
Chronic cryptosporidiosis@           14.7            16.7               4.9              12.3
Toxoplasmosis of brain@              13.7            12.7              21.5              24.8
Pulmonary tuberculosis@              10.5++           8.4              24.7              15.2**
Chronic herpes simplex@               9.8++           9.1               8.0++            11.1
Progressive multifocal
  leukoencephalopathy                 9.2            10.0               7.2               2.7
Extrapulmonary tuberculosis@          7.5++           6.5              14.3**            13.7
Immunoblastic lymphoma                7.1             7.9               4.4**             0.7
Other disseminated
  Mycobacterium                       6.7             7.3               5.9               5.0
Primary brain lymphoma                5.5             5.9               2.2               2.2
Disseminated histoplasmosis           3.5             3.5               3.5              10.9
Pulmonary candidiasis                 2.2             2.5               2.2               2.7
Burkitts lymphoma                     1.4             1.7               0.1               0.0
Disseminated
  coccidioidomycosis@                 0.5             0.4               0.1               1.8**
Chronic isosporiasis@                 0.2             0.1               0.0               0.1
Recurrent Salmonella
  septicemia                          0.2             0.3               0.1               0.0
-------------------------------------------------------------------------------------------------
 * Per 1,000 person-years standardized to the sex- or risk-specific proportion of national
   acquired immunodeficiency syndrome surveillance cases by age, race, year of diagnosis,
   country of birth, and CD4+ T-lymphocyte distribution. Data from all cities are weighted
   equally.
 + Data in this analysis are for the three largest single HIV exposure modes for males observed
   in the Adult/Adolescent Spectrum of HIV Disease project. Exposure mode-specific data are
   not presented for 3,928 males with other HIV exposure modes.
 & A CDC-sponsored surveillance project that collects data at selected sites in 11 U.S. cities.
 @ Differences by HIV exposure mode were significant using the stratified
   Cochran-Mantel-Haenszel (CMH) statistic (p<0.05).
** In a comparison of data in Tables 4 and 5, the difference by sex for this item was significant
   using the stratified CMH statistic; the incidence rate was higher for males (p<0.05).
 ++ In a comparison of data in Tables 4 and 5, the difference by sex for this item was significant
   using the stratified CMH statistic; the incidence rate was higher for females (p<0.05).
====================================================================================================
Return to top. Table_5 Note: To print large tables and graphs users may have to change their printer settings to landscape and use a small font size.
TABLE 5. Incidence* of acquired immunodeficiency syndrome-defining opportunistic
illnesses among females, by disease and human immunodeficiency (HIV) exposure
mode+ -- Adult/Adolescent Spectrum of HIV Disease project,& 1992-1997
===================================================================================================
                                                                         Females exposed
                                                                          to HIV through
                                                                           heterosexual
                                    Total           Injecting-drug users      contact
Disease                           (N=5,154)               (N=1,673)          (N=1,927)
----------------------------------------------------------------------------------------
Any OI@                             249.5                   266.6              231.7
Pneumocystis carinii
  pneumonia                          85.9                    89.8               82.2
Esophageal candidiasis@              70.4                    76.4               65.6
Mycobacterium avium  complex         55.9                    54.7               55.9
Wasting syndrome                     50.4                    53.5               47.7
Recurrent pneumonia                  34.2                    40.0               28.1
Cytomegalovirus retinitis@           27.2                    21.1               32.5
HIV encephalopathy                   25.7                    21.8               28.3
Pulmonary tuberculosis               17.7**                  22.9               13.7++
Chronic herpes simplex               17.7**                  11.1**             17.9
Cytomegalovirus disease              16.4++                  16.4**             16.3**
Extrapulmonary cryptococcosis        12.7++                  13.1++             13.0
Toxoplasmosis of brain               11.6                     9.2               14.6
Extrapulmonary tuberculosis           8.2**                   7.6++              8.7
Chronic cryptosporidiosis             8.1                     7.4                8.5
Other disseminated
  Mycobacterium                       6.9                     7.8                6.1
Kaposi sarcoma                        5.2++                   4.8++              5.3
Progressive multifocal
  leukoencephalopathy                 5.3                     7.1                3.4
Invasive cervical cancer              2.8                     3.4                2.1
Disseminated histoplasmosis           2.5                     2.7                2.5
Pulmonary candidiasis                 1.6                     2.3                1.0
Primary brain lymphoma                1.3                     1.0                1.4
Disseminated
  coccidioidomycosis                  1.2                     1.9                0.4++
Immunoblastic lymphoma                1.1                     0.2++              1.9
Recurrent Salmonella
  septicemia                          0.2                     0.1                0.2
Burkitts lymphoma                     0.1                     0.1                0.1
Chronic isosporiasis                  0.0                     0.0                0.1
----------------------------------------------------------------------------------------
 * Per 1,000 person-years standardized to the sex- or risk-specific proportion of national
   acquired immunodeficiency syndrome surveillance cases by age, race, year of diagnosis,
   country of birth, and CD4+ T-lymphocyte distribution. Data from all cities are weighted
   equally.
 + Data in this analysis are for the two largest HIV exposure modes for females observed in
   the Adult/Adolescent Spectrum of HIV Disease project. Exposure mode-specific data are not
   presented for 1,554 females with other HIV exposure modes.
 & A CDC-sponsored surveillance project that collects data at selected sites in 11 U.S. cities.
 @ Differences by HIV exposure mode were significant using the stratified
   Cochran-Mantel-Haenszel (CMH) statistic (p<0.05).
** In a comparison of data in Tables 4 and 5, the difference by sex for this item was significant
   using the stratified CMH statistic; the incidence rate was higher for females (p<0.05).
++ In a comparison of data in Tables 4 and 5, the difference by sex for this item was significant
   using the stratified CMH statistic; the incidence rate was higher for males (p<0.05).
===================================================================================================
Return to top. Table_6 Note: To print large tables and graphs users may have to change their printer settings to landscape and use a small font size.
TABLE 6. Incidence* of acquired immunodeficiency syndrome-defining opportunistic illnesses, by disease and year of
diagnosis -- Adult/Adolescent Spectrum of HIV Disease project,+  1992-1997
=========================================================================================================================================
                                       Overall         1992         1993         1994        1995        1996        1997
Disease                               (N&=22,558)  (N=10,227)   (N=11,261)   (N=10,843)   (N=9,511)   (N=8,046)   (N=5,641)  Trend@
---------------------------------------------------------------------------------------------------------------------------------------
Any OI                                   273.9        327.2        277.8        304.7       269.2       215.0       147.7    decreasing
Pneumocystis carinii  pneumonia           87.9        108.3         91.9         87.6        94.1        66.7        45.5    decreasing
Mycobacterium avium  complex              76.6        101.4         85.1         78.6        73.0        59.7        15.6    decreasing
Esophageal candidiasis                    58.7         61.2         58.3         59.7        60.2        64.6        32.3    none
Cytomegalovirus retinitis                 51.2         66.2         58.0         54.1        48.4        35.2        17.4    decreasing
Wasting syndrome                          50.0         65.5         51.3         44.1        52.2        40.5        32.0    decreasing
Kaposi sarcoma                            45.0         60.6         42.6         50.9        44.4        30.7        19.7    decreasing
HIV encephalopathy                        34.8         39.6         38.0         35.4        36.7        27.4        18.6    decreasing
Cytomegalovirus disease                   32.3         45.3         29.3         33.6        33.8        23.5        12.8    decreasing
Recurrent pneumonia                       20.2         22.0         19.1         25.6        19.3        16.7        10.7    none
Extrapulmonary cryptococcosis             16.3         18.4         17.2         16.4        14.6        16.9        10.4    decreasing
Chronic cryptosporidiosis                 14.1         16.4         15.1         17.9        11.4        12.0         3.7    decreasing
Toxoplasmosis of brain                    13.7         20.7         15.2         14.7        10.2         8.2         7.0    decreasing
Pulmonary tuberculosis                    11.1         16.2         12.1         11.1         9.3         4.3        11.0    decreasing
Chronic herpes simplex                    10.3         17.5         12.0          9.8         7.6         5.0         2.8    decreasing
Progressive multifocal
 leukoencephalopathy                       8.9          9.7          8.2          8.8        10.9         9.5         2.7    none
Extrapulmonary tuberculosis                7.7         11.7          9.5          7.2         6.5         4.5         1.8    decreasing
Immunoblastic lymphoma                     6.7          6.2          7.9          6.8         6.4         6.7         4.7    none
Other disseminated Mycobacterium           6.6         11.2          8.9          4.5         5.2         3.9         2.0    decreasing
Primary brain lymphoma                     5.2          6.6          4.5          8.0         4.2         3.5         1.1    none
Disseminated histoplasmosis                3.5          5.0          2.8          4.5         2.1         3.5         1.8    none
Invasive cervical cancer**                 3.0          0.0          1.8          9.0         0.5         2.5         2.6    none
Pulmonary candidiasis                      2.0          3.5          1.9          2.3         2.0         0.4         0.2    decreasing
Burkitts lymphoma                          1.3          0.5          2.7          1.2         1.1         0.3         2.3    none
Disseminated coccidioidomycosis            0.5          0.8          0.2          0.4         0.0         0.6         1.8    none
Chronic isosporiasis                       0.2          0.1          0.4          0.0         0.2         0.2         0.0    none
Recurrent Salmonella  septicemia           0.2          0.0          0.4          0.4         0.2         0.1         0.0    none
---------------------------------------------------------------------------------------------------------------------------------------
* Per 1,000 person-years standardized to national acquired immunodeficiency syndrome surveillance cases by age, race, country of
  birth, sex, human immunodeficiency virus (HIV) exposure mode, and CD4+ T-lymphocyte distribution. Data from all cities are weighted
  equally.
+ A CDC-sponsored surveillance project that collects data at selected sites in 11 U.S. cities.
& N=number of persons at risk for any AIDS-defining OI; number of persons varies for each disease.
@ The direction of change is given for trends that were significant (p< 0.05) based on the stratified (CD4+ T-lymphocyte count, HIV
  exposure mode, race, sex, age, metropolitan area, and country of birth) Cochran-Mantel-Haenszel statistic.
=========================================================================================================================================
Return to top. Table_7 Note: To print large tables and graphs users may have to change their printer settings to landscape and use a small font size.
TABLE 7. Percentage* of persons with specific opportunistic illnesses during the course of acquired immunodeficiency syndrome for male decedents,
by disease and human immunodeficiency virus (HIV) exposure mode+ -- Adult/Adolescent Spectrum of HIV Disease project,& 1992-1997
===================================================================================================================================================
                                                                                                                      Males exposed to HIV
                                                                Men who have sex with     Injecting-drug users     through heterosexual
Disease                                      Total (N=8,811)        men (N=5,168)               (N=1,520)            contact (N=243)
---------------------------------------------------------------------------------------------------------------------------------------------------
Pneumocystis carinii  pneumonia                   52.8                  52.1                      52.9                     45.0
Mycobacterium avium  complex@                     30.2                  31.7                      19.2                     22.7
Esophageal candidiasis                            24.1**                23.5                      28.1**                   24.4
Kaposi sarcoma@                                   23.8++                27.4                      54.1++                    5.4
Cytomegalovirus retinitis@                        21.3++                24.2                       6.7                     11.9
Wasting syndrome                                  20.8                  20.9                      22.8                     19.6
HIV encephalopathy@                               11.6                  13.8                       9.2                     13.1
Cytomegalovirus disease@                          13.4++                15.4                       3.0**                  2.5**
Extrapulmonary cryptococcosis@                    58.1++                 7.6                       9.0                    13.9++
Recurrent pneumonia                                7.2                   6.9                       9.0                     13.0
Toxoplasmosis of brain@                           57.1++                 6.8                      10.6++                   13.0
Pulmonary tuberculosis@                           56.4**                 4.8                      18.5++                  13.5++
Chronic cryptosporidiosis@                         6.0                   6.6                       2.3**                    4.7
Chronic herpes simplex                            54.7**                 4.6                       4.0**                    5.1
Extrapulmonary tuberculosis@                       4.0                   3.2                       9.0                      5.3
Other disseminated Mycobacterium                   3.3                   3.6                       2.4                      1.5
Immunoblastic lymphoma                             3.1                   3.4                       1.5++                    1.3
Progressive multifocal leukoencephalopathy         2.7                   2.9                       2.2                      2.0
Primary brain lymphoma                             2.2                   2.4                       1.0                      1.0
Disseminated histoplasmosis                        1.6                   1.6                       1.8                      1.9
Pulmonary candidiasis                              1.0                   1.1                       1.0                      0.7
Burkitts lymphoma                                  0.9                   1.1                       0.1                      0.4
Disseminated coccidioidomycosis                    0.2                   0.2                       0.0                      0.4
Recurrent Salmonella  septicemia@                  0.2                   0.2                       0.4                      1.1
Chronic isosporiasis                               0.1                   0.1                       0.0                      0.0
---------------------------------------------------------------------------------------------------------------------------------------------------
*  The numerator is the number of persons who ever had a specific opportunistic illness (OI);
   the denomi nator is the number of persons who died with one or more acquired
   immunodeficiency syndrome (AIDS)-defining OIs during 1992-1997. These data are
   standardized to the sex- or risk-specific proportion of national AIDS deaths by age, race,
   year of death, and country of birth. Data for all cities are weighted equally.
+  Data in this analysis are for the three largest single HIV exposure modes for males observed
   in the Adult/Adolescent Spectrum of HIV Disease project. Exposure mode-specific data are
   not presented for 1,880 males with other HIV exposure modes.
&  A CDC-sponsored surveillance project that collects data at selected sites in 11 U.S. cities.
@  Di f ferences by HI V exposur e mode were si gnif i cant usi ng the st rat i f i ed
   Cochran-Mantel-Haenszel (CMH) statistic (p<0.05).
** In a comparison of data in Tables 7 and 8, the difference by sex for this item was significant
   using the stratified CMH statistic; the percentage was higher for females (p<0.05).
++ In a comparison of data in Tables 7 and 8, the difference by sex for this item was significant
   using the stratified CMH statistic; the percentage was higher for males (p<0.05).
===================================================================================================================================================
Return to top. Table_8 Note: To print large tables and graphs users may have to change their printer settings to landscape and use a small font size.
TABLE 8. Percentage* of persons with specific opportunistic illnesses during the course of acquired immunodeficiency syndrome for female decedents, by
disease and human immunodeficiency virus (HIV) exposure mode+ -- Adult/Adolescent Spectrum of HIV Disease project,& 1992-1997
=========================================================================================================================================================
                                                                                               Females exposed to HIV through
Disease                                     Total (N=1,542)   Injecting-drug users (N=608)       heterosexual contact (N=571)
---------------------------------------------------------------------------------------------------------------------------------------------------------
Pneumocystis carinii  pneumonia                   52.2                    52.8                              51.1
Esophageal candidiasis                            34.2@                   34.8@                             33.3
Mycobacterium avium  complex                      26.2                    24.1                              27.7
Wasting syndrome                                  24.3                    23.6                              25.5
Recurrent pneumonia                               12.7@                   13.6@                             11.5
Pulmonary tuberculosis**                          11.8@                   14.4++                             8.4++
HIV encephalopathy                                11.6                    10.4                              13.1
Cytomegalovirus retinitis**                       11.2++                   9.2                              14.1
Cytomegalovirus disease                            8.1++                   8.5@                              7.6@
Chronic herpes simplex                             8.0@                    8.5@                              7.7
Toxoplasmosis of brain                             6.9++                   5.4++                             9.2
Extrapulmonary tuberculosis                        6.6                     8.0                               4.7
Extrapulmonary cryptococcosis                      5.9++                   6.9                               4.9++
Chronic cryptosporidiosis                          4.5                     4.0@                              5.0
Other disseminated Mycobacterium                   3.2                     3.3                               3.0
Progressive multifocal leukoencephalopathy         2.6                     2.9                               2.0
Kaposi sarcoma                                     2.3++                   2.3++                             2.6
Disseminated histoplasmosis                        2.0                     2.1                               1.7
Invasive cervical cancer                           1.9                     2.5                               1.0
Pulmonary candidiasis                              1.0                     1.2                               0.8
Primary brain lymphoma                             0.9                     0.3                               1.6
Immunoblastic lymphoma                             0.5                     0.1++                             0.9
Recurrent Salmonella  septicemia                   0.3                     0.3                               0.2
Disseminated coccidioidomycosis                    0.2                     0.1                               0.2
Burkitts lymphoma                                  0.0                     0.0                               0.1
Chronic isosporiasis                               0.0                     0.0                               0.1
---------------------------------------------------------------------------------------------------------------------------------------------------------
*  The numerator is the number of persons who ever had a specific opportunistic illness (OI);
   the denomi nator is the number of persons who died with one or more acquired
   immunodeficiency syndrome (AIDS)-defining OIs during 1992-1997. These data are
   standardized to the sex- or risk-specific proportion of national AIDS deaths by age, race,
   year of death, and country of birth. Data for all cities are weighted equally.
+  Data in this analysis are for the two largest HIV exposure modes for females observed in
   the Adult/Adolescent Spectrum of HIV Disease project. Exposure mode-specific data are not
   presented for 363 females with other HIV exposure modes.
&  A CDC-sponsored surveillance project that collects data at selected sites in 11 U.S. cities.
@  In a comparison of data in Tables 7 and 8, the difference by sex for this item was significant
   using the stratified Cochran-Mantel-Haenszel (CMH) statistic; the percentage was higher for
   females (p<0.05).
** Differences by HIV exposure mode were significant using the stratified CMH statistic
   (p<0.05).
++ In a comparison of data in Tables 7 and 8, the difference by sex for this item was significant
   using the stratified CMH statistic; the percentage was higher for males (p<0.05).
=========================================================================================================================================================
Return to top. Table_9 Note: To print large tables and graphs users may have to change their printer settings to landscape and use a small font size. TABLE 9. Percentage* of persons with specific opportunistic illnesses during the course of acquired immunodeficiency syndrome for decedents, by disease and year of death -- Adult/Adolescent Spectrum of HIV Disease project,+ 1992-1997 =================================================================================================================================================================================== Disease Total (N=10,353) 1992 (N=2,045) 1993 (N=2,256) 1994 (N=2,197) 1995 (N=1,959) 1996 (N=1,291) 1997 (N=605) Trend& ----------------------------------------------------------------------------------------------------------------------------------------------------------------------------------- Pneumocystis carinii pneumonia 53.0 57.9 55.6 51.7 47.2 52.6 43.4 decreasing Mycobacterium avium complex 30.0 31.9 29.6 28.3 30.9 30.3 23.1 none Esophageal candidiasis 24.4 24.6 24.5 21.5 25.8 26.9 30.1 none Kaposi sarcoma 22.6 25.0 24.9 22.2 19.6 19.1 20.5 none Wasting syndrome 20.8 22.9 21.5 17.8 20.7 20.7 27.5 increasing Cytomegalovirus retinitis 20.6 21.3 21.2 20.3 20.2 19.7 18.9 none HIV encephalopathy 13.5 14.1 12.1 15.1 14.0 11.3 11.4 none Cytomegalovirus disease 12.9 15.7 12.6 10.7 13.0 12.9 12.9 none Extrapulmonary cryptococcosis 8.1 8.4 9.0 6.6 8.3 8.7 9.1 none Recurrent pneumonia 7.4 5.7 6.9 8.7 8.5 6.9 8.0 increasing Toxoplasmosis of brain 7.2 9.3 7.3 7.1 5.8 5.7 5.7 decreasing Pulmonary tuberculosis 6.8 5.2 5.8 8.4 7.7 6.7 7.3 increasing Chronic cryptosporidiosis 5.9 5.9 5.3 6.0 6.6 5.8 5.8 none Chronic herpes simplex 4.9 4.6 5.2 5.0 4.7 4.7 3.5 none Extrapulmonary tuberculosis 4.1 4.2 4.4 4.2 4.4 3.0 1.6 decreasing Other disseminated Mycobacterium 3.3 3.9 4.3 3.0 2.2 2.6 1.8 decreasing Immunoblastic lymphoma 3.0 3.1 3.0 2.4 3.2 2.8 6.0 none Progressive multifocal leukoencephalopathy 2.7 2.6 2.3 2.7 2.9 3.1 1.8 none Primary brain lymphoma 2.1 1.9 1.8 2.3 2.5 1.8 1.7 none Invasive cervical cancer@ 2.0 2.0 1.0 2.5 1.9 2.9 1.6 none Disseminated histoplasmosis 1.6 2.3 1.9 1.3 1.4 1.1 1.7 none Pulmonary candidiasis 1.0 1.1 0.9 1.1 1.1 0.4 0.1 decreasing Burkitts lymphoma 0.9 0.6 1.2 1.0 0.5 1.0 0.7 none Disseminated coccidioidomycosis 0.2 0.1 0.2 0.2 0.1 0.3 0.1 none Recurrent Salmonella septicemia 0.2 0.3 0.4 0.1 0.1 0.1 0.0 none Chronic isosporiasis 0.1 0.1 0.1 0.1 0.1 0.1 0.0 none ----------------------------------------------------------------------------------------------------------------------------------------------------------------------------------- * The numerator is the number of persons who ever had a given opportunistic illness (OI); the denominator is the number of persons who died with one or more acquired immunodeficiency syndrome (AIDS)- defining OIs during 1992- 1997. These data are standardized to national AIDS deaths by age, race, country of birth, sex, and human immunodeficiency virus (HIV) exposure mode. Data for all cities are weighted equally. + A CDC- sponsored surveillance project that collects data at selected sites in 11 U. S. cities. & The direction of change is given for trends that were significant (p< 0.05) based on the stratified (HIV exposure mode, race, sex, age, metropolitan area, and country of birth) Cochran- Mantel- Haenszel statistic. @ Restricted to women. =================================================================================================================================================================================== Return to top. Figure_1 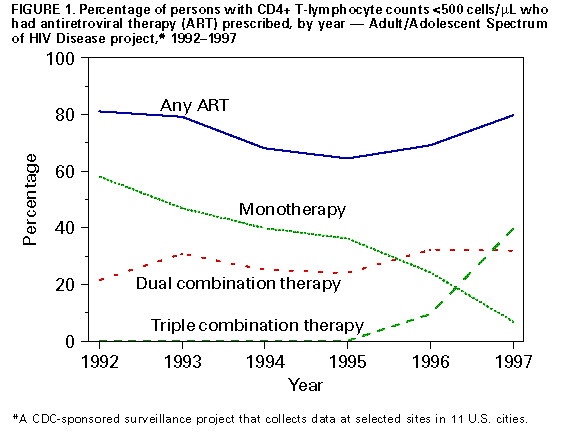 Return to top. Figure_2 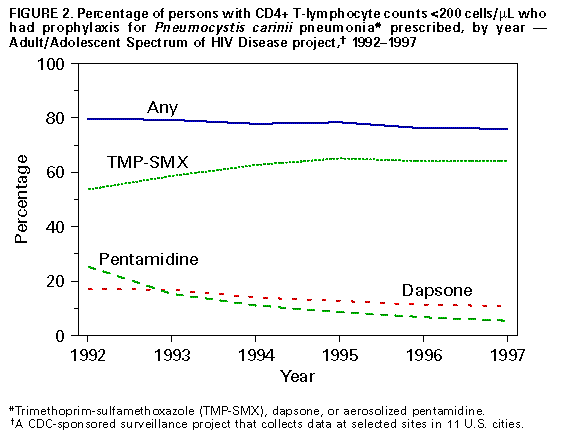 Return to top. Figure_3 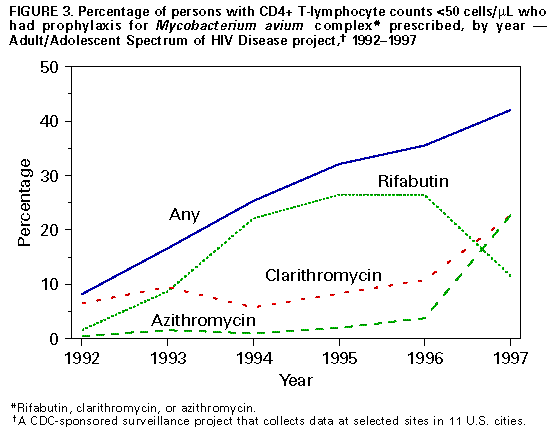 Return to top. Disclaimer All MMWR HTML versions of articles are electronic conversions from ASCII text into HTML. This conversion may have resulted in character translation or format errors in the HTML version. Users should not rely on this HTML document, but are referred to the electronic PDF version and/or the original MMWR paper copy for the official text, figures, and tables. An original paper copy of this issue can be obtained from the Superintendent of Documents, U.S. Government Printing Office (GPO), Washington, DC 20402-9371; telephone: (202) 512-1800. Contact GPO for current prices. **Questions or messages regarding errors in formatting should be addressed to mmwrq@cdc.gov.Page converted: 04/15/99 |
|||||||||
This page last reviewed 5/2/01
|