 |
|
|
|
|
|
|
| ||||||||||
|
|
|
|
|
|
|
||||
| ||||||||||
|
|
|
|
|
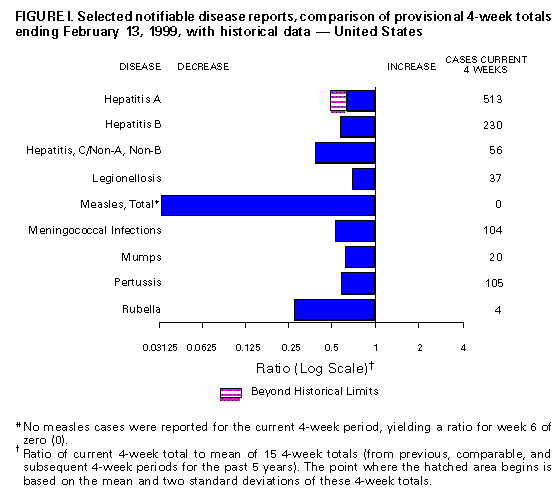
Persons using assistive technology might not be able to fully access information in this file. For assistance, please send e-mail to: mmwrq@cdc.gov. Type 508 Accommodation and the title of the report in the subject line of e-mail. Notifiable Diseases/Deaths in Selected Cities Weekly InformationFigure_I Selected notifiable disease reports, comparison of provisional 4-week totals ending February 13, 1999, with historical data -- United States Table_I Summary -- provisional cases of selected notifiable diseases, United States, cumulative, week ending February 13, 1999 (6th Week) Table_II Provisional cases of selected notifiable diseases, United States, weeks ending February 13, 1999 and February 14, 1998 (6th Week) Table_III Provisional cases of selected notifiable diseases preventable by vaccination, United States, weeks ending February 13, 1999 and February 14, 1998 (6th Week) Table_IV Deaths in 122 U.S. cities, week ending February
13, 1999 (6th Week)
TABLE I. Summary -- provisional cases of specified notifiable diseases, United
States, cumulative, week ending February 13, 1999 (6th Week)
==================================================================================
                                             Cum. 1999
------------------------------------------------------
Anthrax                                              -
Brucellosis                                          4
Cholera                                              1
Congenital rubella syndrome                          -
Cryptosporidiosis*                                  71
Diphtheria                                           -
Encephalitis:  California*                           1
               eastern equine*                       -
               St. Louis*                            -
               western equine*                       -
Hansen Disease                                       4
Hantavirus pulmonary syndrome*+                      1
Hemolytic uremic syndrome, post-diarrheal*           5
HIV infection, pediatric*&                           7
Plague                                               -
Poliomyelitis, paralytic                             -
Psittacosis                                          2
Rabies, human                                        -
Rocky Mountain spotted fever (RMSF)                 18
Streptococcal disease, invasive Group A            114
Streptococcal toxic-shock syndrome*                  3
Syphilis, congenital@                                -
Tetanus                                              1
Toxic-shock syndrome                                 7
Trichinosis                                          2
Typhoid fever                                       18
Yellow fever                                         -
------------------------------------------------------
-: no reported cases
 * Not notifiable in all states
 + Updated weekly from reports to the Division of Viral and Rickettsial
   Diseases, National Center for Infectious Diseases (NCID).
 & Updated monthly from reports to the Division of HIV/AIDS Prevention --
   Surveillance and Epidemiology, National Center for HIV, STD, and TB
   Prevention (NCHSTP), last update January 24, 1999.
 @ Updated from reports to the Division of STD Prevention, NCHSTP.

==================================================================================
TABLE II. (page 1) Provisional cases of selected notifiable diseases, United States, weeks ending
February 13, 1999, and February 14, 1998 (6th Week)
Escherichia
coli O157:H7
------------------- Hepatitis
AIDS Chlamydia NETSS** PHLIS*** Gonorrhea C/NA,NB
----------------- -------------------- -------- -------- ------------------- ----------------
Cum. Cum. Cum. Cum. Cum. Cum. Cum. Cum. Cum. Cum.
Reporting Area 1999* 1998 1999 1998 1999 1999 1999 1998 1999 1998
------------------------------------------------------------------------------------------------------------------------------
UNITED STATES 3,137 3,128 46,584 62,805 119 37 28,036 38,958 206 330
NEW ENGLAND 158 64 1,434 2,435 19 11 414 739 37 10
Maine 3 2 57 114 1 - 7 6 - -
N.H. 3 - 96 110 1 - 5 16 - -
Vt. - 5 27 32 - - 5 1 - 2
Mass. 124 6 987 1,025 11 7 318 265 37 8
R.I. 9 13 258 290 - - 77 43 - -
Conn. 19 38 9 864 6 4 2 408 - -
MID. ATLANTIC 489 893 7,188 9,410 6 - 3,556 5,561 3 22
Upstate N.Y. 17 114 N N 4 - 139 682 3 20
N.Y. City 237 488 4,352 4,059 - - 2,048 1,979 - -
N.J. 162 131 398 1,325 2 - 172 836 - -
Pa. 73 160 2,438 4,026 N - 1,197 2,064 - 2
E.N. CENTRAL 179 202 7,394 9,946 27 4 5,470 8,082 58 59
Ohio 38 33 2,644 3,563 17 3 1,647 2,121 - 3
Ind. 25 38 - - 5 - 691 726 - 1
Ill. 77 101 2,395 2,409 1 - 1,484 2,288 - 9
Mich. 22 15 1,997 2,391 4 - 1,495 2,304 58 46
Wis. 17 15 358 1,583 N 1 153 643 - -
W.N. CENTRAL 110 57 1,516 3,977 24 9 534 1,474 - 52
Minn. 20 15 506 814 8 8 201 300 - -
Iowa 3 6 84 334 5 1 24 90 - 1
Mo. 72 19 - 1,344 1 - - 531 - 50
N. Dak. - - - 113 2 - - 11 - -
S. Dak. - 4 206 199 - - 21 27 - -
Nebr. 6 9 259 370 2 - 117 145 - -
Kans. 9 4 461 803 6 - 171 370 - 1
S. ATLANTIC 883 773 13,125 11,035 13 5 9,938 9,549 21 10
Del. 13 13 316 228 - - 187 175 - -
Md. 81 52 965 802 1 - 951 943 15 2
D.C. 8 84 N N - - 354 405 - -
Va. 54 38 1,766 1,433 5 - 1,503 908 2 1
W. Va. 10 5 278 363 - 1 69 107 - -
N.C. 69 45 2,500 2,021 2 2 2,337 1,773 - 4
S.C. 60 59 3,427 2,065 1 1 1,864 1,472 1 -
Ga. 111 113 813 2,187 1 - 282 2,064 - -
Fla. 477 364 3,060 1,936 4 1 2,391 1,702 3 3
E.S. CENTRAL 157 156 4,058 4,453 7 - 3,718 4,628 15 14
Ky. 15 19 - 664 - - - 451 - 4
Tenn. 64 52 1,604 1,529 5 - 1,345 1,450 14 9
Ala. 31 56 1,365 1,131 2 - 1,343 1,597 1 1
Miss. 47 29 1,089 1,129 - - 1,030 1,130 - -
W.S. CENTRAL 532 379 3,781 8,668 2 - 2,759 5,604 7 8
Ark. 19 17 521 332 - - 253 525 - -
La. 27 66 2,158 1,392 1 - 1,904 1,154 6 -
Okla. 6 14 1,102 855 - - 602 497 - -
Tex. 480 282 - 6,089 1 - - 3,428 1 8
MOUNTAIN 45 87 2,181 3,114 5 1 489 932 12 40
Mont. - 5 114 82 - - 1 4 - 3
Idaho 4 3 165 184 - - 10 16 3 15
Wyo. - - - 92 - - - 6 - 9
Colo. 26 21 663 742 2 1 107 331 3 3
N. Mex. 4 9 546 496 1 - 111 92 3 5
Ariz. 4 33 522 1,092 1 - 243 395 2 -
Utah 4 13 171 215 1 - 17 25 1 3
Nev. 3 3 - 211 - - - 63 - 2
PACIFIC 584 517 5,907 9,767 16 7 1,158 2,389 53 115
Wash. 29 31 - 1,192 - 2 - 216 2 1
Oreg. 15 13 394 687 6 5 55 117 - 1
Calif. 525 468 5,146 7,417 10 - 1,042 1,964 51 89
Alaska 5 - 212 226 - - 42 45 - -
Hawaii 10 5 155 245 - - 19 47 - 24
Guam 1 - - 10 N - - 3 - -
P.R. 92 87 U U - U 46 69 - -
V.I. - 1 N N N U U U U U
Amer. Samoa - - U U N U U U U U
C.N.M.I. - - N N N U - 7 - -
------------------------------------------------------------------------------------------------------------------------------
N: Not notifiable U: Unavailable -: no reported cases C.N.M.I.: Commonwealth of North Mariana Islands
* Updated monthly from reports to the Division of HIV/AIDS Prevention -- Surveillance and Epidemiology, National Center for HIV,
STD, and TB Prevention, last update January 24, 1999.
** National Electronic Telecommunications System for Surveillance.
*** Public Health Laboratory Information System.
=======================================================================================================================================================
TABLE II. (page 2) Provisional cases of selected notifiable diseases, United States, weeks ending
February 13, 1999, and February 14, 1998 (6th Week)
Lyme Syphilis Rabies,
Legionellosis Disease Malaria (Primary & Secondary) Tuberculosis Animal
---------------- ---------------- ---------------- --------------------- ----------------- -------
Cum. Cum. Cum. Cum. Cum. Cum. Cum. Cum. Cum. Cum. Cum.
Reporting Area 1999 1998 1999 1998 1999 1998 1999 1998 1999 * 1998 1999
-------------------------------------------------------------------------------------------------------------------------------------------
UNITED STATES 66 133 210 317 104 134 528 817 839 1,145 395
NEW ENGLAND 4 10 26 36 1 6 11 11 24 30 70
Maine - - - 1 - - - - - - 4
N.H. 1 2 - - - - - 1 - - 4
Vt. 1 - - - - - 1 - - 1 13
Mass. 1 - 26 10 1 6 7 10 7 12 21
R.I. 1 3 - 2 - - - - 9 4 7
Conn. - 5 - 23 - - 3 - 8 13 21
MID. ATLANTIC 10 26 87 196 25 46 19 51 114 117 89
Upstate N.Y. 2 6 38 49 7 10 1 2 - 9 57
N.Y. City - 5 - 6 3 27 11 5 45 77 U
N.J. 3 1 41 30 13 5 1 14 45 26 21
Pa. 5 14 8 111 2 4 6 30 24 5 11
E.N. CENTRAL 25 51 10 14 10 13 85 120 90 77 1
Ohio 12 16 7 10 1 1 10 30 32 15 -
Ind. 4 7 2 3 4 1 26 20 4 21 -
Ill. - 11 - - - 7 42 43 51 26 -
Mich. 9 6 1 1 4 3 7 15 - - 1
Wis. - 11 U U 1 1 - 12 3 15 -
W.N. CENTRAL 1 9 4 4 5 5 1 14 22 21 42
Minn. - - - - - - - 1 17 8 10
Iowa 1 - 1 4 2 1 - - - - 12
Mo. - 4 - - 3 3 - 8 4 11 -
N. Dak. - - 1 - - - - - - - 11
S. Dak. - - - - - - - - 1 - -
Nebr. - 5 - - - - 1 2 - - 1
Kans. - - 2 - - 1 - 3 - 2 8
S. ATLANTIC 13 14 44 49 31 28 221 297 94 161 165
Del. 1 1 - - - 1 1 - - - -
Md. - 4 34 45 13 14 38 86 16 17 33
D.C. - 2 1 2 5 2 10 7 4 13 -
Va. 2 2 - - 4 2 21 32 9 5 41
W. Va. N N - - - - 1 - - 9 -
N.C. 2 3 8 - 1 3 72 77 29 77 42
S.C. 1 1 - - - - 36 38 20 28 11
Ga. - - - 2 - 4 4 20 16 12 19
Fla. 7 1 1 - 8 2 38 37 - - 19
E.S. CENTRAL 2 6 5 6 2 5 124 145 36 102 10
Ky. - 4 - - - - - 13 - 9 -
Tenn. 2 1 2 5 2 3 63 71 - 36 10
Ala. - - 3 1 - 1 43 35 34 39 -
Miss. - 1 - - - 1 18 26 2 18 -
W.S. CENTRAL 1 - - - 4 2 59 102 14 203 -
Ark. - - - - - - 10 15 8 - -
La. 1 - - - 3 2 23 46 - - -
Okla. - - - - - - 26 6 6 12 -
Tex. - - - - 1 - - 35 - 191 -
MOUNTAIN 4 7 - 1 4 7 - 30 16 47 7
Mont. - - - - 1 - - - - - 3
Idaho - - - - - - - - - - -
Wyo. - - - - - - - - - - -
Colo. 1 2 - - 1 3 - 2 - 6 1
N. Mex. 1 1 - - 1 3 - 2 3 6 -
Ariz. - - - - 1 - - 21 5 14 3
Utah 2 4 - - - 1 - 2 8 2 -
Nev. - - - 1 - - - 3 - 19 -
PACIFIC 6 10 34 11 22 22 8 47 429 387 11
Wash. - - - - 1 - - 1 20 25 -
Oreg. - - - - - 3 - 1 7 13 -
Calif. 6 10 34 11 20 19 7 45 379 337 11
Alaska - - - - - - - - 6 3 -
Hawaii - - - - 1 - 1 - 17 9 -
Guam - - - - - - - - - 4 -
P.R. - - - - - - 41 28 - 3 9
V.I. U U U U U U U U U U U
Amer. Samoa U U U U U U U U U U U
C.N.M.I. - - - - - - - 1 - 8 -
-------------------------------------------------------------------------------------------------------------------------------------------
N: Not notifiable U: Unavailable -: no reported cases
=======================================================================================================================================================
TABLE III. (page 1) Provisional cases of selected notifiable diseases preventable by vaccination, United
States, weeks ending February 13, 1999, and February 14, 1998 (6th Week)
Hepatitis (Viral), by type Measles (Rubeola)
H. influenzae, --------------------------------------- ------------------------------------------------------------
invasive A B Indigenous Imported** Total
---------------- ----------------- ----------------- --------------- --------------- ---------------
Cum. Cum. Cum. Cum. Cum. Cum. Cum. Cum. Cum. Cum.
Reporting Area 1999* 1998 1999 1998 1999 1998 1999 1999 1999 1999 1999 1998
-----------------------------------------------------------------------------------------------------------------------------------------------------
UNITED STATES 90 129 1,341 2,105 496 898 - 7 - 2 9 2
NEW ENGLAND 5 11 20 51 6 15 - - - - - 1
Maine - - 1 7 - - - - - - - -
N.H. 1 1 2 3 2 2 - - - - - -
Vt. 2 - - 2 - - - - - - - -
Mass. 2 10 6 12 2 8 - - - - - 1
R.I. - - - 4 2 - - - - - - -
Conn. - - 11 23 - 5 - - - - - -
MID. ATLANTIC 13 16 55 148 50 136 - - - - - 1
Upstate N.Y. 10 5 12 32 14 26 - - - - - -
N.Y. City - 5 9 63 5 36 - - - - - -
N.J. 3 6 15 25 8 23 - - - - - 1
Pa. - - 19 28 23 51 - - - - - -
E.N. CENTRAL 13 22 392 394 54 234 - - - - - -
Ohio 11 9 78 55 14 10 - - - - - -
Ind. 1 2 29 58 4 106 - - - - - -
Ill. 1 10 14 104 - 33 - - - - - -
Mich. - - 271 151 36 67 - - - - - -
Wis. - 1 - 26 - 18 - - - - - -
W.N. CENTRAL 3 - 23 203 10 49 - - - - - -
Minn. - - - 5 - 2 - - - - - -
Iowa 1 - 7 63 4 9 - - - - - -
Mo. - - 3 117 - 35 - - - - - -
N. Dak. - - - - - - - - - - - -
S. Dak. 1 - - 1 - 1 - - - - - -
Nebr. - - 10 3 5 - - - - - - -
Kans. 1 - 3 14 1 2 - - - - - -
S. ATLANTIC 31 19 150 130 80 72 - - - - - -
Del. - - - - - - - - - - - -
Md. 18 7 40 44 21 20 - - - - - -
D.C. - - 7 5 - 1 - - - - - -
Va. - 3 9 19 6 5 - - - - - -
W. Va. - 1 - - - - - - - - - -
N.C. 2 1 19 10 26 28 - - - - - -
S.C. 2 - 1 5 8 - - - - - - -
Ga. - 7 32 26 3 11 - - - - - -
Fla. 9 - 42 21 16 7 - - - - - -
E.S. CENTRAL 7 11 46 63 33 51 - - - - - -
Ky. - 2 - 2 - 2 U - U - - -
Tenn. 5 4 27 36 23 38 - - - - - -
Ala. 2 5 18 13 10 11 - - - - - -
Miss. - - 1 12 - - U - U - - -
W.S. CENTRAL 5 7 41 144 18 57 - - - 2 2 -
Ark. - - 3 2 7 12 - - - - - -
La. 3 3 5 3 3 2 - - - - - -
Okla. 1 3 2 47 - 3 - - - - - -
Tex. 1 1 31 92 8 40 - - - 2 2 -
MOUNTAIN 8 28 109 371 56 96 - 1 - - 1 -
Mont. 1 - 1 6 - 1 - - - - - -
Idaho 1 - 4 24 4 3 - - - - - -
Wyo. - - - 3 - 1 U - U - - -
Colo. - 2 39 35 14 11 - 1 - - 1 -
N. Mex. 2 - 5 22 27 31 - - - - - -
Ariz. - 15 50 226 6 29 U - U - - -
Utah 4 2 10 24 5 8 - - - - - -
Nev. - 9 - 31 - 12 U - U - - -
PACIFIC 5 15 505 601 189 188 - 6 - - 6 -
Wash. - - 8 42 1 14 - - - - - -
Oreg. 4 8 6 42 4 16 - 6 - - 6 -
Calif. - 6 489 509 182 154 - - - - - -
Alaska 1 - 1 - 2 1 - - - - - -
Hawaii - 1 1 8 - 3 - - - - - -
Guam - - - - - - U - U - - -
P.R. - 1 7 6 6 54 - - - - - -
V.I. U U U U U U U U U U U U
Amer. Samoa U U U U U U U U U U U U
C.N.M.I. - - - - - 7 U - U - - -
-----------------------------------------------------------------------------------------------------------------------------------------------------
N: Not notifiable U: Unavailable -: no reported cases
* Of 7 cases among children aged <5 years, serotype was reported for 1 which was not type b.
** For imported measles, cases include only those resulting from importation from other countries.
=======================================================================================================================================================
TABLE III. (page 2) Provisional cases of selected notifiable diseases preventable by vaccination, United
States, weeks ending February 13, 1999, and February 14, 1998 (6th Week)
Meningococcal
Disease Mumps Pertussis Rubella
----------------- -------------------------- --------------------------- ---------------------------
Cum. Cum. Cum. Cum. Cum. Cum. Cum. Cum.
Reporting Area 1999 1998 1999 1999 1998 1999 1999 1998 1999 1999 1998
------------------------------------------------------------------------------------------------------------------------------------------
UNITED STATES 213 406 7 37 32 39 246 451 - 3 24
NEW ENGLAND 16 26 - 1 - 4 45 94 - - 8
Maine 2 1 - - - - - 4 - - -
N.H. - 1 - 1 - 2 3 7 - - -
Vt. 1 1 - - - - 7 18 - - -
Mass. 13 10 - - - 2 35 62 - - 1
R.I. - 3 - - - - - - - - -
Conn. - 10 - - - - - 3 - - 7
MID. ATLANTIC 22 39 1 3 1 7 14 41 - - 11
Upstate N.Y. 4 9 - - 1 6 13 28 - - 10
N.Y. City 6 7 - - - - - 3 - - -
N.J. 8 14 - - - - - 3 - - 1
Pa. 4 9 1 3 - 1 1 7 - - -
E.N. CENTRAL 30 65 - 1 4 2 47 59 - - -
Ohio 18 26 - 1 3 2 41 23 - - -
Ind. 6 8 - - - - 1 2 - - -
Ill. 5 20 - - - - - - - - -
Mich. 1 4 - - 1 - 5 8 - - -
Wis. - 7 - - - - - 26 - - -
W.N. CENTRAL 13 32 - 1 - - 5 31 - - -
Minn. - - - - - - - 18 - - -
Iowa 4 4 - 1 - - 3 6 - - -
Mo. 3 17 - - - - 1 2 - - -
N. Dak. - - - - - - - - - - -
S. Dak. 3 3 - - - - 1 - - - -
Nebr. 1 1 - - - - - 2 - - -
Kans. 2 7 - - - - - 3 - - -
S. ATLANTIC 43 55 4 7 7 15 40 33 - 3 1
Del. 1 - - - - - - - - - -
Md. 6 7 1 1 - 1 13 5 - - -
D.C. - - - - - - - - - - -
Va. 2 6 - - - 5 6 - - - -
W. Va. - 2 - - - - - - - - -
N.C. 5 8 - 1 4 6 16 23 - 3 1
S.C. 6 5 - 2 2 - 2 - - - -
Ga. 4 20 - - - - - - - - -
Fla. 19 7 3 3 1 3 3 5 - - -
E.S. CENTRAL 17 37 - - - - 7 11 - - -
Ky. - 8 U - - U - - U - -
Tenn. 8 13 - - - - 4 3 - - -
Ala. 9 14 - - - - 3 8 - - -
Miss. - 2 U - - U - - U - -
W.S. CENTRAL 8 20 - 8 7 1 11 9 - - 1
Ark. 1 4 - - - - 4 2 - - -
La. 6 4 - - - - - - - - -
Okla. - 11 - - - - - - - - -
Tex. 1 1 - 8 7 1 7 7 - - 1
MOUNTAIN 18 26 - 2 2 10 71 106 - - 2
Mont. - 1 - - - - - 1 - - -
Idaho 3 1 - - - 8 44 51 - - -
Wyo. - 1 U - - U - - U - -
Colo. 3 10 - 1 - 1 4 14 - - -
N. Mex. 4 3 N N N 1 7 36 - - -
Ariz. 5 8 U - 1 U 2 - U - -
Utah 3 1 - 1 - - 14 2 - - 2
Nev. - 1 U - 1 U - 2 U - -
PACIFIC 46 106 2 14 11 - 6 67 - - 1
Wash. 4 12 - - - - 2 7 - - -
Oreg. 3 26 N N N - 3 8 - - -
Calif. 33 65 2 12 5 - - 52 - - 1
Alaska 3 1 - 1 2 - 1 - - - -
Hawaii 3 2 - 1 4 - - - - - -
Guam - - U - - U - - U - -
P.R. - - - - - - - - - - -
V.I. U U U U U U U U U U U
Amer. Samoa U U U U U U U U U U U
C.N.M.I. - - U - - U - - U - -
------------------------------------------------------------------------------------------------------------------------------------------
N: Not notifiable U: Unavailable -: no reported cases
=======================================================================================================================================================
TABLE IV. Deaths in 122 U.S. cities,* week ending
February 13, 1999 (6th Week)
===================================================================================================================================
All Causes, By Age (Years)
------------------------------------------------------------------------ P&I**
Reporting Area All Ages >=65 45-64 25-44 1-24 <1 Total
---------------------------------------------------------------------------------------------------------------
NEW ENGLAND 601 452 102 32 9 6 86
Boston, Mass. 141 99 25 12 2 3 20
Bridgeport, Conn. 55 40 11 4 - - 7
Cambridge, Mass. 19 15 4 - - - 3
Fall River, Mass. 44 35 7 1 - 1 4
Hartford, Conn. 49 35 8 1 5 - 4
Lowell, Mass. 27 24 3 - - - 3
Lynn, Mass. 16 11 2 3 - - 3
New Bedford, Mass. 30 29 1 - - - 2
New Haven, Conn. 44 32 10 - 1 1 9
Providence, R.I. U U U U U U U
Somerville, Mass. 6 4 2 - - - 1
Springfield, Mass. 51 37 12 1 1 - 4
Waterbury, Conn. 33 25 5 3 - - 8
Worcester, Mass. 86 66 12 7 - 1 18
MID. ATLANTIC 2,656 1,932 483 167 42 32 96
Albany, N.Y. 61 46 10 2 1 2 5
Allentown, Pa. 18 15 3 - - - -
Buffalo, N.Y. U U U U U U U
Camden, N.J. 34 21 5 5 2 1 4
Elizabeth, N.J. 15 15 - - - - -
Erie, Pa. 42 31 8 1 1 1 1
Jersey City, N.J. 76 54 11 7 2 2 -
New York City, N.Y. 1,622 1,168 297 111 27 19 7
Newark, N.J. U U U U U U U
Paterson, N.J. 23 17 3 3 - - -
Philadelphia, Pa. 299 188 80 23 4 4 25
Pittsburgh, Pa.*** 59 47 8 2 2 - 5
Reading, Pa. 36 29 6 - 1 - 6
Rochester, N.Y. 167 135 23 7 1 1 21
Schenectady, N.Y. 28 23 5 - - - 6
Scranton, Pa. 30 26 2 2 - - -
Syracuse, N.Y. 72 56 11 4 - 1 9
Trenton, N.J. 41 34 5 - 1 1 6
Utica, N.Y. 33 27 6 - - - 1
Yonkers, N.Y. U U U U U U U
E.N. CENTRAL 2,264 1,537 465 143 53 63 175
Akron, Ohio 44 34 7 1 - 2 1
Canton, Ohio 47 35 7 5 - - 5
Chicago, Ill. 477 273 107 52 13 29 35
Cincinnati, Ohio 95 61 22 6 2 4 6
Cleveland, Ohio 154 103 35 9 4 3 -
Columbus, Ohio 199 145 39 7 4 4 25
Dayton, Ohio 114 84 22 4 3 1 13
Detroit, Mich. 237 141 62 23 9 2 9
Evansville, Ind. 58 45 13 - - - 5
Fort Wayne, Ind. 75 54 15 4 - 2 7
Gary, Ind. 20 10 4 3 1 2 2
Grand Rapids, Mich. 65 53 7 2 1 2 6
Indianapolis, Ind. 191 129 44 7 6 5 11
Lansing, Mich. 63 45 9 7 2 - 3
Milwaukee, Wis. 128 96 25 3 1 3 20
Peoria, Ill. 43 33 8 1 1 - 7
Rockford, Ill. 54 38 9 6 1 - 11
South Bend, Ind. 58 41 14 1 1 1 1
Toledo, Ohio 87 71 11 2 1 2 5
Youngstown, Ohio 55 46 5 - 3 1 3
W.N. CENTRAL 634 483 101 27 7 16 61
Des Moines, Iowa U U U U U U U
Duluth, Minn. 19 16 3 - - - 2
Kansas City, Kans. U U U U U U U
Kansas City, Mo. 95 70 16 4 - 5 8
Lincoln, Nebr. 45 32 8 1 - 4 5
Minneapolis, Minn. 204 164 30 6 2 2 25
Omaha, Nebr. 85 63 12 5 3 2 8
St. Louis, Mo. 95 65 19 8 1 2 7
St. Paul, Minn. 91 73 13 3 1 1 6
Wichita, Kans. U U U U U U U
S. ATLANTIC 1,206 834 215 107 29 20 95
Atlanta, Ga. U U U U U U U
Baltimore, Md. 209 129 48 22 5 5 28
Charlotte, N.C. 101 69 18 7 5 2 6
Jacksonville, Fla. 163 119 25 12 6 1 9
Miami, Fla. 104 58 25 17 1 3 -
Norfolk, Va. 58 42 8 6 1 1 8
Richmond, Va. 81 51 20 6 3 - 7
Savannah, Ga. 77 60 11 3 - 3 6
St. Petersburg, Fla. 95 77 10 6 - 2 13
Tampa, Fla. 149 112 20 12 3 2 12
Washington, D.C. 145 96 30 14 4 1 6
Wilmington, Del. 24 21 - 2 1 - -
E.S. CENTRAL 827 542 181 62 22 17 61
Birmingham, Ala. 189 131 39 12 2 2 17
Chattanooga, Tenn. 73 52 14 6 - 1 6
Knoxville, Tenn. 86 61 14 6 4 1 2
Lexington, Ky. 85 57 21 6 1 - 8
Memphis, Tenn. 103 70 22 8 2 1 13
Mobile, Ala. 86 48 21 11 3 3 -
Montgomery, Ala. 55 36 9 8 1 1 12
Nashville, Tenn. 150 87 41 5 9 8 3
W.S. CENTRAL 1,404 961 260 104 43 36 130
Austin, Tex. 77 54 15 5 3 - 5
Baton Rouge, La. 73 59 7 4 3 - -
Corpus Christi, Tex. 72 59 9 2 2 - 6
Dallas, Tex. 246 158 45 27 5 11 17
El Paso, Tex. 134 92 28 6 4 4 7
Ft. Worth, Tex. 126 92 23 7 4 - 19
Houston, Tex. 389 247 79 41 13 9 30
Little Rock, Ark. 86 51 21 8 4 2 8
New Orleans, La. U U U U U U U
San Antonio, Tex. U U U U U U U
Shreveport, La. 54 42 8 - 2 2 11
Tulsa, Okla. 147 107 25 4 3 8 27
MOUNTAIN 1,050 723 179 100 31 16 96
Albuquerque, N.M. 120 82 21 14 2 - 10
Boise, Idaho 41 34 5 1 1 - 2
Colo. Springs, Colo. 76 51 12 6 3 4 8
Denver, Colo. 137 92 29 11 4 1 14
Las Vegas, Nev. 251 172 45 27 4 3 15
Ogden, Utah 19 12 3 3 1 - -
Phoenix, Ariz. 103 62 19 9 10 3 -
Pueblo, Colo. 30 29 - 1 - - 3
Salt Lake City, Utah 131 86 23 17 3 2 22
Tucson, Ariz. 142 103 22 11 3 3 22
PACIFIC 1,521 1,116 264 85 30 23 152
Berkeley, Calif. 17 12 4 - - 1 -
Fresno, Calif. 80 52 17 7 4 - 8
Glendale, Calif. 32 28 4 - - - 4
Honolulu, Hawaii 73 58 10 1 - 3 6
Long Beach, Calif. U U U U U U U
Los Angeles, Calif. 370 259 76 27 4 4 26
Pasadena, Calif. 19 13 2 1 2 1 -
Portland, Oreg. 142 104 26 7 2 3 9
Sacramento, Calif. 181 132 29 10 6 4 36
San Diego, Calif. 102 73 15 7 4 3 9
San Francisco, Calif. 174 127 34 11 1 1 30
San Jose, Calif. U U U U U U U
Santa Cruz, Calif. 28 25 3 - - - 4
Seattle, Wash. 140 99 25 11 2 3 6
Spokane, Wash. 60 51 8 - 1 - 6
Tacoma, Wash. 103 83 11 3 4 - 8
TOTAL 12,163**** 8,580 2,250 827 266 229 952
---------------------------------------------------------------------------------------------------------------
U: Unavailable -: no reported cases
* Mortality data in this table are voluntarily reported from 122 cities in the United States, most of which have populations
of 100,000 or more. A death is reported by the place of its occurrence and by the week that the death certificate was
filed. Fetal deaths are not included.
** Pneumonia and influenza.
*** Because of changes in reporting methods in this Pennsylvania city, these numbers are partial counts for the current
week. Complete counts will be available in 4 to 6 weeks.
**** Total includes unknown ages.
===================================================================================================================================
Disclaimer All MMWR HTML versions of articles are electronic conversions from ASCII text into HTML. This conversion may have resulted in character translation or format errors in the HTML version. Users should not rely on this HTML document, but are referred to the electronic PDF version and/or the original MMWR paper copy for the official text, figures, and tables. An original paper copy of this issue can be obtained from the Superintendent of Documents, U.S. Government Printing Office (GPO), Washington, DC 20402-9371; telephone: (202) 512-1800. Contact GPO for current prices. **Questions or messages regarding errors in formatting should be addressed to mmwrq@cdc.gov.Page converted: 02/18/99 |
|||||||||
This page last reviewed 5/2/01
|