 |
|
|
|
|
|
|
| ||||||||||
|
|
|
|
|
|
|
||||
| ||||||||||
|
|
|
|
|
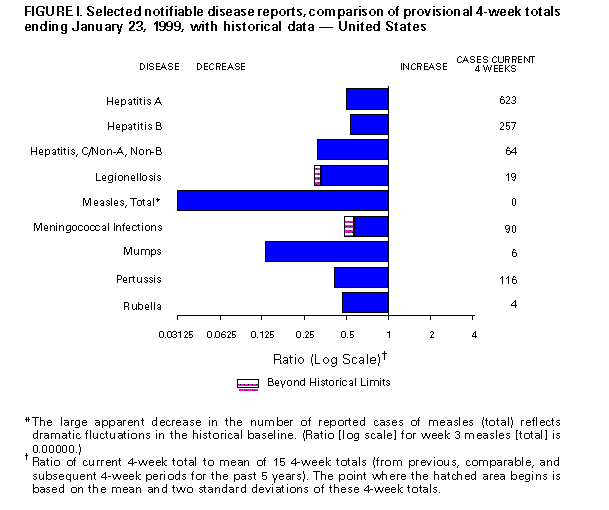
Persons using assistive technology might not be able to fully access information in this file. For assistance, please send e-mail to: mmwrq@cdc.gov. Type 508 Accommodation and the title of the report in the subject line of e-mail. Notifiable Diseases/Deaths in Selected Cities Weekly InformationFigure_I Selected notifiable disease reports, comparison of provisional 4-week totals ending January 23, 1999, with historical data -- United States Table_I Summary -- provisional cases of selected notifiable diseases, United States, cumulative, week ending January 23, 1999 (3rd Week) Table_II Provisional cases of selected notifiable diseases, United States, weeks ending January 23, 1999 and January 24, 1998 (3rd Week) Table_III Provisional cases of selected notifiable diseases preventable by vaccination, United States, weeks ending January 23, 1999 and January 24, 1998 (3rd Week) Table_IV Deaths in 122 U.S. cities, week ending
January 23, 1999 (3rd Week)
TABLE I. Summary -- provisional cases of specified notifiable diseases, United
States, cumulative, week ending January 23, 1999 (3rd Week)
==================================================================================
                                             Cum. 1999
------------------------------------------------------
Anthrax                                              -
Brucellosis                                          1
Cholera                                              -
Congenital rubella syndrome                          -
Cryptosporidiosis*                                  24
Diphtheria                                           -
Encephalitis:  California*                           -
               eastern equine*                       -
               St. Louis*                            -
               western equine*                       -
Hansen Disease                                       -
Hantavirus pulmonary syndrome*+                      -
Hemolytic uremic syndrome, post-diarrheal*           2
HIV infection, pediatric*&                           -
Plague                                               -
Poliomyelitis, paralytic                             -
Psittacosis                                          1
Rabies, human                                        -
Rocky Mountain spotted fever (RMSF)                  9
Streptococcal disease, invasive Group A             34
Streptococcal toxic-shock syndrome*                  -
Syphilis, congenital@                                -
Tetanus                                              -
Toxic-shock syndrome                                 1
Trichinosis                                          1
Typhoid fever                                        2
Yellow fever                                         -
------------------------------------------------------
-: no reported cases
 * Not notifiable in all states
 + Updated weekly from reports to the Division of Viral and Rickettsial
   Diseases, National Center for Infectious Diseases (NCID).
 & Updated monthly from reports to the Division of HIV/AIDS Prevention --
   Surveillance and Epidemiology, National Center for HIV, STD, and TB
   Prevention (NCHSTP), last update December 27, 1998.
 @ Updated from reports to the Division of STD Prevention, NCHSTP.

==================================================================================
Return to top. Table_II Note: To print large tables and graphs users may have to change their printer settings to landscape and use a small font size.
TABLE II. (page 1) Provisional cases of selected notifiable diseases, United States, weeks ending
January 23, 1999, and January 24, 1998 (3rd Week)
Escherichia
coli O157:H7
------------------- Hepatitis
AIDS Chlamydia NETSS** PHLIS*** Gonorrhea C/NA,NB
----------------- -------------------- -------- -------- ------------------- ----------------
Cum. Cum. Cum. Cum. Cum. Cum. Cum. Cum. Cum. Cum.
Reporting Area 1999* 1998 1999 1998 1999 1999 1999 1998 1999 1998
------------------------------------------------------------------------------------------------------------------------------
UNITED STATES - 1,630 19,089 30,613 45 10 11,924 19,651 63 132
NEW ENGLAND - 62 653 1,174 6 2 203 393 11 6
Maine - - - 11 1 - - 2 - -
N.H. - - 46 50 - - - 7 - -
Vt. - 5 6 17 - - 3 - - 1
Mass. - 6 481 521 4 2 168 151 11 5
R.I. - 13 119 156 - - 31 23 - -
Conn. - 38 1 419 1 - 1 210 - -
MID. ATLANTIC - 735 2,987 4,330 2 - 1,599 2,715 - 6
Upstate N.Y. - 6 N N 2 - 31 236 - 6
N.Y. City - 476 1,715 1,920 - - 877 1,036 - -
N.J. - 94 132 601 - - 85 463 - -
Pa. - 159 1,140 1,809 N - 606 980 - -
E.N. CENTRAL - 22 2,152 5,420 15 1 1,719 3,951 11 31
Ohio - 1 835 1,623 13 1 609 914 - 2
Ind. - 1 - 301 2 - 391 320 - 1
Ill. - 2 1,104 U - - 599 U - 4
Mich. - 14 175 1,571 - - 81 1,256 11 24
Wis. - 4 38 751 N - 39 308 - -
W.N. CENTRAL - 23 371 1,891 5 2 135 740 - 23
Minn. - - 44 389 2 2 28 166 - -
Iowa - - 6 95 3 - 6 25 - 1
Mo. - 19 - 739 - - - 268 - 22
N. Dak. - - - 55 - - - 3 - -
S. Dak. - - 55 85 - - 8 17 - -
Nebr. - - - 123 - - - 60 - -
Kans. - 4 266 405 - - 93 201 - -
S. ATLANTIC - 372 6,030 5,169 6 2 4,774 4,739 4 5
Del. - - 144 75 - - 90 80 - -
Md. - 43 435 382 1 - 318 245 2 2
D.C. - - N N - - 184 237 - -
Va. - 36 847 335 N - 805 332 - 1
W. Va. - 2 105 168 - 1 45 47 - -
N.C. - 44 1,227 914 2 1 1,150 849 - 2
S.C. - 40 2,042 1,013 1 - 1,161 835 - -
Ga. - 2 - 1,379 - - - 1,283 - -
Fla. - 205 1,230 903 2 - 1,021 831 2 -
E.S. CENTRAL - 45 1,331 2,098 4 - 1,202 2,279 4 4
Ky. - 18 - 282 - - - 217 - 1
Tenn. - 27 678 696 3 - 527 719 3 3
Ala. - - 653 543 1 - 675 770 1 -
Miss. - - - 577 - - - 573 - -
W.S. CENTRAL - 311 1,810 4,026 - - 1,313 2,979 - -
Ark. - 15 223 128 - - 46 202 - -
La. - - 1,094 754 - - 1,001 832 - -
Okla. - 14 493 450 - - 266 276 - -
Tex. - 282 - 2,694 - - - 1,669 - -
MOUNTAIN - 55 1,159 1,287 4 1 377 460 5 13
Mont. - 5 - 6 - - - - - 3
Idaho - 3 - 70 - - - 7 2 3
Wyo. - - - 39 - - - 2 - 1
Colo. - 20 364 280 2 1 77 175 1 2
N. Mex. - 9 224 266 1 - 52 56 2 1
Ariz. - 15 522 425 - - 243 192 - -
Utah - - 49 113 1 - 5 13 - 2
Nev. - 3 - 88 - - - 15 - 1
PACIFIC - 5 2,596 5,218 3 2 602 1,395 28 44
Wash. - - - 509 - 1 - 88 - -
Oreg. - - - 380 - 1 - 57 - -
Calif. - - 2,512 4,110 3 - 592 1,207 28 44
Alaska - - 28 93 - - 3 16 - -
Hawaii - 5 56 126 - - 7 27 - -
Guam - - - 9 N - - 1 - -
P.R. - - U U - U 13 35 - -
V.I. - - N N N U U U U U
Amer. Samoa - - U U N U U U U U
C.N.M.I. - - N N N U - 5 - -
------------------------------------------------------------------------------------------------------------------------------
N: Not notifiable U: Unavailable -: no reported cases C.N.M.I.: Commonwealth of North Mariana Islands
* Updated monthly from reports to the Division of HIV/AIDS Prevention -- Surveillance and Epidemiology, National Center for HIV,
STD, and TB Prevention, last update December 27, 1998.
** National Electronic Telecommunications System for Surveillance.
*** Public Health Laboratory Information System.
=======================================================================================================================================================
TABLE II. (page 2) Provisional cases of selected notifiable diseases, United States, weeks ending
January 23, 1999, and January 24, 1998 (3rd Week)
Lyme Syphilis Rabies,
Legionellosis Disease Malaria (Primary & Secondary) Tuberculosis Animal
---------------- ---------------- ---------------- --------------------- ----------------- -------
Cum. Cum. Cum. Cum. Cum. Cum. Cum. Cum. Cum. Cum. Cum.
Reporting Area 1999 1998 1999 1998 1999 1998 1999 1998 1999 * 1998 1999
-------------------------------------------------------------------------------------------------------------------------------------------
UNITED STATES 18 55 83 153 29 60 200 407 357 460 135
NEW ENGLAND - - 2 6 - 2 4 5 13 8 36
Maine - - - - - - - - - - 2
N.H. - - - - - - - 1 - - -
Vt. - - - - - - - - - - 7
Mass. - - 2 6 - 2 4 4 4 2 13
R.I. - - - - - - - - 5 - 4
Conn. - - - - - - - - 4 6 10
MID. ATLANTIC 4 4 49 106 3 23 4 20 9 4 33
Upstate N.Y. - - 5 29 2 3 - - - - 15
N.Y. City - 1 - 4 - 16 3 3 9 4 U
N.J. 2 - 41 17 1 1 - 7 - - 14
Pa. 2 3 3 56 - 3 1 10 - - 4
E.N. CENTRAL 8 28 4 6 - 10 32 62 17 36 -
Ohio 3 12 4 3 - 1 4 15 5 5 -
Ind. 2 5 - 2 - 1 12 21 - 13 -
Ill. - 5 - - - 5 16 U 12 17 -
Mich. 3 4 - 1 - 2 - - - - -
Wis. - 2 U U - 1 - 8 - 1 -
W.N. CENTRAL - 3 1 1 - 3 - 5 6 4 14
Minn. - - - - - - - - 5 3 5
Iowa - - - 1 - - - - - - 2
Mo. - 1 - - - 3 - 2 1 1 -
N. Dak. - - - - - - - - - - 3
S. Dak. - - - - - - - - - - -
Nebr. - 2 - - - - - 1 - - -
Kans. - - 1 - - - - 2 - - 4
S. ATLANTIC 2 6 22 22 8 6 84 138 16 43 44
Del. 1 1 - - - - - - - - -
Md. - 3 18 21 3 6 7 35 - - 9
D.C. - 1 - 1 4 - 1 1 2 5 -
Va. - 1 - - - - 11 14 - - 7
W. Va. N N - - - - 1 - - 5 -
N.C. 1 - 4 - - - 37 32 - 12 16
S.C. - - - - - - 11 18 14 21 -
Ga. - - - - - - - 21 - - -
Fla. - - - - 1 - 16 17 - - 12
E.S. CENTRAL - 4 3 4 - 1 53 71 9 40 2
Ky. - 3 - - - - - 8 - 5 -
Tenn. - - - 4 - - 29 33 - 14 2
Ala. - - 3 - - - 24 23 9 17 -
Miss. - 1 - - - 1 - 7 - 4 -
W.S. CENTRAL - - - - 1 - 22 63 4 76 -
Ark. - - - - - - 1 8 - - -
La. - - - - 1 - 9 27 - - -
Okla. - - - - - - 12 4 4 3 -
Tex. - - - - - - - 24 - 73 -
MOUNTAIN - 5 - - 3 2 - 12 3 19 5
Mont. - - - - 1 - - - - - 1
Idaho - - - - - - - - - - -
Wyo. - - - - - - - - - - -
Colo. - 2 - - - 1 - 1 - 3 1
N. Mex. - 1 - - 1 1 - - 1 2 -
Ariz. - - - - 1 - - 8 - 3 3
Utah - 2 - - - - - 2 2 - -
Nev. - - - - - - - 1 - 11 -
PACIFIC 4 5 2 8 14 13 1 31 280 230 1
Wash. - - - - 1 - - - 14 7 -
Oreg. - - - - - 2 - 1 - 7 -
Calif. 4 5 2 8 13 11 1 30 256 214 1
Alaska - - - - - - - - 1 1 -
Hawaii - - - - - - - - 9 1 -
Guam - - - - - - - - - 4 -
P.R. - - - - - - 14 14 - - 3
V.I. U U U U U U U U U U U
Amer. Samoa U U U U U U U U U U U
C.N.M.I. - - - - - - - 1 - 3 -
-------------------------------------------------------------------------------------------------------------------------------------------
N: Not notifiable U: Unavailable -: no reported cases
=======================================================================================================================================================
Return to top. Table_III Note: To print large tables and graphs users may have to change their printer settings to landscape and use a small font size.
TABLE III. (page 1) Provisional cases of selected notifiable diseases preventable by vaccination, United
States, weeks ending January 23, 1999, and January 24, 1998 (3rd Week)
Hepatitis (Viral), by type Measles (Rubeola)
H. influenzae, --------------------------------------- ------------------------------------------------------------
invasive A B Indigenous Imported** Total
---------------- ----------------- ----------------- --------------- --------------- ---------------
Cum. Cum. Cum. Cum. Cum. Cum. Cum. Cum. Cum. Cum.
Reporting Area 1999* 1998 1999 1998 1999 1998 1999 1999 1999 1999 1999 1998
-----------------------------------------------------------------------------------------------------------------------------------------------------
UNITED STATES 28 63 424 884 154 420 - 1 - - 1 1
NEW ENGLAND - 6 8 25 - 4 - - - - - 1
Maine - - 1 5 - - - - - - - -
N.H. - 1 1 1 - 1 - - - - - -
Vt. - - - 1 - - - - - - - -
Mass. - 5 3 6 - - - - - - - 1
R.I. - - - - - - - - - - - -
Conn. - - 3 12 - 3 - - - - - -
MID. ATLANTIC 4 9 11 60 11 66 - - - - - -
Upstate N.Y. 3 3 2 12 1 8 - - - - - -
N.Y. City - 3 - 26 - 15 - - - - - -
N.J. 1 3 8 10 5 18 - - - - - -
Pa. - - 1 12 5 25 - - - - - -
E.N. CENTRAL 7 8 85 200 7 135 - - - - - -
Ohio 6 2 35 30 6 6 - - - - - -
Ind. - 1 3 21 - 66 - - - - - -
Ill. 1 5 - 55 - 13 - - - - - -
Mich. - - 47 84 1 38 U - U - - -
Wis. - - - 10 - 12 - - - - - -
W.N. CENTRAL 1 - 1 70 1 22 - - - - - -
Minn. - - - - - - - - - - - -
Iowa - - - 21 - 3 - - - - - -
Mo. - - - 45 - 16 - - - - - -
N. Dak. - - - - - - - - - - - -
S. Dak. - - - - - 1 - - - - - -
Nebr. - - - 1 1 - - - - - - -
Kans. 1 - 1 3 - 2 - - - - - -
S. ATLANTIC 10 10 55 33 30 32 - - - - - -
Del. - - - - - - - - - - - -
Md. 9 6 21 9 7 13 - - - - - -
D.C. 1 - 4 2 - 1 - - - - - -
Va. - - 1 6 1 2 - - - - - -
W. Va. - 1 - - - - - - - - - -
N.C. - - 10 6 16 15 - - - - - -
S.C. - - - 3 2 - - - - - - -
Ga. - 3 11 7 1 1 - - - - - -
Fla. - - 8 - 3 - - - - - - -
E.S. CENTRAL 2 5 22 27 9 14 - - - - - -
Ky. - - - 1 - 1 U - U - - -
Tenn. 2 1 7 9 3 7 - - - - - -
Ala. - 4 14 6 6 6 - - - - - -
Miss. - - 1 11 - - - - - - - -
W.S. CENTRAL 2 1 14 44 4 14 - - - - - -
Ark. - - 3 1 4 4 - - - - - -
La. - - 1 - - - - - - - - -
Okla. 1 - 2 19 - - - - - - - -
Tex. 1 1 8 24 - 10 - - - - - -
MOUNTAIN 2 15 46 189 20 41 - 1 - - 1 -
Mont. - - - 3 - 1 - - - - - -
Idaho - - 1 5 3 3 - - - - - -
Wyo. - - - - - - U - U - - -
Colo. - 1 19 16 9 5 - 1 - - 1 -
N. Mex. 2 - 3 12 7 15 - - - - - -
Ariz. - 7 20 120 1 8 - - - - - -
Utah - - 3 11 - 3 - - - - - -
Nev. - 7 - 22 - 6 U - U - - -
PACIFIC - 9 182 236 72 92 - - - - - -
Wash. - - 2 1 - - - - - - - -
Oreg. - 6 - 13 - 7 U - U - - -
Calif. - 3 180 220 71 84 - - - - - -
Alaska - - - - 1 1 - - - - - -
Hawaii - - - 2 - - - - - - - -
Guam - - - - - - U - U - - -
P.R. - 1 - 1 1 8 - - - - - -
V.I. U U U U U U U U U U U U
Amer. Samoa U U U U U U U U U U U U
C.N.M.I. - - - - - 3 U - U - - -
-----------------------------------------------------------------------------------------------------------------------------------------------------
N: Not notifiable U: Unavailable -: no reported cases
* Of 2 cases among children aged <5 years, serotype was reported for 0.
** For imported measles, cases include only those resulting from importation from other countries.
=======================================================================================================================================================
TABLE III. (page 2) Provisional cases of selected notifiable diseases preventable by vaccination, United
States, weeks ending January 23, 1999, and January 24, 1998 (3rd Week)
Meningococcal
Disease Mumps Pertussis Rubella
----------------- -------------------------- --------------------------- ---------------------------
Cum. Cum. Cum. Cum. Cum. Cum. Cum. Cum.
Reporting Area 1999 1998 1999 1999 1998 1999 1999 1998 1999 1999 1998
------------------------------------------------------------------------------------------------------------------------------------------
UNITED STATES 73 194 2 6 19 17 95 205 3 4 4
NEW ENGLAND 7 11 - - - 3 45 45 - - -
Maine 2 1 - - - - - 1 - - -
N.H. - 1 - - - - - 5 - - -
Vt. 1 - - - - 1 6 11 - - -
Mass. 4 5 - - - 2 39 28 - - -
R.I. - - - - - - - - - - -
Conn. - 4 - - - - - - - - -
MID. ATLANTIC 7 18 - - 1 1 3 6 - - 2
Upstate N.Y. 1 2 - - 1 1 3 4 - - 1
N.Y. City - 4 - - - - - - - - -
N.J. 5 8 - - - - - 2 - - 1
Pa. 1 4 - - - - - - - - -
E.N. CENTRAL 11 26 - - 1 4 4 28 - - -
Ohio 9 13 - - 1 4 4 12 - - -
Ind. - 3 - - - - - - - - -
Ill. 2 8 - - - - - - - - -
Mich. - 1 U - - U - 5 U - -
Wis. - 1 - - - - - 11 - - -
W.N. CENTRAL 1 13 - 1 - - - 7 - - -
Minn. - - - - - - - - - - -
Iowa - 1 - 1 - - - 3 - - -
Mo. - 6 - - - - - - - - -
N. Dak. - - - - - - - - - - -
S. Dak. - 1 - - - - - - - - -
Nebr. - - - - - - - 2 - - -
Kans. 1 5 - - - - - 2 - - -
S. ATLANTIC 16 30 1 2 5 3 11 26 3 3 1
Del. - - - - - - - - - - -
Md. 6 7 - - - - 4 5 - - -
D.C. - - - - - - - - - - -
Va. - 3 - - - - - - - - -
W. Va. - 2 - - - - - - - - -
N.C. 2 3 1 1 3 3 7 21 3 3 1
S.C. 1 4 - - 2 - - - - - -
Ga. - 11 - - - - - - - - -
Fla. 7 - - 1 - - - - - - -
E.S. CENTRAL 5 21 - - - 1 4 4 - 1 -
Ky. - 6 U - - U - - U - -
Tenn. 1 5 - - - 1 1 - - - -
Ala. 4 9 - - - - 3 4 - - -
Miss. - 1 - - - - - - - 1 -
W.S. CENTRAL - 8 - - 3 - - - - - 1
Ark. - 2 - - - - - - - - -
La. - - - - - - - - - - -
Okla. - 6 - - - - - - - - -
Tex. - - - - 3 - - - - - 1
MOUNTAIN 9 17 - - 2 3 26 63 - - -
Mont. - 1 - - - - - - - - -
Idaho 1 - - - - 1 14 25 - - -
Wyo. - 1 U - - U - - U - -
Colo. 2 7 - - - 1 1 10 - - -
N. Mex. 1 2 N N N 1 3 25 - - -
Ariz. 3 4 - - 1 - 1 - - - -
Utah 2 1 - - - - 7 2 - - -
Nev. - 1 U - 1 U - 1 U - -
PACIFIC 17 50 1 3 7 2 2 26 - - -
Wash. 2 4 - - - 2 2 - - - -
Oreg. - 16 N N N U - 5 U - -
Calif. 13 30 1 2 2 - - 21 - - -
Alaska 2 - - - 2 - - - - - -
Hawaii - - - 1 3 - - - - - -
Guam - - U - - U - - U - -
P.R. - - - - - - - - - - -
V.I. U U U U U U U U U U U
Amer. Samoa U U U U U U U U U U U
C.N.M.I. - - U - - U - - U - -
------------------------------------------------------------------------------------------------------------------------------------------
N: Not notifiable U: Unavailable -: no reported cases
=======================================================================================================================================================
Return to top. Table_IV Note: To print large tables and graphs users may have to change their printer settings to landscape and use a small font size.
TABLE IV. Deaths in 122 U.S. cities,* week ending
January 23, 1999 (3rd Week)
===================================================================================================================================
All Causes, By Age (Years)
------------------------------------------------------------------------ P&I**
Reporting Area All Ages >=65 45-64 25-44 1-24 <1 Total
---------------------------------------------------------------------------------------------------------------
NEW ENGLAND 669 504 108 33 14 10 81
Boston, Mass. 141 97 29 8 2 5 19
Bridgeport, Conn. 40 31 7 2 - - 2
Cambridge, Mass. 20 18 2 - - - 3
Fall River, Mass. 35 29 5 1 - - 1
Hartford, Conn. 67 53 9 4 - 1 8
Lowell, Mass. 40 30 6 4 - - 3
Lynn, Mass. 15 12 2 - 1 - -
New Bedford, Mass. 48 43 3 2 - - 3
New Haven, Conn. 46 29 9 5 2 1 1
Providence, R.I. 46 36 8 1 1 - 17
Somerville, Mass. 7 6 1 - - - 2
Springfield, Mass. 42 27 9 - 5 1 11
Waterbury, Conn. 39 30 8 1 - - 2
Worcester, Mass. 83 63 10 5 3 2 9
MID. ATLANTIC 2,739 2,013 477 161 47 41 88
Albany, N.Y. 71 58 10 1 2 - 8
Allentown, Pa. 25 20 3 1 1 - 2
Buffalo, N.Y. U U U U U U U
Camden, N.J. 21 9 6 5 - 1 1
Elizabeth, N.J. 12 11 - 1 - - -
Erie, Pa. 68 56 8 3 1 - 2
Jersey City, N.J. 77 56 14 4 - 3 -
New York City, N.Y. 1,539 1,129 273 90 25 22 6
Newark, N.J. 80 35 22 15 4 4 4
Paterson, N.J. 39 29 9 - 1 - 3
Philadelphia, Pa. 299 220 50 20 6 3 11
Pittsburgh, Pa.*** 82 64 11 5 - 2 7
Reading, Pa. 42 38 2 1 1 - 4
Rochester, N.Y. 154 120 26 3 - 5 18
Schenectady, N.Y. 39 30 7 1 1 - 4
Scranton, Pa. 42 34 6 2 - - 3
Syracuse, N.Y. 95 68 15 7 4 1 8
Trenton, N.J. 30 19 9 2 - - 4
Utica, N.Y. 24 17 6 - 1 - 3
Yonkers, N.Y. U U U U U U U
E.N. CENTRAL 2,256 1,620 413 153 23 46 144
Akron, Ohio 55 41 8 4 - 2 3
Canton, Ohio 37 34 2 1 - - 9
Chicago, Ill. 393 233 89 47 9 14 25
Cincinnati, Ohio 123 81 20 8 3 11 17
Cleveland, Ohio 177 132 31 12 1 1 5
Columbus, Ohio 230 166 48 9 3 4 15
Dayton, Ohio 160 127 27 6 - - 16
Detroit, Mich. 247 167 54 22 2 2 5
Evansville, Ind. 51 45 6 - - - 3
Fort Wayne, Ind. 95 73 16 5 - 1 4
Gary, Ind. 9 5 4 - - - 1
Grand Rapids, Mich. 68 55 9 2 - 2 10
Indianapolis, Ind. 113 89 19 2 2 1 3
Lansing, Mich. 68 49 12 5 - 2 3
Milwaukee, Wis. 173 129 30 9 2 3 10
Peoria, Ill. 66 45 9 10 1 1 8
Rockford, Ill. 46 32 10 3 - 1 2
South Bend, Ind. 56 48 5 3 - - 3
Toledo, Ohio U U U U U U U
Youngstown, Ohio 89 69 14 5 - 1 2
W.N. CENTRAL 587 441 104 25 9 7 35
Des Moines, Iowa U U U U U U U
Duluth, Minn. 29 25 3 - - 1 3
Kansas City, Kans. U U U U U U U
Kansas City, Mo. 85 61 15 5 2 1 -
Lincoln, Nebr. 32 25 6 1 - - 2
Minneapolis, Minn. 161 121 32 5 1 2 12
Omaha, Nebr. 113 84 16 8 4 1 9
St. Louis, Mo. 92 67 19 2 2 2 6
St. Paul, Minn. 75 58 13 4 - - 3
Wichita, Kans. U U U U U U U
S. ATLANTIC 1,050 705 224 81 24 16 69
Atlanta, Ga. U U U U U U U
Baltimore, Md. 126 82 30 13 1 - 15
Charlotte, N.C. 104 69 21 8 3 3 11
Jacksonville, Fla. 138 98 24 8 5 3 8
Miami, Fla. 100 64 20 11 4 1 2
Norfolk, Va. 66 44 19 1 1 1 7
Richmond, Va. 76 54 13 5 2 2 3
Savannah, Ga. 69 51 14 4 - - 3
St. Petersburg, Fla. 92 72 15 4 - 1 7
Tampa, Fla. 182 115 33 22 7 5 10
Washington, D.C. 84 54 24 5 1 - 3
Wilmington, Del. 13 2 11 - - - -
E.S. CENTRAL 1,054 732 211 70 30 10 81
Birmingham, Ala. 162 119 29 8 4 1 25
Chattanooga, Tenn. 69 49 13 6 - 1 9
Knoxville, Tenn. 111 75 24 9 3 - 9
Lexington, Ky. 76 52 17 5 1 1 5
Memphis, Tenn. 295 198 65 23 5 4 25
Mobile, Ala. 86 63 16 3 3 1 2
Montgomery, Ala. 80 53 15 7 5 - 6
Nashville, Tenn. 175 123 32 9 9 2 -
W.S. CENTRAL 1,637 1,120 297 110 50 52 108
Austin, Tex. 98 64 19 12 1 2 5
Baton Rouge, La. 32 16 4 2 2 - 1
Corpus Christi, Tex. 65 46 8 3 4 4 3
Dallas, Tex. 238 145 48 13 6 26 8
El Paso, Tex. 84 68 13 2 1 - 2
Ft. Worth, Tex. 134 101 25 5 3 - 16
Houston, Tex. 354 235 71 31 11 6 29
Little Rock, Ark. 91 63 17 7 1 3 5
New Orleans, La. 88 59 16 8 5 - -
San Antonio, Tex. 242 177 41 14 5 5 20
Shreveport, La. 73 46 17 6 2 2 4
Tulsa, Okla. 138 100 18 7 9 4 15
MOUNTAIN 1,021 732 165 79 29 15 89
Albuquerque, N.M. 131 94 18 9 8 2 9
Boise, Idaho 28 21 4 1 2 - 3
Colo. Springs, Colo. 60 47 7 4 1 1 5
Denver, Colo. 112 73 17 14 3 4 11
Las Vegas, Nev. 296 220 50 20 3 3 17
Ogden, Utah 34 21 5 7 1 - 3
Phoenix, Ariz. 84 62 15 4 - 3 12
Pueblo, Colo. 30 23 3 2 2 - 2
Salt Lake City, Utah 117 73 24 11 8 1 11
Tucson, Ariz. 129 98 22 7 1 1 16
PACIFIC 1,751 1,300 294 105 30 21 204
Berkeley, Calif. 13 9 3 1 - - 1
Fresno, Calif. 129 102 14 7 5 1 16
Glendale, Calif. 19 18 1 - - - 1
Honolulu, Hawaii 81 58 15 4 - 4 4
Long Beach, Calif. 70 48 16 4 1 1 11
Los Angeles, Calif. 359 256 65 28 4 6 22
Pasadena, Calif. 32 25 5 - 2 - 2
Portland, Oreg. 109 87 14 6 1 1 9
Sacramento, Calif. 305 218 61 15 7 4 59
San Diego, Calif. 144 107 21 12 2 2 20
San Francisco, Calif. 144 112 22 7 2 1 27
San Jose, Calif. U U U U U U U
Santa Cruz, Calif. 32 25 4 2 1 - 6
Seattle, Wash. 118 83 23 9 2 1 3
Spokane, Wash. 58 47 7 3 1 - 7
Tacoma, Wash. 138 105 23 7 2 - 16
TOTAL 12,764**** 9,167 2,293 817 256 218 899
---------------------------------------------------------------------------------------------------------------
U: Unavailable -: no reported cases
* Mortality data in this table are voluntarily reported from 122 cities in the United States, most of which have populations
of 100,000 or more. A death is reported by the place of its occurrence and by the week that the death certificate was
filed. Fetal deaths are not included.
** Pneumonia and influenza.
*** Because of changes in reporting methods in this Pennsylvania city, these numbers are partial counts for the current
week. Complete counts will be available in 4 to 6 weeks.
**** Total includes unknown ages.
===================================================================================================================================
Return to top. Disclaimer All MMWR HTML versions of articles are electronic conversions from ASCII text into HTML. This conversion may have resulted in character translation or format errors in the HTML version. Users should not rely on this HTML document, but are referred to the electronic PDF version and/or the original MMWR paper copy for the official text, figures, and tables. An original paper copy of this issue can be obtained from the Superintendent of Documents, U.S. Government Printing Office (GPO), Washington, DC 20402-9371; telephone: (202) 512-1800. Contact GPO for current prices. **Questions or messages regarding errors in formatting should be addressed to mmwrq@cdc.gov.Page converted: 01/28/99 |
|||||||||
This page last reviewed 5/2/01
|