 |
|
|
|
|
|
|
| ||||||||||
|
|
|
|
|
|
|
||||
| ||||||||||
|
|
|
|
|
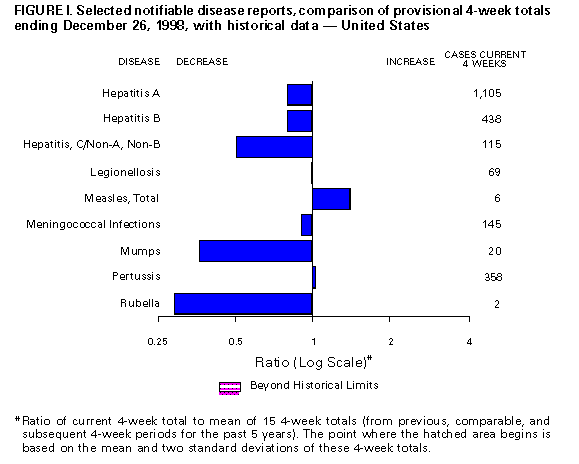
Persons using assistive technology might not be able to fully access information in this file. For assistance, please send e-mail to: mmwrq@cdc.gov. Type 508 Accommodation and the title of the report in the subject line of e-mail. Notifiable Diseases/Deaths in Selected Cities Weekly InformationFigure_I Selected notifiable disease reports, comparison of provisional 4-week totals ending December 26, 1998, with historical data -- United States Table_I Summary -- provisional cases of selected notifiable diseases, United States, cumulative, week ending December 26, 1998 (51st Week) Table_II Provisional cases of selected notifiable diseases, United States, weeks ending December 26, 1998 and December 20, 1997 (51st Week) Table_III Provisional cases of selected notifiable diseases preventable by vaccination, United States, weeks ending December 26, 1998 and December 20, 1997 (51st Week) Table_IV Deaths in 122 U.S. cities, week ending
December 26, 1998 (51st Week)
TABLE I. Summary -- provisional cases of specified notifiable diseases, United
States, cumulative, week ending December 26, 1998 (51st Week)
==================================================================================
                                             Cum. 1998
------------------------------------------------------
Anthrax                                              -
Brucellosis                                         61
Cholera                                             12
Congenital rubella syndrome                          6
Cryptosporidiosis*                               3,068
Diphtheria                                           1
Encephalitis:  California*                          90
               eastern equine*                       4
               St. Louis*                           26
               western equine*                       -
Hansen Disease                                     102
Hantavirus pulmonary syndrome*+                     19
Hemolytic uremic syndrome, post-diarrheal*          81
HIV infection, pediatric*&                         243
Plague                                               8
Poliomyelitis, paralytic                             1
Psittacosis                                         49
Rabies, human                                        -
Rocky Mountain spotted fever (RMSF)                332
Streptococcal disease, invasive Group A          2,026
Streptococcal toxic-shock syndrome*                 49
Syphilis, congenital@                              399
Tetanus                                             35
Toxic-shock syndrome                               128
Trichinosis                                         21
Typhoid fever                                      324
Yellow fever                                         -
------------------------------------------------------
-: no reported cases
 * Not notifiable in all states
 + Updated weekly from reports to the Division of Viral and Rickettsial
   Diseases, National Center for Infectious Diseases (NCID).
 & Updated monthly to the Division of HIV/AIDS Prevention -- Surveillance
   and Epidemiology, National Center for HIV, STD, and TB Prevention
   (NCHSTP), last update November 29, 1998.
 @ Updated from reports to the Division of STD Prevention, NCHSTP.

==================================================================================
Return to top. Table_II Note: To print large tables and graphs users may have to change their printer settings to landscape and use a small font size.
TABLE II. (page 1) Provisional cases of selected notifiable diseases, United States, weeks ending
December 26, 1998, and December 20, 1997 (51st Week)
Escherichia
coli O157:H7
------------------- Hepatitis
AIDS* Chlamydia NETSS** PHLIS*** Gonorrhea C\NA,NB
----------------- -------------------- -------- -------- ------------------- ----------------
Cum. Cum. Cum. Cum. Cum. Cum. Cum. Cum. Cum. Cum.
Reporting Area 1998 1997 1998 1997 1998 1998 1998 1997 1998 1997
------------------------------------------------------------------------------------------------------------------------------
UNITED STATES 42,564 55,074 548,138 461,757 2,887 1,883 328,163 291,955 4,781 3,400
NEW ENGLAND 1,688 2,251 17,865 17,773 332 260 5,100 5,797 109 57
Maine 28 51 1,008 1,025 36 - 66 66 - -
N.H. 40 39 914 795 46 45 87 96 - -
Vt. 19 35 409 415 21 17 37 50 4 4
Mass. 862 803 8,126 7,229 149 147 2,217 2,052 102 46
R.I. 118 145 2,271 2,005 13 1 418 408 3 7
Conn. 621 1,178 5,137 6,304 67 50 2,275 3,125 - -
MID. ATLANTIC 11,418 16,262 66,815 56,034 290 73 39,844 37,685 341 320
Upstate N.Y. 1,323 2,380 N N 219 - 6,654 6,395 254 237
N.Y. City 6,564 8,584 33,207 26,833 9 12 14,973 14,324 - -
N.J. 2,025 3,212 11,268 10,046 62 51 7,571 7,399 - -
Pa. 1,506 2,086 22,340 19,155 N 10 10,646 9,567 87 83
E.N. CENTRAL 3,063 4,217 87,742 63,345 453 321 63,254 40,734 496 531
Ohio 640 839 25,079 21,991 127 65 16,310 14,316 8 20
Ind. 472 518 4,656 9,287 104 49 4,832 6,075 7 12
Ill. 1,195 1,711 26,569 U 109 58 21,686 U 33 85
Mich. 578 900 21,405 21,082 113 62 16,080 15,438 448 388
Wis. 178 249 10,033 10,985 N 87 4,346 4,905 - 26
W.N. CENTRAL 832 1,131 30,557 32,641 485 384 15,862 14,586 284 58
Minn. 163 211 6,371 6,584 196 202 2,470 2,359 12 4
Iowa 63 108 2,063 4,612 92 58 660 1,228 8 27
Mo. 402 558 12,080 11,872 54 61 8,964 7,510 253 10
N. Dak. 5 12 849 868 12 15 71 70 - 3
S. Dak. 15 8 1,552 1,397 36 34 218 164 - -
Nebr. 65 90 2,684 2,681 61 - 1,124 1,180 5 2
Kans. 119 144 4,958 4,627 34 14 2,355 2,075 6 12
S. ATLANTIC 11,132 13,689 111,684 92,626 260 155 91,734 90,904 194 248
Del. 154 228 2,493 76 - 2 1,488 1,289 - -
Md. 1,489 1,864 7,234 7,318 39 14 9,684 11,215 24 12
D.C. 809 1,059 N N 1 - 3,348 4,247 - -
Va. 910 1,118 13,090 11,403 N 42 9,075 8,710 12 25
W. Va. 79 121 2,491 2,854 13 10 797 908 8 17
N.C. 752 796 21,482 17,108 57 46 18,713 16,888 20 49
S.C. 719 792 17,493 12,279 17 12 10,989 11,170 13 38
Ga. 1,174 1,600 22,749 15,749 78 - 18,980 18,085 9 -
Fla. 5,046 6,111 24,652 25,839 55 29 18,660 18,392 108 107
E.S. CENTRAL 1,684 2,016 37,363 34,633 118 39 36,531 34,708 192 344
Ky. 263 361 6,083 6,153 33 - 3,577 3,923 20 14
Tenn. 622 775 13,187 12,348 54 33 11,342 10,887 163 229
Ala. 456 567 10,060 8,467 25 2 12,708 11,769 7 13
Miss. 343 313 8,033 7,665 6 4 8,904 8,129 2 88
W.S. CENTRAL 5,140 6,034 75,991 65,638 121 24 46,329 42,918 426 482
Ark. 189 242 3,904 2,573 11 10 3,810 4,413 14 14
La. 878 1,049 14,770 9,904 5 7 12,743 9,720 118 219
Okla. 272 293 8,749 7,256 25 7 4,895 4,671 20 7
Tex. 3,801 4,450 48,568 45,905 80 - 24,881 24,114 274 242
MOUNTAIN 1,479 1,678 32,211 29,698 343 238 8,812 8,126 344 326
Mont. 28 41 1,278 1,171 16 - 48 61 7 22
Idaho 28 50 1,990 1,639 42 24 178 156 87 83
Wyo. 3 16 626 611 53 55 29 52 66 76
Colo. 286 394 8,675 7,406 91 69 2,257 2,209 34 36
N. Mex. 202 169 4,068 3,824 19 20 968 870 96 60
Ariz. 589 401 10,464 10,533 21 26 3,809 3,701 11 25
Utah 128 158 2,151 1,718 79 21 228 269 23 5
Nev. 215 449 2,959 2,796 22 23 1,295 808 20 19
PACIFIC 6,128 7,796 87,910 69,369 485 389 20,697 16,497 2,395 1,034
Wash. 390 609 10,874 9,166 109 127 1,938 1,876 22 32
Oreg. 166 284 5,901 4,913 104 99 858 725 6 3
Calif. 5,396 6,760 67,036 51,982 265 147 17,131 13,035 2,312 826
Alaska 17 46 1,847 1,542 7 - 324 369 1 -
Hawaii 159 97 2,252 1,766 N 16 446 492 54 173
Guam 1 2 201 193 N - 24 27 - -
P.R. 1,602 1,974 U U 8 U 370 526 - -
V.I. 31 94 N N N U U U U U
Amer. Samoa - - U U N U U U U U
C.N.M.I. - 1 N N N U 28 23 - 2
------------------------------------------------------------------------------------------------------------------------------
N: Not notifiable U: Unavailable -: no reported cases C.N.M.I.: Commonwealth of North Mariana Islands
* Updated monthly to the Division of HIV/AIDS Prevention, -- Surveillance and Epidemiology, National Center for HIV, STD,
and TB Prevention, last update November 29, 1998.
** National Electronic Telecommunications System for Surveillance.
*** Public Health Laboratory Information System.
=======================================================================================================================================================
TABLE II. (page 2) Provisional cases of selected notifiable diseases, United States, weeks ending
December 26, 1998, and December 20, 1997 (51st Week)
Lyme Syphilis Rabies,
Legionellosis Disease Malaria (Primary & Secondary) Tuberculosis Animal
---------------- ---------------- ---------------- --------------------- ----------------- -------
Cum. Cum. Cum. Cum. Cum. Cum. Cum. Cum. Cum. Cum. Cum.
Reporting Area 1998 1997 1998 1997 1998 1997 1998 1997 1998 * 1997 1998
-------------------------------------------------------------------------------------------------------------------------------------------
UNITED STATES 1,306 1,062 12,529 11,906 1,361 1,808 6,912 8,251 14,572 17,340 7,018
NEW ENGLAND 84 84 2,667 2,945 60 98 74 134 462 440 1,415
Maine 1 3 12 12 5 1 1 2 11 20 223
N.H. 7 7 45 37 5 10 2 - 14 15 77
Vt. 7 13 11 8 2 2 4 - 4 6 69
Mass. 32 29 780 290 16 32 44 69 271 247 495
R.I. 22 15 654 400 14 11 1 2 56 35 102
Conn. 15 17 1,165 2,198 18 42 22 61 106 117 449
MID. ATLANTIC 292 240 8,277 6,992 328 510 298 387 2,936 3,046 1,529
Upstate N.Y. 102 74 4,124 2,933 90 78 36 41 374 435 1,048
N.Y. City 28 26 37 175 154 308 81 84 1,445 1,537 U
N.J. 17 30 1,729 1,902 54 86 84 150 621 671 220
Pa. 145 110 2,387 1,982 30 38 97 112 496 403 261
E.N. CENTRAL 437 345 142 589 125 165 1,117 637 1,302 1,748 131
Ohio 135 119 58 39 15 19 130 219 90 246 58
Ind. 126 57 63 33 11 18 251 177 157 149 12
Ill. 37 35 9 13 41 68 467 U 649 908 16
Mich. 80 91 12 27 49 44 211 141 360 325 35
Wis. 59 43 U 477 9 16 58 100 46 120 10
W.N. CENTRAL 78 57 217 237 101 66 127 176 402 587 691
Minn. 8 3 174 195 63 36 9 16 149 150 122
Iowa 14 9 25 7 7 10 - 7 51 74 149
Mo. 24 21 2 28 15 11 97 117 95 234 28
N. Dak. - 2 - - 3 3 - - 10 12 143
S. Dak. 4 2 - 1 1 1 1 1 23 19 151
Nebr. 20 15 5 2 2 1 7 3 30 22 7
Kans. 8 5 11 4 10 4 13 32 44 76 91
S. ATLANTIC 151 126 897 745 323 321 2,528 3,453 2,011 3,235 2,316
Del. 13 13 45 109 3 5 21 22 18 36 49
Md. 33 23 623 476 88 84 650 897 274 300 436
D.C. 8 4 8 9 19 20 73 112 100 101 -
Va. 22 27 68 62 58 68 146 233 280 305 543
W. Va. N N 13 10 2 1 3 3 41 53 76
N.C. 14 14 61 34 30 20 717 1,017 498 428 556
S.C. 11 8 7 3 6 17 313 360 234 322 144
Ga. 8 2 5 7 40 52 284 525 496 593 301
Fla. 40 35 67 35 77 54 321 284 70 1,097 211
E.S. CENTRAL 70 55 98 94 31 39 1,153 1,666 1,116 1,269 272
Ky. 30 11 25 18 7 12 103 133 158 185 31
Tenn. 24 33 45 44 16 11 547 732 458 445 141
Ala. 9 4 24 11 6 10 274 409 316 403 98
Miss. 7 7 4 21 2 6 229 392 184 236 2
W.S. CENTRAL 46 34 36 114 66 58 1,012 1,286 2,116 2,473 136
Ark. - 2 7 25 1 5 104 165 146 179 31
La. 4 6 7 6 16 16 420 363 274 276 -
Okla. 12 3 2 33 4 9 121 116 160 201 105
Tex. 30 23 20 50 45 28 367 642 1,536 1,817 -
MOUNTAIN 78 62 25 15 63 65 220 174 456 550 214
Mont. 2 1 - - 1 2 - - 19 16 54
Idaho 3 2 7 4 8 - 2 1 13 14 -
Wyo. 1 1 1 3 - 2 1 - 4 2 63
Colo. 20 18 6 - 19 30 11 15 U 78 39
N. Mex. 2 3 4 1 12 8 22 8 65 67 6
Ariz. 20 12 1 4 9 11 169 134 205 231 19
Utah 22 18 - 1 2 3 4 5 53 33 27
Nev. 8 7 6 2 12 9 11 11 78 109 6
PACIFIC 70 59 170 175 264 486 383 338 3,771 3,992 314
Wash. 12 9 7 10 20 49 27 13 206 289 -
Oreg. 1 - 21 20 17 25 8 9 137 150 7
Calif. 55 49 141 143 216 395 346 314 3,206 3,321 284
Alaska 1 - 1 2 4 5 1 1 54 70 23
Hawaii 1 1 - - 7 12 1 1 168 162 -
Guam 2 - - - 1 - 1 3 36 13 -
P.R. - - - - - 6 180 249 140 212 53
V.I. U U U U U U U U U U U
Amer. Samoa U U U U U U U U U U U
C.N.M.I. - - - - - - 164 12 77 22 -
-------------------------------------------------------------------------------------------------------------------------------------------
N: Not notifiable U: Unavailable -: no reported cases
* Additional information about areas displaying 'U' for cumulative Tuberculosis cases can be found in Notices to Readers, MMWR Vol. 47, No. 2, p. 39.
=======================================================================================================================================================
Return to top. Table_III Note: To print large tables and graphs users may have to change their printer settings to landscape and use a small font size.
TABLE III. (page 1) Provisional cases of selected notifiable diseases preventable by vaccination, United
States, weeks ending December 26, 1998, and December 20, 1997 (51st Week)
Hepatitis (Viral), by type Measles (Rubeola)
H. influenzae, --------------------------------------- ------------------------------------------------------------
invasive A B Indigenous Imported** Total
---------------- ----------------- ----------------- --------------- --------------- ---------------
Cum. Cum. Cum. Cum. Cum. Cum. Cum. Cum. Cum. Cum.
Reporting Area 1998* 1997 1998 1997 1998 1997 1998 1998 1998 1998 1998 1997
-----------------------------------------------------------------------------------------------------------------------------------------------------
UNITED STATES 1,004 1,057 21,618 27,682 8,471 9,241 1 68 - 26 94 134
NEW ENGLAND 68 63 270 636 183 179 - 1 - 2 3 19
Maine 4 5 20 62 5 6 - - - - - 1
N.H. 9 11 15 34 20 17 - - - - - 1
Vt. 9 3 16 15 6 11 - - - 1 1 -
Mass. 38 39 106 252 56 76 U 1 U 1 2 16
R.I. 6 3 17 129 68 16 - - - - - -
Conn. 2 2 96 144 28 53 - - - - - 1
MID. ATLANTIC 143 164 1,426 2,059 1,064 1,334 1 9 - 6 15 27
Upstate N.Y. 64 53 355 363 285 313 1 2 - 1 3 5
N.Y. City 27 42 368 896 271 450 - - - - - 11
N.J. 46 49 333 310 192 241 - 7 - 1 8 3
Pa. 6 20 370 490 316 330 U - U 4 4 8
E.N. CENTRAL 159 163 3,669 2,996 1,555 1,471 - 13 - 3 16 10
Ohio 47 84 372 317 75 93 - - - 1 1 -
Ind. 42 19 337 322 768 97 - 2 - 1 3 -
Ill. 55 41 701 838 190 276 - 1 - - 1 7
Mich. 8 18 2,091 1,337 468 452 - 9 - 1 10 2
Wis. 7 1 168 182 54 553 - 1 - - 1 1
W.N. CENTRAL 91 58 1,298 2,147 407 473 - 1 - - 1 17
Minn. 66 44 130 197 49 43 - - - - - 8
Iowa 4 6 399 466 55 42 - 1 - - 1 -
Mo. 13 5 580 1,103 246 332 - - - - - 1
N. Dak. - - 3 11 4 5 - - - - - -
S. Dak. 1 2 39 24 3 1 - - - - - 8
Nebr. 1 1 41 89 23 20 - - - - - -
Kans. 6 - 106 257 27 30 - - - - - -
S. ATLANTIC 196 166 1,994 2,071 1,180 1,206 - 3 - 5 8 15
Del. - - 6 30 4 7 U - U 1 1 -
Md. 55 57 327 182 155 163 - - - 1 1 2
D.C. - - 64 36 19 30 - - - - - 1
Va. 19 14 218 225 102 127 - - - 2 2 1
W. Va. 5 4 7 12 11 16 - - - - - -
N.C. 24 21 126 205 244 252 - - - - - 2
S.C. 3 4 46 107 53 97 - - - - - 1
Ga. 53 39 666 655 146 148 - 1 - 1 2 1
Fla. 37 27 534 619 446 366 - 2 - - 2 7
E.S. CENTRAL 59 56 373 638 392 702 - - - 2 2 1
Ky. 8 8 26 76 46 39 U - U - - -
Tenn. 34 31 221 401 268 443 - - - 1 1 -
Ala. 15 15 83 83 76 77 - - - 1 1 1
Miss. 2 2 43 78 2 143 U - U - - -
W.S. CENTRAL 59 48 4,044 5,545 1,197 1,241 - 1 - - 1 8
Ark. - 2 88 209 92 85 - - - - - -
La. 25 12 145 224 182 162 - 1 - - 1 -
Okla. 31 31 622 1,402 121 51 - - - - - 1
Tex. 3 3 3,189 3,710 802 943 - - - - - 7
MOUNTAIN 119 88 3,170 4,143 808 837 - 7 - 3 10 8
Mont. - 1 95 70 5 12 - - - - - -
Idaho 2 1 233 141 49 53 - - - - - -
Wyo. 1 4 36 34 8 24 U - U - - -
Colo. 20 22 348 393 108 146 - - - - - -
N. Mex. 9 9 148 345 314 247 - - - - - -
Ariz. 61 32 1,904 2,196 176 192 - 7 - 3 10 5
Utah 7 3 196 540 66 89 - - - - - 1
Nev. 19 16 210 424 82 74 - - - - - 2
PACIFIC 110 251 5,374 7,447 1,685 1,798 - 33 - 5 38 29
Wash. 10 6 913 666 116 82 - - - 1 1 2
Oreg. 40 38 370 368 127 118 - - - - - -
Calif. 51 191 4,034 6,233 1,421 1,572 - 5 - 3 8 23
Alaska 1 8 17 34 12 15 - 28 - 1 29 -
Hawaii 8 8 40 146 9 11 - - - - - 4
Guam - - - - 2 3 U - U - - -
P.R. 2 - 57 267 359 780 - - - - - -
V.I. U U U U U U U U U U U U
Amer. Samoa U U U U U U U U U U U U
C.N.M.I. - 6 3 1 53 47 U - U - - 1
-----------------------------------------------------------------------------------------------------------------------------------------------------
N: Not notifiable U: Unavailable -: no reported cases
* Of 226 cases among children aged <
** For imported measles, cases include only those resulting from importation from other countries.
=======================================================================================================================================================
TABLE III. (page 2) Provisional cases of selected notifiable diseases preventable by vaccination, United
States, weeks ending December 26, 1998, and December 20, 1997 (51st Week)
Meningococcal
Disease Mumps Pertussis Rubella
----------------- -------------------------- --------------------------- ---------------------------
Cum. Cum. Cum. Cum. Cum. Cum. Cum. Cum.
Reporting Area 1998 1997 1998 1998 1997 1998 1998 1997 1998 1998 1997
------------------------------------------------------------------------------------------------------------------------------------------
UNITED STATES 2,585 3,077 5 601 630 111 6,170 5,770 - 345 162
NEW ENGLAND 110 195 - 8 12 8 946 1,036 - 38 1
Maine 7 19 - - - - 5 25 - - -
N.H. 4 15 - - 1 4 127 133 - - -
Vt. 5 4 - - - 1 77 263 - - -
Mass. 56 95 U 4 4 U 675 564 U 8 1
R.I. 8 22 - 1 6 3 16 17 - 1 -
Conn. 30 40 - 3 1 - 46 34 - 29 -
MID. ATLANTIC 239 336 1 173 60 7 599 413 - 144 35
Upstate N.Y. 71 88 1 13 14 7 320 169 - 111 6
N.Y. City 25 54 - 139 3 - 39 71 - 18 29
N.J. 56 72 - 3 8 - 12 14 - 13 -
Pa. 87 122 U 18 35 U 228 159 U 2 -
E.N. CENTRAL 377 481 1 76 92 23 680 645 - - 6
Ohio 140 162 - 29 35 9 291 159 - - -
Ind. 70 55 - 6 14 6 151 76 - - -
Ill. 91 152 - 11 12 8 129 124 - - 2
Mich. 42 67 1 30 27 - 71 69 - - -
Wis. 34 45 - - 4 - 38 217 - - 4
W.N. CENTRAL 224 225 - 31 18 40 597 596 - 34 1
Minn. 35 34 - 13 6 - 342 354 - - -
Iowa 48 46 - 11 10 - 73 118 - - -
Mo. 81 98 - 4 - 1 46 73 - 3 1
N. Dak. 5 2 - 2 - 38 42 1 - - -
S. Dak. 8 5 - - - - 8 5 - - -
Nebr. 15 18 - - 1 1 20 13 - - -
Kans. 32 22 - 1 1 - 66 32 - 31 -
S. ATLANTIC 452 521 2 52 74 5 341 418 - 19 78
Del. 2 5 U - - U 5 1 U - -
Md. 34 42 - - 1 - 59 114 - 1 -
D.C. 4 12 - - - - 1 3 - - 1
Va. 48 58 - 10 19 1 51 56 - 1 1
W. Va. 17 19 - - - - 4 6 - - -
N.C. 58 91 - 11 12 1 104 118 - 13 59
S.C. 57 56 - 7 11 - 27 30 - - 15
Ga. 97 100 1 2 10 1 28 13 - - -
Fla. 135 138 1 22 21 2 62 77 - 4 2
E.S. CENTRAL 258 233 - 18 31 - 122 147 - 2 1
Ky. 38 49 U 1 3 U 50 66 U - -
Tenn. 71 76 - 2 6 - 37 38 - 2 -
Ala. 110 83 - 9 9 - 32 32 - - 1
Miss. 39 25 U 6 13 U 3 11 U - -
W.S. CENTRAL 300 288 - 61 87 2 370 295 - 89 6
Ark. 31 37 - 12 1 - 93 54 - - -
La. 66 48 - 10 16 - 9 20 - - -
Okla. 41 44 - - - - 31 51 - - -
Tex. 162 159 - 39 70 2 237 170 - 89 6
MOUNTAIN 152 178 - 40 56 23 1,118 1,292 - 5 7
Mont. 4 8 - - - - 13 18 - - -
Idaho 14 13 - 7 4 7 226 554 - - 2
Wyo. 7 3 U 1 1 U 8 7 U - -
Colo. 30 48 - 7 3 1 245 408 - - -
N. Mex. 26 29 N N N 1 98 189 - 1 -
Ariz. 47 44 - 6 33 13 224 41 - 1 5
Utah 14 15 - 5 8 1 263 27 - 2 -
Nev. 10 18 - 14 7 - 41 48 - 1 -
PACIFIC 473 620 1 142 200 3 1,397 928 - 14 27
Wash. 64 96 - 11 21 2 331 407 - 9 5
Oreg. 91 122 N N N - 90 48 - - -
Calif. 310 392 1 106 146 1 941 438 - 3 14
Alaska 3 3 - 2 8 - 15 16 - - -
Hawaii 5 7 - 23 25 - 20 19 - 2 8
Guam 1 1 U 2 1 U - - U - -
P.R. 8 8 - 1 7 - 6 - - - -
V.I. U U U U U U U U U U U
Amer. Samoa U U U U U U U U U U U
C.N.M.I. - - U 2 4 U 1 - U - -
------------------------------------------------------------------------------------------------------------------------------------------
N: Not notifiable U: Unavailable -: no reported cases
=======================================================================================================================================================
Return to top. Table_IV Note: To print large tables and graphs users may have to change their printer settings to landscape and use a small font size.
TABLE IV. Deaths in 122 U.S. cities,* week ending
December 26, 1998 (51st Week)
===================================================================================================================================
All Causes, By Age (Years)
------------------------------------------------------------------------ P&I**
Reporting Area All Ages >=65 45-6
---------------------------------------------------------------------------------------------------------------
NEW ENGLAND 438 316 78 21 4 19 35
Boston, Mass. 97 71 19 5 - 2 8
Bridgeport, Conn. 33 25 4 2 1 1 4
Cambridge, Mass. 10 8 1 1 - - 3
Fall River, Mass. 14 9 4 1 - - -
Hartford, Conn. 36 23 10 1 1 1 1
Lowell, Mass. 23 20 1 2 - - 2
Lynn, Mass. 12 10 2 - - - 1
New Bedford, Mass. 19 17 2 - - - 2
New Haven, Conn. 25 18 2 3 1 1 2
Providence, R.I. 48 32 10 1 1 4 -
Somerville, Mass. 5 3 1 1 - - -
Springfield, Mass. 31 22 5 1 - 3 5
Waterbury, Conn. 21 15 5 1 - - 1
Worcester, Mass. 64 43 12 2 - 7 6
MID. ATLANTIC 2,425 1,733 448 168 38 38 119
Albany, N.Y. 45 34 8 1 - 2 2
Allentown, Pa. 10 10 - - - - -
Buffalo, N.Y. 84 62 18 2 1 1 2
Camden, N.J. 28 20 4 3 - 1 2
Elizabeth, N.J. 6 4 2 - - - -
Erie, Pa. 42 31 7 3 1 - 1
Jersey City, N.J. 36 27 1 8 - - -
New York City, N.Y. 1,303 905 262 99 17 20 70
Newark, N.J. 68 33 19 11 5 - -
Paterson, N.J. 18 13 2 2 1 - -
Philadelphia, Pa. 299 217 55 16 7 4 15
Pittsburgh, Pa.*** 76 61 7 7 1 - 3
Reading, Pa. 31 23 4 2 1 1 2
Rochester, N.Y. 121 90 21 3 2 5 6
Schenectady, N.Y. 28 24 2 2 - - 3
Scranton, Pa. 25 20 3 1 1 - 1
Syracuse, N.Y. 98 74 18 5 1 - 11
Trenton, N.J. 17 10 4 2 - 1 -
Utica, N.Y. 25 21 4 - - - -
Yonkers, N.Y. 65 54 7 1 - 3 1
E.N. CENTRAL 1,559 1,059 314 111 31 44 88
Akron, Ohio 55 42 9 2 1 1 -
Canton, Ohio 49 40 7 2 - - 5
Chicago, Ill. 238 132 67 26 5 8 22
Cincinnati, Ohio 49 35 10 2 1 1 8
Cleveland, Ohio 104 71 20 11 2 - 1
Columbus, Ohio 178 126 34 12 2 4 15
Dayton, Ohio 97 67 15 9 3 3 2
Detroit, Mich. 128 71 31 15 4 7 4
Evansville, Ind. 17 13 4 - - - -
Fort Wayne, Ind. 52 36 9 4 - 3 4
Gary, Ind. 14 7 3 1 3 - -
Grand Rapids, Mich. 45 33 6 3 1 2 4
Indianapolis, Ind. 158 96 47 9 2 4 9
Lansing, Mich. 39 33 3 1 - 2 2
Milwaukee, Wis. 81 59 15 4 - 3 -
Peoria, Ill. 40 29 6 2 2 1 4
Rockford, Ill. 44 36 4 1 2 1 2
South Bend, Ind. 25 16 4 3 2 - 1
Toledo, Ohio 81 63 13 3 1 1 4
Youngstown, Ohio 65 54 7 1 - 3 1
W.N. CENTRAL 706 496 133 37 13 14 40
Des Moines, Iowa U U U U U U U
Duluth, Minn. 31 25 4 - 2 - 3
Kansas City, Kans. 22 16 2 4 - - -
Kansas City, Mo. 109 67 24 2 2 1 8
Lincoln, Nebr. 26 23 1 1 1 - 2
Minneapolis, Minn. 143 106 23 9 1 4 18
Omaha, Nebr. 105 78 15 6 2 4 6
St. Louis, Mo. 94 59 20 8 3 4 -
St. Paul, Minn. 72 49 17 5 1 - 2
Wichita, Kans. 104 73 27 2 1 1 1
S. ATLANTIC 933 635 192 71 20 14 51
Atlanta, Ga. U U U U U U U
Baltimore, Md. 168 102 43 18 3 2 6
Charlotte, N.C. 73 48 16 5 3 - 9
Jacksonville, Fla. 124 84 31 7 1 1 4
Miami, Fla. 106 76 19 9 - 2 1
Norfolk, Va. 50 34 9 4 1 2 2
Richmond, Va. 57 44 6 4 2 1 2
Savannah, Ga. 61 44 9 6 1 1 6
St. Petersburg, Fla. 88 61 20 1 3 3 7
Tampa, Fla. 197 134 39 16 6 2 14
Washington, D.C. U U U U U U U
Wilmington, Del. 9 8 - 1 - - -
E.S. CENTRAL 668 454 141 48 15 10 55
Birmingham, Ala. 180 124 37 10 8 1 14
Chattanooga, Tenn. 31 22 7 1 - 1 3
Knoxville, Tenn. 41 27 10 3 1 - 8
Lexington, Ky. 48 27 14 4 1 2 6
Memphis, Tenn. 167 118 30 14 2 3 18
Mobile, Ala. 84 56 23 4 - 1 1
Montgomery, Ala. 54 34 9 9 2 - 1
Nashville, Tenn. 63 46 11 3 1 2 4
W.S. CENTRAL 1,030 671 220 75 30 34 61
Austin, Tex. 44 34 6 1 3 - 2
Baton Rouge, La. 37 22 9 3 1 2 2
Corpus Christi, Tex. 45 38 3 2 1 1 2
Dallas, Tex. 145 87 32 9 7 10 3
El Paso, Tex. 71 45 21 3 1 1 3
Ft. Worth, Tex. 81 50 17 6 4 4 8
Houston, Tex. 246 161 56 21 2 6 23
Little Rock, Ark. 5 4 1 - - - -
New Orleans, La. 108 57 25 15 5 6 -
San Antonio, Tex. 122 82 27 9 1 3 5
Shreveport, La. 65 49 8 4 3 1 8
Tulsa, Okla. 61 42 15 2 2 - 5
MOUNTAIN 889 614 152 75 26 21 62
Albuquerque, N.M. 89 62 15 7 3 2 2
Boise, Idaho 35 23 10 2 - - 2
Colo. Springs, Colo. 55 28 18 7 2 - 5
Denver, Colo. 112 74 22 9 6 1 7
Las Vegas, Nev. 161 116 24 16 4 1 4
Ogden, Utah 41 34 4 1 - 2 4
Phoenix, Ariz. 135 82 29 15 5 4 13
Pueblo, Colo. 24 19 2 3 - - 6
Salt Lake City, Utah 113 84 12 6 2 9 10
Tucson, Ariz. 124 92 16 9 4 2 9
PACIFIC 756 567 126 35 12 16 77
Berkeley, Calif. 18 16 1 1 - - 3
Fresno, Calif. 77 60 8 5 3 1 3
Glendale, Calif. U U U U U U U
Honolulu, Hawaii 50 37 11 1 - 1 2
Long Beach, Calif. 56 43 9 1 2 1 7
Los Angeles, Calif. U U U U U U U
Pasadena, Calif. 19 13 4 1 - 1 2
Portland, Oreg. 98 72 16 6 - 4 3
Sacramento, Calif. 187 139 32 10 3 3 35
San Diego, Calif. 121 87 23 5 3 3 14
San Francisco, Calif. U U U U U U U
San Jose, Calif. U U U U U U U
Santa Cruz, Calif. 24 20 3 1 - - 1
Seattle, Wash. U U U U U U U
Spokane, Wash. 53 39 12 1 1 - 6
Tacoma, Wash. 53 41 7 3 - 2 1
TOTAL 9,404**** 6,545 1,804 641 189 210 588
---------------------------------------------------------------------------------------------------------------
U: Unavailable -: no reported cases
* Mortality data in this table are voluntarily reported from 122 cities in the United States, most of which have populations
of 100,000 or more. A death is reported by the place of its occurrence and by the week that the death certificate was
filed. Fetal deaths are not included.
** Pneumonia and influenza.
*** Because of changes in reporting methods in this Pennsylvania city, these numbers are partial counts for the current
week. Complete counts will be available in 4 to 6 weeks.
**** Total includes unknown ages.
===================================================================================================================================
Return to top. Disclaimer All MMWR HTML versions of articles are electronic conversions from ASCII text into HTML. This conversion may have resulted in character translation or format errors in the HTML version. Users should not rely on this HTML document, but are referred to the electronic PDF version and/or the original MMWR paper copy for the official text, figures, and tables. An original paper copy of this issue can be obtained from the Superintendent of Documents, U.S. Government Printing Office (GPO), Washington, DC 20402-9371; telephone: (202) 512-1800. Contact GPO for current prices. **Questions or messages regarding errors in formatting should be addressed to mmwrq@cdc.gov.Page converted: 01/07/99 |
|||||||||
This page last reviewed 5/2/01
|