 |
|
|
|
|
|
|
| ||||||||||
|
|
|
|
|
|
|
||||
| ||||||||||
|
|
|
|
|
Persons using assistive technology might not be able to fully access information in this file. For assistance, please send e-mail to: mmwrq@cdc.gov. Type 508 Accommodation and the title of the report in the subject line of e-mail. Progress Toward Eliminating Haemophilus influenzae Type b Disease Among Infants and Children -- United States, 1987-1997Haemophilus influenzae type b (Hib) causes serious invasive diseases among previously healthy children aged less than 5 years. Before the availability of conjugate vaccines in 1988, Hib was the most common cause of bacterial meningitis among preschool-aged children (1,2). Since 1993, the incidence of Hib invasive disease (defined as illness clinically compatible with invasive disease such as meningitis or sepsis, with isolation of the bacterium from a normally sterile site) among children aged less than 5 years has declined greater than 95% in the United States (3). This report describes the continued decline of reported Hib invasive disease cases and underscores the need for investigation of Haemophilus influenzae (Hi) invasive disease cases. National Surveillance State health agencies and the District of Columbia provide weekly reports of provisional cases of Hi invasive disease to CDC through the National Electronic Telecommunications System for Surveillance (NETSS) (4). Case reports include basic demographic data about persons with Hi invasive disease, and supplemental information (e.g., the serotype that caused illness, clinical illness, outcome, and Hib vaccination status). For 1996 and 1997, all states were contacted approximately every 2 months to obtain supplemental information about cases of Hi invasive disease in children aged less than 5 years. Hi cases identified by the active laboratory-based surveillance system also are reported to CDC through NETSS or the National Bacterial Meningitis and Bacteremia Reporting System. Reported Hib vaccination doses were considered valid if administration dates were available and if they were given greater than or equal to 14 days before illness onset. Rates were calculated using 1996 census data. Among children aged less than 5 years, 280 cases of Hi invasive disease were reported in 1996 (incidence: 1.5 per 100,000 children), and 258 cases were reported in 1997 (incidence: 1.3 per 100,000 children). Incidence in 1996 and 1997 represented a decline of 97% from 1987 (41 per 100,000). From 1987 through 1997, the incidence of Hi disease varied slightly among persons aged greater than or equal to 5 years (range: 0.3-0.6 per 100,000) (Figure_1). For children aged less than 5 years, serotype data were available for 200 (71%) of 280 cases in 1996 and for 200 (78%) of 258 cases in 1997. Of the cases for which serotype was known, in 1996, Hib was the cause of illness in 63 (32%) cases, and in 1997, in 81 (41%) cases. By state, excluding Alaska, the average annual incidence of Hib invasive disease during 1996-1997 ranged from 0 to 2.9 per 100,000 children aged less than 5 years; in Alaska, the incidence was 15.1 per 100,000 children (Table_1). The incidence of nontype b Hi disease ranged from 0 to 3.7 (national rate: 0.7 per 100,000). During 1996-1997, the average annual incidence of Hib invasive disease per 100,000 children aged less than 5 years varied by race/ethnicity: 0.5 among non-Hispanic whites, 0.7 among non-Hispanic blacks, 12.4 among American Indians/Alaskan Natives, 0.6 among Asians/Pacific Islanders, and 0.7 among Hispanics. Race/ethnicity data were missing for 12 (8%) children. Active Laboratory-Based Surveillance in Selected Areas Population-based surveillance for Hi invasive disease is part of a multistate active surveillance project coordinated by CDC. From 1989 through 1997, CDC collaborated with investigators in state and local health departments and universities in several geographically dispersed areas of the United States, with a median population of 1,060,505 children aged less than 5 years (range: 750,534 in 1989 to 1,605,777 in 1997). During 1989-1991, surveillance was conducted in eight Atlanta area counties, three San Francisco Bay area counties, four urban counties in Tennessee, and the entire state of Oklahoma. In 1992, Maryland was added. Missouri participated during 1992-1993. In 1995, a county in Tennessee was added, and Oklahoma discontinued participation. In 1996, Connecticut and Oregon and seven counties in Minnesota were added. In 1997, active surveillance in Georgia expanded to 20 counties, and surveillance in Minnesota expanded to the entire state. Information routinely obtained for cases of Hi invasive disease was similar to that collected by the national surveillance systems. Rates were calculated using census projections from 1989 through 1996 and were race-adjusted to the U.S. population (3). From 1989 to 1997, the race-adjusted incidence of Hib invasive disease among children aged less than 5 years declined 99%, from 34 to 0.4 per 100,000. During 1996-1997, 79 cases of Hi invasive disease were reported among children aged less than 5 years. Of these, 14 (18%) were caused by Hib; 48 (61%), by nontype b Hi; and 17 (22%), by unknown serotypes. From 1989 to 1997, the median race-adjusted incidence of nontype b Hi invasive disease was 1.6 per 100,000 children (range: 1.1 to 3.8 per 100,000); the median incidence was higher among blacks (3.2) than among all others (1.4). Vaccination History of Children with Hib Invasive Disease in 1996 and 1997 Of the 144 children with confirmed Hib invasive disease who were reported to CDC through national surveillance, 69 (48%) were aged less than 6 months and therefore were too young to have completed a three-dose primary Hib vaccination series (Table_2), and 75 (52%) children were eligible to have completed a primary series (aged greater than or equal to 6 months). Of the 75 children, 48 (64%) were incompletely vaccinated or vaccination status was unknown, and 27 children had completed a primary series; 14 children also had received a booster dose. Five (4%) of 115 children with known outcome and Hib invasive disease died; the deceased children were aged less than 6 months and had received one or no Hib vaccine doses. Reported by: G Rothrock, MPH, Emerging Infections Program, San Francisco; D Vugia, MD, S Waterman, MD, State Epidemiologist, California State Dept of Health Svcs. N Barrett, MS, JL Hadler, MD, State Epidemiologist, Connecticut Dept of Public Health. W Baughman, MSPH, M Farley, MD, D Stephens, MD, Veterans Administration Medical Svcs and Emory Univ School of Medicine, Atlanta; K Toomey, MD, State Epidemiologist, Georgia State Dept of Health. L Billmann, MPH, L Harrison, MD, Johns Hopkins Univ, Baltimore; DM Dwyer, MD, State Epidemiologist, Maryland State Dept of Health and Mental Hygiene. J Rainbow, MPH, M Osterholm, PhD, State Epidemiologist, Minnesota Dept of Health. M Skala, Missouri Dept of Health. LM Smithee, MS, Oklahoma State Dept of Health. K Stefonek, MPH, D Fleming, MD, State Epidemiologist, State Health Div, Oregon Dept of Human Resources. B Barnes, MS, L Lefkowitz, MD, Dept of Preventive Medicine, Vanderbilt Medical Center, Nashville, Tennessee. Meningitis and Special Pathogens Br and Respiratory Diseases Br, Div of Bacterial and Mycotic Diseases, and Active Bacterial Core Surveillance/Emerging Infections Program Network, National Center for Infectious Diseases; Child Vaccine Preventable Disease Br, Epidemiology and Surveillance Div, National Immunization Program, CDC. Editorial NoteEditorial Note: Since 1988, when Hib conjugate vaccines were first licensed for children aged 18-59 months in the United States, with subsequent licensure in 1990 and widespread use in infants, the number of reported Hib invasive disease cases among children aged less than 5 years has declined 99%. However, surveillance data indicate that circulation of Hib continued and that some children remained susceptible to disease; susceptible children include those who do not respond or are too young to complete the primary series of Hib vaccination and those who are unvaccinated or undervaccinated. In the 1997 National Immunization Survey of children aged 19-35 months, the coverage level for receipt of three Hib vaccine doses by age 7 months was 61% (CDC, unpublished data, 1997); by age 24 months, coverage for three doses reached 93% (5 ). High coverage levels will help protect susceptible children in the community by herd immunity (i.e., by less frequent exposure to pharyngeal carriers of the organism) (6). The small number of reported Hib cases among children who had completed a primary Hib vaccine series suggests that vaccine failure occurs infrequently. However, vaccination history was known for only 54 (72%) of the 75 Hib case-patients aged greater than or equal to 6 months. Vaccination history is needed to determine whether Hib invasive disease results from vaccine failure or failure to vaccinate. Protection induced by vaccination is not absolute, and cases will continue to occur as long as the Hib organism circulates in populations. Serotype information for Hi invasive disease cases is essential to monitor progress toward elimination. This information also is needed to monitor nontype b Hi invasive disease to determine whether there is an increase in invasive disease with another serotype or with nontypeable strains, and to measure the sensitivity of the surveillance system. In 1997, information about serotype had been reported for 78% of 258 cases, compared with 41% of 340 cases in 1994 (3). State health departments are encouraged to promote laboratory reporting of Hi cases and to identify laboratories that can perform serotyping on Hi isolates from children aged less than 15 years with invasive disease; if serotyping is not available, state health departments can contact CDC. To strengthen national surveillance, the incidence of nontype b Hi invasive disease among children aged less than 5 years can be used to monitor the sensitivity of reporting; Hi invasive disease caused by any serotype and nontypeable strains, in addition to type b strains, is nationally notifiable (7). Although Hi invasive disease rates may vary by racial/ethnic groups, as was the case in the prevaccine era (1-3,8), the incidence of nontype b Hi invasive disease will occur within an expected range. For example, in California, the two regions of the state with active, laboratory-based surveillance had an incidence rate of nontype b Hi invasive disease of 1.5 per 100,000 children aged less than 5 years (8). In 1996 and 1997, 24 states reported annual rates of greater than or equal to 0.5 nontype b Hi invasive disease cases per 100,000 children aged less than 5 years. Age-appropriate vaccination starting at age 2 months continues to be the most important method to protect children from Hib invasive disease. Health-care providers should emphasize to parents the importance of vaccinating children against Hib invasive disease (9). References
Figure_1 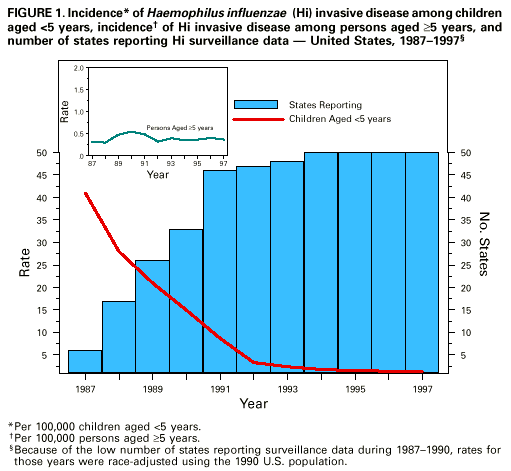 Return to top. Table_1 Note: To print large tables and graphs users may have to change their printer settings to landscape and use a small font size.
TABLE 1. Number and incidence* of  Haemophilus influenzae  (Hi) invasive disease
among children aged <5 years+, by state and serotype -- United States, 1996-1997
======================================================================================
                            Type b               Unknown              Nontype b&
                         ------------------   ------------------   ------------------
State                    No.    (Incidence)   No.    (Incidence)   No.    (Incidence)
--------------------------------------------------------------------------------------
Alabama                    0         ( 0.0)     2          (0.3)     5          (0.8)
Alaska                    15         (15.1)     1          (1.0)     0          (0.0)
Arizona                    6         ( 0.9)     2          (0.3)    20          (2.9)
Arkansas                   1         ( 0.3)     0          (0.0)     0          (0.0)
California                16         ( 0.3)    19          (0.4)    51          (0.9)
Colorado                   5         ( 0.9)     0          (0.0)     6          (1.1)
Connecticut                1         ( 0.2)     2          (0.4)     7          (1.6)
Delaware                   1         ( 1.0)     0          (0.0)     0          (0.0)
District of Columbia       0         ( 0.0)     0          (0.0)     0          (0.0)
Florida                    9         ( 0.5)    16          (0.8)     5          (0.3)
Georgia                    5         ( 0.5)     6          (0.5)    14          (1.3)
Hawaii                     1         ( 0.6)     1          (0.6)     1          (0.6)
Idaho                      0         ( 0.0)     0          (0.0)     0          (0.0)
Illinois                  12         ( 0.7)     4          (0.2)    11          (0.6)
Indiana                    1         ( 0.1)     3          (0.4)     7          (0.9)
Iowa                       1         ( 0.3)     0          (0.0)     2          (0.6)
Kansas                     1         ( 0.3)     0          (0.0)     0          (0.0)
Kentucky                   2         ( 0.4)     0          (0.0)     0          (0.0)
Louisiana                  1         ( 0.2)     1          (0.2)     4          (0.6)
Maine                      0         ( 0.0)     1          (0.7)     0          (0.0)
Maryland                   7         ( 1.0)     3          (0.4)    10          (1.4)
Massachusetts              4         ( 0.5)     0          (0.0)    12          (1.5)
Michigan                   4         ( 0.3)     1          (0.1)     4          (0.3)
Minnesota                  4         ( 0.6)     3          (0.5)    11          (1.7)
Mississippi                0         ( 0.0)     0          (0.0)     0          (0.0)
Missouri                   1         ( 0.1)     0          (0.0)     3          (0.4)
Montana                    0         ( 0.0)     0          (0.0)     2          (1.8)
Nebraska                   0         ( 0.0)     1          (0.4)     0          (0.0)
Nevada                     0         ( 0.0)     1          (0.4)     0          (0.0)
New Hampshire              2         ( 1.3)     1          (0.7)     2          (1.3)
New Jersey                 2         ( 0.2)    13          (1.1)     3          (0.3)
New Mexico                 2         ( 0.7)     1          (0.4)    10          (3.7)
New York                   3         ( 0.2)     3          (0.2)    12          (0.8)
New York City              6         ( 0.5)     2          (0.2)    10          (0.9)
North Carolina             2         ( 0.2)     7          (0.7)     2          (0.2)
North Dakota               0         ( 0.0)     0          (0.0)     0          (0.0)
Ohio                       6         ( 0.4)    15          (1.0)     3          (0.2)
Oklahoma                   1         ( 0.2)     3          (0.7)     7          (1.5)
Oregon                     0         ( 0.0)     0          (0.0)     6          (1.4)
Pennsylvania               4         ( 0.3)     1          (0.1)     6          (0.4)
Rhode Island               1         ( 0.8)     0          (0.0)     1          (0.8)
South Carolina             1         ( 0.2)     1          (0.2)     0          (0.0)
South Dakota               3         ( 2.9)     1          (1.0)     0          (0.0)
Tennessee                  1         ( 0.1)    12          (1.7)     3          (0.4)
Texas                      7         ( 0.2)     0          (0.0)     2          (0.1)
Utah                       1         ( 0.3)     0          (0.0)     3          (0.8)
Vermont                    1         ( 1.4)     0          (0.0)     0          (0.0)
Virginia                   0         ( 0.0)     6          (0.6)     1          (0.1)
Washington                 1         ( 0.1)     4          (0.5)     3          (0.4)
West Virginia              0         ( 0.0)     1          (0.5)     0          (0.0)
Wisconsin                  1         ( 0.2)     0          (0.0)     7          (1.0)
Wyoming                    1         ( 1.6)     0          (0.0)     0          (0.0)

Total                    144         ( 0.4)   138          (0.3)   256          (0.7)
-------------------------------------------------------------------------------------------
*Per 100,000 population. 1996 census data were used to calculate average annual incidence.
+ Number of cases during the 2-year period.
& Includes serotypes a, c, d, e, and f and non-typeable isolates.
===========================================================================================
Return to top. Table_2 Note: To print large tables and graphs users may have to change their printer settings to landscape and use a small font size.
TABLE 2. Haemophilus influenzae type b vaccination status of children aged <5 years
who had Haemophilus influenzae type b (Hib) invasive disease, by age group -- United
States, 1996-1997*
=========================================================================================
                                           No. of doses+
                                     --------------------------
                           Unknown
                       vaccination
Age (mos)    Total          status    0     1    2     3     4
---------------------------------------------------------------
 0- 1           25               1   24    --   --    --    --
 2- 3           23               3    9    11   --    --    --
 4- 5           21               3    3    10    5    --    --
 6-11           27               7    6     3    6     5    --
12-59           48              14    8     3    1    10    12

Total          144              28   50    27   12    15    12
---------------------------------------------------------------
*Number of cases during the 2-year period.
+ A primary series was completed by 27 children; 25 received a three-dose series and two
received a two-dose series.
=========================================================================================
Return to top. Disclaimer All MMWR HTML versions of articles are electronic conversions from ASCII text into HTML. This conversion may have resulted in character translation or format errors in the HTML version. Users should not rely on this HTML document, but are referred to the electronic PDF version and/or the original MMWR paper copy for the official text, figures, and tables. An original paper copy of this issue can be obtained from the Superintendent of Documents, U.S. Government Printing Office (GPO), Washington, DC 20402-9371; telephone: (202) 512-1800. Contact GPO for current prices. **Questions or messages regarding errors in formatting should be addressed to mmwrq@cdc.gov.Page converted: 11/25/98 |
|||||||||
This page last reviewed 5/2/01
|