 |
|
|
|
|
|
|
| ||||||||||
|
|
|
|
|
|
|
||||
| ||||||||||
|
|
|
|
|
Persons using assistive technology might not be able to fully access information in this file. For assistance, please send e-mail to: mmwrq@cdc.gov. Type 508 Accommodation and the title of the report in the subject line of e-mail. Incidence of Foodborne Illnesses -- FoodNet, 1997Each year, millions of persons become ill from foodborne diseases, though many cases are not reported. The Foodborne Diseases Active Surveillance Network (FoodNet), the primary foodborne diseases component of CDC's Emerging Infections Program (1), was developed to better characterize, understand, and respond to foodborne illnesses in the United States. This report describes FoodNet surveillance data from 1997, the second year of surveillance, and compares findings with data from 1996. The findings demonstrate regional and seasonal differences in the reported incidence of certain bacterial and parasitic diseases and that substantial changes occurred in the incidence of illnesses caused by some pathogens (e.g., Vibrio and Escherichia coli O157:H7) but the overall incidence of illness caused by the seven diseases under surveillance in both years changed little. Active bacterial surveillance for laboratory-confirmed cases of Campylobacter, E. coli O157:H7, Listeria, Salmonella, Shigella, Vibrio, and Yersinia infections was initiated on January 1, 1996, in Minnesota, Oregon, and two counties in California, three in Connecticut, and eight in Georgia (expanding to 20 counties in 1997). In 1997, surveillance for laboratory-confirmed cases of Cryptosporidium and Cyclospora infections was added statewide in Minnesota, Connecticut, and eight counties (including the two counties with bacterial surveillance) in California. To identify cases, surveillance personnel contacted each clinical laboratory in their catchment areas either weekly or monthly, depending on the size of the clinical laboratory. Annual incidence was calculated using the number of laboratory-confirmed cases ascertained in the catchment area as the numerator and 1997 postcensus estimates in the same areas as the denominator (2). Monthly incidence was calculated based on date of specimen collection. 1997 Surveillance In 1997, 8576 laboratory-confirmed cases were identified: 3974 of campylobacteriosis, 2205 of salmonellosis, 1273 of shigellosis, 468 of cryptosporidiosis, 340 of E. coli O157:H7 infections, 139 of yersiniosis, 77 of listeriosis, 51 of Vibrio infections, and 49 of cyclosporiasis. Seasonal variation in isolation rates was seen for several pathogens; 52% of E. coli O157:H7, 35% of Campylobacter, and 32% of Salmonella were isolated in summer months (June-August) (Figure_1). Organisms were isolated from normally sterile sites, including blood and cerebrospinal fluid, in 99% of reported Listeria cases, 7% of Salmonella cases, 3% of Yersinia cases, and less than 1% of Shigella and Campylobacter cases. Overall, 1270 (15%) of 8576 patients with laboratory- confirmed infections were hospitalized; the proportion of persons with cases hospitalized was highest for listeriosis (88%), E. coli O157:H7 infections (29%), and salmonellosis (21%). Thirty-six patients with laboratory-confirmed infections died: 15 with Listeria, 13 with Salmonella, four with E. coli O157:H7, two with Cryptosporidium, one with Campylobacter, and one with Shigella. All-site incidence was highest for campylobacteriosis (24.7 per 100,000 population), salmonellosis (13.7), and shigellosis (7.8). The incidence of campylobacteriosis varied from 13.7 in Georgia to 49.3 in California. Although overall salmonellosis incidence was similar among the sites, the incidence of infections with Salmonella serotype Enteritidis varied, from 0.6 in Georgia to 5.8 in Connecticut. Shigellosis incidence varied from 2.9 in Minnesota to 15.9 in Georgia. Incidence differed by site for E. coli O157:H7 infections and yersiniosis: E. coli O157:H7 infections varied from 0.2 in Georgia to 4.2 in Minnesota; yersiniosis varied from 0.5 in Oregon to 1.2 in Georgia. Annual incidence also varied by age; for example, the incidence among children aged less than 1 year was 56 per 100,000 for campylobacteriosis (range: 18 in Georgia to 159 in California) and 111 per 100,000 for salmonellosis (range: 66 in Oregon to 174 in California) (Figure_2). Comparison with 1996 Surveillance Data Overall, incidence of illness caused by the pathogens under surveillance changed little from 1996 to 1997 (Table_1). The largest percentage change occurred in cases of illness caused by Vibrio (from 0.1 in 1996 to 0.3 in 1997). E. coli O157:H7 showed the next largest percentage change (from 2.7 to 2.1, a decrease of 27%). From 1996 to 1997, Minnesota and Oregon reported an overall increase in the incidence of illnesses caused by the pathogens under surveillance; California, Connecticut, and Georgia reported decreases. Reported by: S Shallow, MPH, P Daily, MPH, G Rothrock, MPH, California Emerging Infections Program; A Reingold, MD, Univ of California at Berkeley; D Vugia, MD, S Waterman, MD, State Epidemiologist, California Dept of Health Svcs. T Fiorentino, MPH, R Marcus, MPH, R Ryder, MD, School of Medicine, Yale Univ, New Haven; P Mshar, M Cartter, MD, J Hadler, MD, State Epidemiologist, Connecticut State Dept of Public Health. M Farley, MD, M Bardsley, MPH, W Baughman, MSPH, Atlanta Metropolitan Active Surveillance Project. J Koehler, DVM, P Blake, MD, K Toomey, MD, State Epidemiologist, Div of Public Health, Georgia Dept of Human Resources. J Wicklund, MPH, C Hedberg, PhD, M Osterholm, PhD, State Epidemiologist, Minnesota Dept of Public Health. M Cassidy, T McGivern, R Stanton, B Shiferaw, MD, P Cieslak, MD, D Fleming, MD, State Epidemiologist, State Health Div, Oregon Dept of Human Resources. Food Safety Inspection Svc, US Dept of Agriculture. Center for Food Safety and Applied Nutrition, Food and Drug Administration. Foodborne and Diarrheal Diseases Br, Div of Bacterial and Mycotic Diseases, and Epidemiology Br, Div of Parasitic Diseases, and Office of the Director, National Center for Infectious Diseases, CDC. Editorial NoteEditorial Note: The findings from FoodNet in 1997 document regional and seasonal differences in the incidence of bacterial foodborne diseases. Although the pathogens under surveillance can be transmitted many ways (e.g., through water and person-to-person), they are often transmitted by food. The primary goals of FoodNet are to better characterize, understand, and respond to foodborne illness in the United States. Some of the variation in the incidence of bacterial foodborne diseases might be explained by differences in levels of contamination of specific food items and differences in foodhandling practices. The variation in the regional incidence of Campylobacter and Salmonella is unlikely to be a result of different laboratory culturing practices because the proportion of specimens tested for these pathogens remained consistently high across the sites ( greater than 99%). The possible role of differences in requests for cultures by physicians resulting in the regional variation in the incidence of disease is under investigation. More data are needed to assess whether the variations in rates for specific pathogens reflect year-to-year variation or are part of longer-term trends. For Vibrio, the increase in incidence is the result of a large outbreak during the summer of 1997 of Vibrio parahaemolyticus infections linked to raw oyster consumption in the Pacific Northwest (3). The decrease in the incidence of E. coli O157:H7 infections in 1997 probably is linked to fewer cases associated with known outbreaks in FoodNet catchment areas. Changes in the pathogens under surveillance (e.g., the development of fluoroquinolone resistance in Campylobacter {4}) are not reflected in annual incidence data. Additional investigations -- including laboratory, physician, and population surveys and pathogen-specific case-control studies (5) -- are under way to further characterize annual differences in incidence. Preliminary data (using 1997 population estimates as the denominator) reported to FoodNet through the first 6 months of 1998 show a decrease in Campylobacter and Salmonella infections and an increase in E. coli O157:H7, Vibrio, and Yersinia infections compared with the first 6 months of 1996 and 1997. Final data will be available when the annual number of cases is known (usually available by April, allowing for auditing) and the postcensus population estimates are released (typically by mid-year). A preliminary report will be available in early 1999. FoodNet was initiated in 1995 as a collaborative effort among CDC, the U.S. Department of Agriculture, the Food and Drug Administration, and the California, Connecticut, Georgia, Minnesota, and Oregon state health departments. In 1997, the catchment area included 16.1 million persons, 6.0% of the U.S. population. Two new sites (selected counties in Maryland and in New York) joined FoodNet in 1997; data from these sites will be included in subsequent reports. An eighth site will be added in 1998. Continued monitoring of the incidence of foodborne illnesses and analysis of FoodNet data will provide a more accurate description and a better understanding of foodborne illness in this country. Additional information about FoodNet, which includes the 1997 summary report, is available on the World-Wide Web at http://www.cdc.gov/ ncidod/dbmd/foodnet/foodnet.htm. References
Figure_1 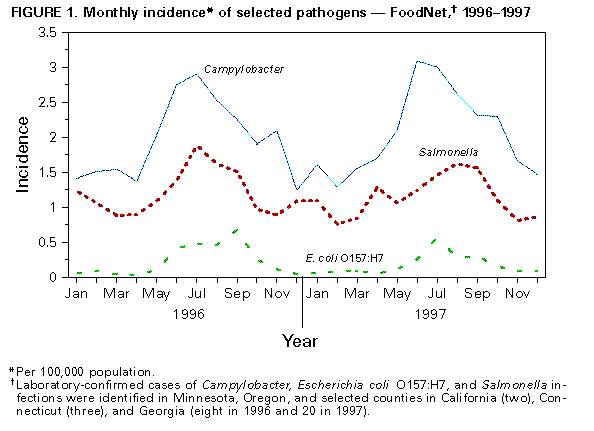 Return to top. Figure_2 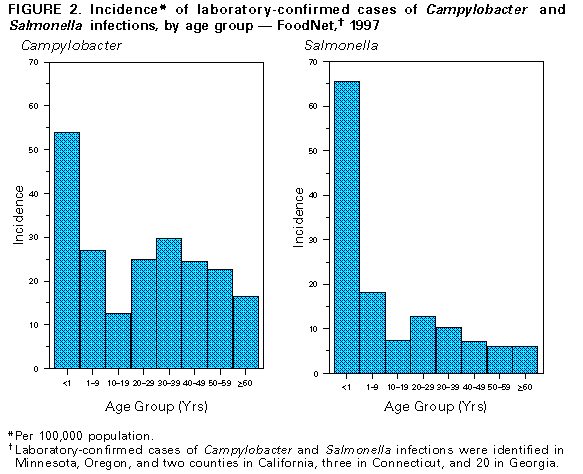 Return to top. Table_1 Note: To print large tables and graphs users may have to change their printer settings to landscape and use a small font size.
TABLE 1. Incidence* of selected pathogens, by year --
FoodNet,+ 1996-1997
=========================================================
                                  All sites
                             -------------------
Organism                      1996         1997
---------------------------------------------------------
Campylobacter                 23.5         24.7
Escherichia coli  O157:H7      2.7          2.1
Listeria                       0.5          0.5
Salmonella                    14.5         13.7
Shigella                       8.9          7.9
Vibrio                         0.1          0.3
Yersinia                       1.0          0.9
Cryptosporidium                 &           2.8
Cyclospora                      &           0.3

Overall                       51.2         50.1@
---------------------------------------------------------
* Per 100,000 population.
+ In 1996, laboratory-confirmed cases of Campylobacter,
  Escherichia coli O157:H7, Listeria, Salmonella,
  Shigella, Vibrio, and Yersinia infections were
  identified in Minnesota, Oregon, and two counties in
  California, three in Connecticut, and eight in Georgia
  (expanding to 20 in 1997). In 1997, surveillance for
  laboratory-confirmed cases of Cryptosporidium and
  Cyclospora infections was added statewide in Minnesota
  and Connecticut and in eight counties (including
  the two counties with bacterial surveillance) in
  California.
& Not reported in 1996.
@ Excludes Cryptosporidium and Cyclospora.
=========================================================
Return to top. Disclaimer All MMWR HTML versions of articles are electronic conversions from ASCII text into HTML. This conversion may have resulted in character translation or format errors in the HTML version. Users should not rely on this HTML document, but are referred to the electronic PDF version and/or the original MMWR paper copy for the official text, figures, and tables. An original paper copy of this issue can be obtained from the Superintendent of Documents, U.S. Government Printing Office (GPO), Washington, DC 20402-9371; telephone: (202) 512-1800. Contact GPO for current prices. **Questions or messages regarding errors in formatting should be addressed to mmwrq@cdc.gov.Page converted: 10/06/98 |
|||||||||
This page last reviewed 5/2/01
|