 |
|
|
|
|
|
|
| ||||||||||
|
|
|
|
|
|
|
||||
| ||||||||||
|
|
|
|
|
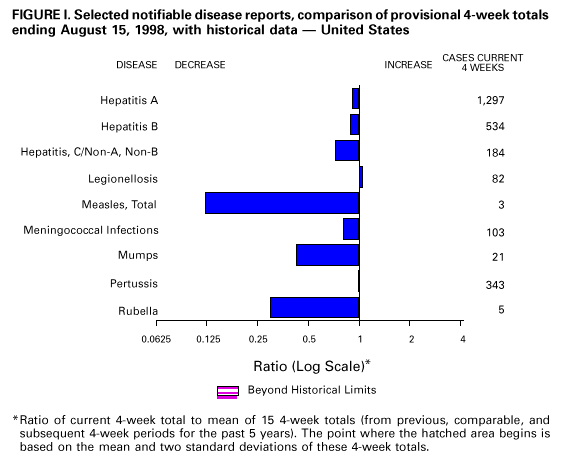
Persons using assistive technology might not be able to fully access information in this file. For assistance, please send e-mail to: mmwrq@cdc.gov. Type 508 Accommodation and the title of the report in the subject line of e-mail. Notifiable Diseases/Deaths in Selected Cities Weekly InformationFigure_I Selected notifiable disease reports, comparison of provisional 4-week totals ending August 15, 1998, with historical data -- United States Table_I Summary -- provisional cases of selected notifiable diseases, United States, cumulative, week ending August 15, 1998 (32nd Week) Table_II Provisional cases of selected notifiable diseases, United States, weeks ending August 15, 1998 and August 9, 1997 (32nd Week) Table_III Provisional cases of selected notifiable diseases preventable by vaccination, United States, weeks ending August 15, 1998 and August 9, 1997 (32nd Week) Table_IV Deaths in 122 U.S. cities, week ending
August 15, 1998 (32nd Week)
TABLE I. Summary -- provisional cases of specified notifiable diseases, United
States, cumulative, week ending August 15, 1998 (32nd Week)
==================================================================================
                                             Cum. 1998
------------------------------------------------------
Anthrax                                              -
Brucellosis                                         46
Cholera                                              6
Congenital rubella syndrome                          3
Cryptosporidiosis*                               1,248
Diphtheria                                           2
Encephalitis:  California*                          21
               eastern equine*                       2
               St. Louis*                            1
               western equine*                       -
Hansen Disease                                      69
Hantavirus pulmonary syndrome*+                      9
Hemolytic uremic syndrome, post-diarrheal*          38
HIV infection, pediatric*&                         145
Plague                                               6
Poliomyelitis, paralytic                             1
Psittacosis                                         27
Rabies, human                                        -
Rocky Mountain spotted fever (RMSF)                158
Streptococcal disease, invasive Group A          1,461
Streptococcal toxic-shock syndrome*                 39
Syphilis, congenital@                              185
Tetanus                                             21
Toxic-shock syndrome                                78
Trichinosis                                          9
Typhoid fever                                      187
Yellow fever                                         -
------------------------------------------------------
-: no reported cases
 * Not notifiable in all states
 + Updated weekly from reports to the Division of Viral and Rickettsial
   Diseases, National Center for Infectious Diseases (NCID).
 & Updated monthly to the Division of HIV/AIDS Prevention -- Surveillance
   and Epidemiology, National Center for HIV, STD, and TB Prevention
   (NCHSTP), last update July 26, 1998.
** Updated from reports to the Division of STD Prevention, NCHSTP.

==================================================================================
Return to top. Table_II Note: To print large tables and graphs users may have to change their printer settings to landscape and use a small font size.
TABLE II. (page 1) Provisional cases of selected notifiable diseases, United States, weeks ending
August 15, 1998, and August 9, 1997 (32nd Week)
Escherichia
coli O157:H7
------------------- Hepatitis
AIDS* Chlamydia NETSS** PHLIS*** Gonorrhea C\NA,NB
----------------- -------------------- -------- -------- ------------------- ----------------
Cum. Cum. Cum. Cum. Cum. Cum. Cum. Cum. Cum. Cum.
Reporting Area 1998 1997 1998 1997 1998 1998 1998 1997 1998 1997
------------------------------------------------------------------------------------------------------------------------------
UNITED STATES 27,399 35,436 330,087 275,168 1,436 817 197,164 172,758 2,303 2,152
NEW ENGLAND 1,025 1,470 12,094 10,559 180 135 3,413 3,572 32 41
Maine 21 36 631 589 21 - 41 36 - -
N.H. 26 19 570 479 23 32 54 64 - -
Vt. 14 24 258 236 10 7 23 32 - 2
Mass. 522 528 5,002 4,362 94 80 1,228 1,335 29 32
R.I. 78 97 1,448 1,187 5 1 219 278 3 7
Conn. 364 766 4,185 3,706 27 15 1,848 1,827 - -
MID. ATLANTIC 7,578 11,061 39,372 34,044 140 36 22,253 21,995 247 206
Upstate N.Y. 961 1,728 N N 106 - 3,637 3,845 193 150
N.Y. City 4,074 5,735 21,086 16,302 4 7 9,172 8,091 - -
N.J. 1,475 2,273 6,403 5,969 30 28 3,933 4,453 - -
Pa. 1,068 1,325 11,883 11,773 N 1 5,511 5,606 54 56
E.N. CENTRAL 2,078 2,556 54,394 36,809 225 149 37,672 23,676 325 365
Ohio 430 561 15,545 13,481 55 22 9,877 8,640 7 12
Ind. 355 394 3,678 5,500 57 28 2,363 3,632 4 11
Ill. 825 892 15,848 U 55 14 12,850 U 20 64
Mich. 353 545 13,174 11,224 58 35 10,051 8,633 294 257
Wis. 115 164 6,149 6,604 N 50 2,531 2,771 - 21
W.N. CENTRAL 532 696 18,686 19,044 221 165 9,269 8,493 114 42
Minn. 104 128 3,649 3,997 86 78 1,300 1,402 7 3
Iowa 49 74 2,063 2,650 66 32 660 720 6 21
Mo. 244 331 7,161 7,220 15 29 5,233 4,588 96 6
N. Dak. 4 7 290 508 6 11 29 32 - 2
S. Dak. 11 3 984 763 15 10 154 82 - -
Nebr. 48 65 1,375 1,169 19 - 495 440 2 2
Kans. 72 88 3,164 2,737 14 5 1,398 1,229 3 8
S. ATLANTIC 6,869 8,699 66,814 57,451 124 79 54,859 55,951 122 148
Del. 91 159 1,512 - - 1 829 720 - -
Md. 826 1,078 5,071 4,255 19 9 5,941 6,990 6 4
D.C. 567 658 N N 1 - 2,229 2,660 - -
Va. 502 719 7,239 7,165 N 25 4,367 4,874 9 18
W. Va. 59 60 1,686 1,778 7 3 479 581 4 13
N.C. 456 503 13,193 10,421 23 31 11,370 10,223 15 38
S.C. 452 475 11,394 7,568 5 2 7,369 6,802 3 27
Ga. 725 1,071 14,314 10,741 45 - 12,263 12,214 9 -
Fla. 3,191 3,976 12,405 15,523 24 8 10,012 10,887 76 48
E.S. CENTRAL 1,084 1,188 24,319 20,866 74 27 23,560 20,861 108 229
Ky. 156 211 3,822 3,993 20 - 2,189 2,508 16 10
Tenn. 378 495 8,001 7,806 32 24 6,912 6,556 87 155
Ala. 330 287 6,349 4,896 19 2 8,045 6,995 5 6
Miss. 220 195 6,147 4,171 U 1 6,414 4,802 U 58
W.S. CENTRAL 3,328 3,601 50,306 35,796 80 12 29,242 23,463 556 286
Ark. 123 131 2,129 1,805 6 6 1,220 2,955 5 9
La. 586 640 8,967 5,671 3 2 7,808 5,301 21 128
Okla. 183 188 6,147 4,546 11 4 3,371 2,873 8 6
Tex. 2,436 2,642 33,063 23,774 60 - 16,843 12,334 522 143
MOUNTAIN 967 1,032 13,426 17,564 199 87 4,980 4,804 259 185
Mont. 18 26 739 653 10 - 26 27 7 14
Idaho 19 34 1,066 890 23 7 107 68 86 36
Wyo. 1 13 399 351 49 - 18 36 46 43
Colo. 186 264 10 3,899 37 33 1,339 1,269 18 21
N. Mex. 153 105 2,235 2,333 16 11 550 538 64 33
Ariz. 377 247 6,919 6,606 21 13 2,477 2,150 3 23
Utah 70 86 1,415 990 37 15 153 145 21 3
Nev. 143 257 643 1,842 6 8 310 571 14 12
PACIFIC 3,938 5,133 50,676 43,035 193 127 11,916 9,943 540 650
Wash. 270 417 6,582 5,525 31 22 1,132 1,162 12 19
Oreg. 116 188 3,432 2,971 60 61 494 461 2 2
Calif. 3,439 4,449 38,229 32,607 99 35 9,839 7,779 471 522
Alaska 17 42 1,158 876 3 - 193 236 1 -
Hawaii 96 37 1,275 1,056 N 9 258 305 54 107
Guam - 2 8 193 N - 2 27 - -
P.R. 1,141 1,198 U U 2 U 245 392 - -
V.I. 18 70 N N N U U U U U
Amer. Samoa - - U U N U U U U U
C.N.M.I. - 1 N N N U 14 17 - 2
------------------------------------------------------------------------------------------------------------------------------
N: Not notifiable U: Unavailable -: no reported cases C.N.M.I.: Commonwealth of North Mariana Islands
* Updated monthly to the Division of HIV/AIDS Prevention, -- Surveillance and Epidemiology, National Center for HIV, STD,
and TB Prevention, last update July 26, 1998.
** National Electronic Telecommunications System for Surveillance.
*** Public Health Laboratory Information System.
=======================================================================================================================================================
TABLE II. (page 2) Provisional cases of selected notifiable diseases, United States, weeks ending
August 15, 1998, and August 9, 1997 (32nd Week)
Lyme Syphilis Rabies,
Legionellosis Disease Malaria (Primary & Secondary) Tuberculosis Animal
---------------- ---------------- ---------------- --------------------- ----------------- -------
Cum. Cum. Cum. Cum. Cum. Cum. Cum. Cum. Cum. Cum. Cum.
Reporting Area 1998 1997 1998 1997 1998 1997 1998 1997 1998 * 1997 1998
-------------------------------------------------------------------------------------------------------------------------------------------
UNITED STATES 695 533 6,116 5,714 725 1,060 4,431 5,146 7,395 10,759 4,225
NEW ENGLAND 39 42 1,932 1,622 41 47 42 100 254 266 835
Maine 1 2 6 8 4 1 1 - 5 16 126
N.H. 3 4 27 9 3 2 1 - 6 10 37
Vt. 4 8 6 6 - 2 4 - 1 4 38
Mass. 15 12 462 224 14 23 25 47 135 147 281
R.I. 8 5 266 194 2 5 1 2 34 19 52
Conn. 8 11 1,165 1,181 18 14 10 51 73 70 301
MID. ATLANTIC 166 95 3,488 2,882 177 326 160 249 1,712 1,946 980
Upstate N.Y. 52 27 2,031 1,102 52 47 22 24 194 262 693
N.Y. City 23 9 12 129 82 200 34 56 907 985 U
N.J. 7 14 646 939 22 59 53 102 361 394 118
Pa. 84 45 799 712 21 20 51 67 250 305 169
E.N. CENTRAL 210 179 62 503 65 100 592 401 644 1,097 82
Ohio 86 76 43 21 4 12 80 133 U 176 41
Ind. 38 29 13 17 6 9 144 99 76 90 5
Ill. 16 13 5 9 22 42 225 U 393 590 9
Mich. 47 40 1 17 31 25 104 93 172 168 19
Wis. 23 21 U 439 2 12 39 76 3 73 8
W.N. CENTRAL 44 35 76 57 52 32 87 113 241 337 476
Minn. 3 1 53 32 26 10 6 14 90 90 84
Iowa 6 9 17 4 6 8 - 6 20 38 108
Mo. 14 5 1 15 10 7 68 67 86 131 19
N. Dak. - 2 - - 2 2 - - 3 8 98
S. Dak. 2 2 - 1 - - 1 - 14 7 90
Nebr. 15 12 3 2 1 1 4 2 10 14 5
Kans. 4 4 2 3 7 4 8 24 18 49 72
S. ATLANTIC 85 70 405 448 168 180 1,841 2,090 1,273 1,954 1,265
Del. 8 7 12 90 1 2 16 16 U 20 17
Md. 20 14 267 286 51 56 411 568 180 190 318
D.C. 6 3 4 7 12 10 49 77 67 59 -
Va. 10 15 38 24 32 44 99 153 174 194 376
W. Va. N N 8 3 1 - 2 3 27 37 57
N.C. 6 9 37 21 12 10 460 496 263 251 136
S.C. 7 3 3 1 4 10 179 237 185 210 98
Ga. 4 - 5 1 20 21 483 346 307 363 135
Fla. 23 19 31 15 35 27 142 194 70 630 128
E.S. CENTRAL 43 36 49 54 18 22 746 1,123 634 812 185
Ky. 19 7 11 12 3 6 72 91 113 113 26
Tenn. 12 22 26 24 9 6 355 484 223 298 98
Ala. 5 2 12 4 4 7 169 277 162 250 59
Miss. U 5 U 14 U 3 150 271 136 151 U
W.S. CENTRAL 20 12 19 51 20 13 617 749 248 1,592 119
Ark. - 1 6 14 1 2 71 112 73 124 27
La. 2 2 3 2 6 8 255 230 U 135 -
Okla. 8 1 2 9 2 3 36 72 102 135 92
Tex. 10 8 8 26 11 - 255 335 - 1,198 -
MOUNTAIN 42 33 10 7 36 50 142 102 251 338 103
Mont. 2 1 - - - 2 - - 12 6 35
Idaho 2 2 3 2 7 - - - 8 7 -
Wyo. 1 1 - 1 - 2 1 - 3 2 46
Colo. 8 9 3 - 11 24 8 8 U 57 1
N. Mex. 2 2 2 1 11 7 19 4 34 32 3
Ariz. 10 8 - 1 6 7 108 78 124 156 11
Utah 16 6 - - 1 3 3 4 36 14 7
Nev. 1 4 2 2 - 5 3 8 34 64 -
PACIFIC 46 31 75 90 148 290 204 219 2,138 2,417 180
Wash. 8 6 5 5 14 13 23 7 144 191 -
Oreg. - - 9 12 13 15 3 5 72 102 1
Calif. 37 24 60 73 118 254 178 205 1,792 1,949 157
Alaska - - 1 - 1 3 - 1 32 53 22
Hawaii 1 1 - - 2 5 - 1 98 122 -
Guam - - - - - - - 3 - 13 -
P.R. - - - - - 4 122 154 46 129 33
V.I. U U U U U U U U U U U
Amer. Samoa U U U U U U U U U U U
C.N.M.I. - - - - - - 98 9 54 2 -
-------------------------------------------------------------------------------------------------------------------------------------------
N: Not notifiable U: Unavailable -: no reported cases
* Additional information about areas displaying 'U' for cumulative Tuberculosis cases can be found in Notices to Readers, MMWR Vol. 47, No. 2, p. 39.
=======================================================================================================================================================
Return to top. Table_III Note: To print large tables and graphs users may have to change their printer settings to landscape and use a small font size.
TABLE III. (page 1) Provisional cases of selected notifiable diseases preventable by vaccination, United
States, weeks ending August 15, 1998, and August 9, 1997 (32nd Week)
Hepatitis (Viral), by type Measles (Rubeola)
H. influenzae, --------------------------------------- ------------------------------------------------------------
invasive A B Indigenous Imported** Total
---------------- ----------------- ----------------- --------------- --------------- ---------------
Cum. Cum. Cum. Cum. Cum. Cum. Cum. Cum. Cum. Cum.
Reporting Area 1998* 1997 1998 1997 1998 1997 1998 1998 1998 1998 1998 1997
-----------------------------------------------------------------------------------------------------------------------------------------------------
UNITED STATES 690 715 13,345 17,040 4,978 5,723 - 28 - 19 47 102
NEW ENGLAND 38 40 158 433 85 106 - 1 - 2 3 19
Maine 2 3 13 45 2 6 - - - - - 1
N.H. 7 6 8 21 10 7 - - - - - 1
Vt. 4 3 13 8 3 5 - - - 1 1 -
Mass. 22 24 50 184 22 45 - 1 - 1 2 16
R.I. 2 2 11 95 48 11 - - - - - -
Conn. 1 2 63 80 - 32 - - - - - 1
MID. ATLANTIC 95 104 907 1,349 712 835 - 9 - 4 13 22
Upstate N.Y. 39 27 218 199 189 176 - 2 - - 2 5
N.Y. City 18 28 221 606 181 314 - - - - - 7
N.J. 33 34 218 195 135 158 - 7 - 1 8 3
Pa. 5 15 250 349 207 187 - - - 3 3 7
E.N. CENTRAL 114 118 1,852 1,742 516 925 - 11 - 3 14 8
Ohio 40 66 207 218 47 55 - - - 1 1 -
Ind. 27 11 101 191 64 71 - 2 - 1 3 -
Ill. 40 27 312 462 102 178 - - - - - 6
Mich. 3 14 1,116 741 280 263 - 9 - 1 10 2
Wis. 4 - 116 130 23 358 - - - - - -
W.N. CENTRAL 64 37 966 1,285 248 310 - - - - - 12
Minn. 49 27 83 111 24 23 - - - - - 3
Iowa 2 4 372 226 42 23 - - - - - -
Mo. 8 3 391 676 151 227 U - U - - 1
N. Dak. - - 3 10 4 4 - - - - - -
S. Dak. - 2 18 17 1 1 - - - - - 8
Nebr. - 1 24 52 9 9 - - - - - -
Kans. 5 - 75 193 17 23 - - - - - -
S. ATLANTIC 144 113 1,153 1,021 735 740 - 3 - 5 8 9
Del. - - 3 21 - 4 - - - 1 1 -
Md. 41 44 197 133 100 106 - - - 1 1 2
D.C. - - 36 16 8 25 - - - - - 1
Va. 13 9 146 137 66 78 - - - 2 2 1
W. Va. 4 3 1 6 4 9 - - - - - -
N.C. 21 17 67 121 140 161 - - - - - 1
S.C. 3 3 18 72 22 62 - - - - - 1
Ga. 30 22 342 230 120 83 - 1 - 1 2 1
Fla. 32 15 343 285 275 212 - 2 - - 2 2
E.S. CENTRAL 43 40 261 407 245 413 - - - 2 2 1
Ky. 6 6 15 51 27 26 - - - - - -
Tenn. 25 24 153 254 171 280 - - - - - -
Ala. 10 8 50 58 47 43 - - - 2 2 1
Miss. U 2 U 44 U 64 U U U U U -
W.S. CENTRAL 39 33 2,557 3,496 835 728 - - - - - 7
Ark. - 2 67 145 54 56 - - - - - -
La. 18 7 51 136 63 93 - - - - - -
Okla. 19 22 373 988 58 25 - - - - - -
Tex. 2 2 2,066 2,227 660 554 - - - - - 7
MOUNTAIN 73 66 2,074 2,639 535 547 - - - - - 7
Mont. - - 67 56 5 6 - - - - - -
Idaho - 1 174 87 21 17 - - - - - -
Wyo. 1 2 26 21 2 17 - - - - - -
Colo. 15 11 163 273 71 102 U - U - - -
N. Mex. 5 7 100 209 220 177 - - - - - -
Ariz. 41 27 1,325 1,314 135 125 - - - - - 5
Utah 4 3 134 401 50 64 - - - - - -
Nev. 7 15 85 278 31 39 - - - - - 2
PACIFIC 80 164 3,417 4,668 1,067 1,119 - 4 - 3 7 17
Wash. 7 3 696 328 71 48 U - U 1 1 1
Oreg. 33 26 239 237 70 68 - - - - - -
Calif. 32 126 2,440 3,986 913 984 - 4 - 2 6 12
Alaska 1 2 14 25 8 11 - - - - - -
Hawaii 7 7 28 92 5 8 - - - - - 4
Guam - - - - - 3 U - U - - -
P.R. 2 - 38 202 268 469 - - - - - -
V.I. U U U U U U U U U U U U
Amer. Samoa U U U U U U U U U U U U
C.N.M.I. - 6 1 1 28 34 U - U - - 1
-----------------------------------------------------------------------------------------------------------------------------------------------------
N: Not notifiable U: Unavailable -: no reported cases
* Of 158 cases among children aged <5 years, serotype was reported for 85 and of those, 33 were type b.
** For imported measles, cases include only those resulting from importation from other countries.
=======================================================================================================================================================
TABLE III. (page 2) Provisional cases of selected notifiable diseases preventable by vaccination, United
States, weeks ending August 15, 1998, and August 9, 1997 (32nd Week)
Meningococcal
Disease Mumps Pertussis Rubella
----------------- -------------------------- --------------------------- ---------------------------
Cum. Cum. Cum. Cum. Cum. Cum. Cum. Cum.
Reporting Area 1998 1997 1998 1998 1997 1998 1998 1997 1998 1998 1997
------------------------------------------------------------------------------------------------------------------------------------------
UNITED STATES 1,772 2,247 6 303 397 82 2,949 3,241 - 295 125
NEW ENGLAND 75 139 - 2 8 4 520 615 - 36 1
Maine 5 15 - - - - 5 7 - - -
N.H. 4 12 - - - - 40 71 - - -
Vt. 1 3 - - - 2 57 181 - - -
Mass. 37 71 - 1 2 - 384 332 - 6 1
R.I. 3 12 - - 5 2 7 12 - 1 -
Conn. 25 26 - 1 1 - 27 12 - 29 -
MID. ATLANTIC 164 236 - 18 45 3 314 242 - 124 28
Upstate N.Y. 44 64 - 3 10 3 162 91 - 110 4
N.Y. City 18 41 - 4 3 - 9 55 - 9 24
N.J. 43 44 - 2 7 - 5 11 - 4 -
Pa. 59 87 - 9 25 - 138 85 - 1 -
E.N. CENTRAL 267 329 1 54 49 30 281 323 - - 5
Ohio 96 121 - 21 18 30 120 95 - - -
Ind. 50 35 1 6 6 - 68 35 - - -
Ill. 66 96 - 7 8 - 35 45 - - 1
Mich. 31 48 - 20 14 - 41 32 - - -
Wis. 24 29 - - 3 - 17 116 - - 4
W.N. CENTRAL 146 165 - 21 12 11 255 199 - 27 -
Minn. 25 29 - 10 5 10 159 132 - - -
Iowa 27 38 - 7 6 - 52 10 - - -
Mo. 53 71 U 3 - U 16 33 U 2 -
N. Dak. 2 1 - 1 - - 2 1 - - -
S. Dak. 6 4 - - - - 6 3 - - -
Nebr. 7 6 - - 1 - 8 4 - - -
Kans. 26 16 - - - 1 12 16 - 25 -
S. ATLANTIC 311 381 4 39 47 7 181 293 - 9 58
Del. 1 5 - - - - 2 1 - - -
Md. 24 36 - - 1 - 31 94 - - -
D.C. - 6 - - - - 1 3 - - -
Va. 24 38 - 5 9 - 8 34 - - 1
W. Va. 12 14 - - - - 1 5 - - -
N.C. 46 74 - 9 7 3 68 80 - 6 50
S.C. 44 40 1 5 10 - 22 14 - - 6
Ga. 66 75 - 1 6 - 10 8 - - -
Fla. 94 93 3 19 14 4 38 54 - 3 1
E.S. CENTRAL 153 165 - 11 21 2 71 79 - 1 1
Ky. 19 38 - - 3 - 22 30 - - -
Tenn. 47 58 - 1 3 - 24 26 - - -
Ala. 66 52 - 6 6 2 22 16 - 1 1
Miss. U 17 U U 9 U U 7 U U -
W.S. CENTRAL 198 217 - 40 44 1 202 127 - 80 3
Ark. 25 25 - - 1 1 28 10 - - -
La. 44 46 - 8 11 - 2 13 - - -
Okla. 30 24 - - - - 18 17 - - -
Tex. 99 122 - 32 32 - 154 87 - 80 3
MOUNTAIN 100 130 - 27 49 15 609 823 - 5 6
Mont. 3 7 - - - - 3 15 - - -
Idaho 7 8 - 3 2 2 196 473 - - 2
Wyo. 5 1 - 1 1 - 8 6 - - -
Colo. 19 35 U 8 3 U 129 224 U - -
N. Mex. 17 22 N N N - 74 57 - 1 -
Ariz. 34 33 - 5 31 7 139 23 - 1 4
Utah 11 11 - 3 6 1 37 12 - 2 -
Nev. 4 13 - 7 6 5 23 13 - 1 -
PACIFIC 358 485 1 91 122 9 516 540 - 13 23
Wash. 50 59 U 7 14 U 193 224 U 9 5
Oreg. 61 94 N N N 6 44 24 - - -
Calif. 241 326 - 65 86 - 268 271 - 2 10
Alaska 2 2 - 2 5 2 5 6 - - -
Hawaii 4 4 1 17 17 1 6 15 - 2 8
Guam - 1 U - 1 U - - U - -
P.R. 6 8 - 1 5 - 2 - - - -
V.I. U U U U U U U U U U U
Amer. Samoa U U U U U U U U U U U
C.N.M.I. - - U 2 4 U 1 - U - -
------------------------------------------------------------------------------------------------------------------------------------------
N: Not notifiable U: Unavailable -: no reported cases
=======================================================================================================================================================
Return to top. Table_IV Note: To print large tables and graphs users may have to change their printer settings to landscape and use a small font size.
TABLE IV. Deaths in 122 U.S. cities,* week ending
August 15, 1998 (32nd Week)
===================================================================================================================================
All Causes, By Age (Years)
------------------------------------------------------------------------ P&I**
Reporting Area All Ages >=65 45-64 25-44 1-24 <1 Total
---------------------------------------------------------------------------------------------------------------
NEW ENGLAND 561 383 98 56 15 9 41
Boston, Mass. 152 97 22 23 8 2 21
Bridgeport, Conn. 29 22 5 - 1 1 1
Cambridge, Mass. 13 7 5 1 - - 1
Fall River, Mass. 31 25 2 4 - - 2
Hartford, Conn. 58 34 12 8 2 2 2
Lowell, Mass. 24 22 2 - - - 1
Lynn, Mass. 7 7 - - - - 1
New Bedford, Mass. 24 19 5 - - - 2
New Haven, Conn. 39 29 4 6 - - 2
Providence, R.I. 51 28 17 5 1 - -
Somerville, Mass. 7 6 - 1 - - 1
Springfield, Mass. 35 22 8 3 - 2 -
Waterbury, Conn. 36 24 10 2 - - 2
Worcester, Mass. 55 41 6 3 3 2 5
MID. ATLANTIC 1,944 1,357 383 140 38 26 89
Albany, N.Y. 41 29 6 1 2 3 -
Allentown, Pa. 24 15 6 3 - - 2
Buffalo, N.Y. 85 53 22 4 5 1 7
Camden, N.J. 30 18 4 1 3 4 2
Elizabeth, N.J. 14 10 2 2 - - -
Erie, Pa. 49 39 8 - 2 - 1
Jersey City, N.J. 16 10 6 - - - -
New York City, N.Y. 1,061 744 207 86 16 8 39
Newark, N.J. 52 28 11 10 2 1 1
Paterson, N.J. 16 9 2 3 1 1 -
Philadelphia, Pa. 200 130 49 16 4 1 13
Pittsburgh, Pa.*** 52 32 11 5 - 4 3
Reading, Pa. 37 31 4 1 - 1 2
Rochester, N.Y. 124 92 28 3 1 - 8
Schenectady, N.Y. 22 17 2 2 1 - 1
Scranton, Pa. 27 23 3 1 - - 1
Syracuse, N.Y. 55 44 6 2 1 2 5
Trenton, N.J. 19 17 2 - - - 2
Utica, N.Y. 20 16 4 - - - 2
Yonkers, N.Y. U U U U U U U
E.N. CENTRAL 1,655 1,160 300 111 41 43 100
Akron, Ohio 36 25 8 2 - 1 1
Canton, Ohio 32 22 6 3 - 1 6
Chicago, Ill. U U U U U U U
Cincinnati, Ohio 147 102 28 9 5 3 22
Cleveland, Ohio 135 102 18 9 4 2 1
Columbus, Ohio 182 120 38 14 6 4 19
Dayton, Ohio 129 97 23 5 1 3 9
Detroit, Mich. 209 111 59 24 6 9 4
Evansville, Ind. 47 37 5 3 - 2 2
Fort Wayne, Ind. 69 51 15 3 - - 4
Gary, Ind. 10 2 3 3 2 - -
Grand Rapids, Mich. 51 39 11 1 - - 3
Indianapolis, Ind. 163 124 21 10 3 5 -
Lansing, Mich. 52 40 6 3 - 3 2
Milwaukee, Wis. 115 82 20 6 3 4 16
Peoria, Ill. 45 35 7 1 2 - 2
Rockford, Ill. 51 32 10 5 3 1 2
South Bend, Ind. 45 38 3 2 1 1 1
Toledo, Ohio 70 53 11 3 3 - 4
Youngstown, Ohio 67 48 8 5 2 4 2
W.N. CENTRAL 657 470 100 44 19 19 36
Des Moines, Iowa U U U U U U U
Duluth, Minn. 30 25 3 1 1 - -
Kansas City, Kans. 14 8 3 3 - - 1
Kansas City, Mo. 86 58 12 8 3 1 2
Lincoln, Nebr. 35 20 6 5 3 1 5
Minneapolis, Minn. 178 138 22 7 3 7 14
Omaha, Nebr. 85 59 13 6 3 4 5
St. Louis, Mo. 101 62 20 12 4 3 -
St. Paul, Minn. 75 61 10 1 - 3 8
Wichita, Kans. 53 39 11 1 2 - 1
S. ATLANTIC 1,170 752 262 98 32 24 57
Atlanta, Ga. 147 90 41 11 3 2 -
Baltimore, Md. 216 136 50 16 7 6 21
Charlotte, N.C. 88 59 15 9 3 2 8
Jacksonville, Fla. 109 73 26 4 2 4 3
Miami, Fla. 115 69 29 11 5 1 2
Norfolk, Va. 37 26 5 3 - 3 -
Richmond, Va. 67 42 11 9 5 - 6
Savannah, Ga. 64 50 11 2 1 - 4
St. Petersburg, Fla. 47 40 4 - 1 2 2
Tampa, Fla. 160 102 35 19 2 1 10
Washington, D.C. 108 55 35 12 3 3 1
Wilmington, Del. 12 10 - 2 - - -
E.S. CENTRAL 747 466 174 62 27 17 35
Birmingham, Ala. 173 105 48 9 5 5 16
Chattanooga, Tenn. 51 32 9 8 2 - 2
Knoxville, Tenn. 71 46 18 5 2 - 1
Lexington, Ky. 61 41 11 3 1 5 2
Memphis, Tenn. 118 70 30 10 5 3 5
Mobile, Ala. 77 52 13 4 6 2 1
Montgomery, Ala. 44 28 9 5 1 1 2
Nashville, Tenn. 152 92 36 18 5 1 6
W.S. CENTRAL 1,401 896 301 129 49 26 69
Austin, Tex. 80 49 18 7 4 2 2
Baton Rouge, La. 46 28 12 4 2 - 2
Corpus Christi, Tex. 43 31 8 4 - - 4
Dallas, Tex. 194 106 47 26 9 6 3
El Paso, Tex. 47 33 6 3 4 1 4
Ft. Worth, Tex. 118 81 22 9 3 3 6
Houston, Tex. 347 204 78 42 16 7 26
Little Rock, Ark. 67 46 16 1 2 2 3
New Orleans, La. 93 60 17 10 5 1 -
San Antonio, Tex. 214 142 52 14 2 4 12
Shreveport, La. 47 39 6 - 2 - 1
Tulsa, Okla. 105 77 19 9 - - 6
MOUNTAIN 760 519 119 70 33 17 44
Albuquerque, N.M. 98 59 12 18 6 3 2
Boise, Idaho 35 25 6 1 2 1 4
Colo. Springs, Colo. 44 33 7 2 1 1 2
Denver, Colo. 88 62 15 7 2 2 7
Las Vegas, Nev. 148 103 23 15 3 4 4
Ogden, Utah 23 18 5 - - - 1
Phoenix, Ariz. 70 42 14 7 4 1 8
Pueblo, Colo. 31 20 7 2 2 - -
Salt Lake City, Utah 101 73 9 9 8 2 8
Tucson, Ariz. 122 84 21 9 5 3 8
PACIFIC 1,259 881 215 85 49 27 115
Berkeley, Calif. 12 10 - 2 - - 1
Fresno, Calif. 95 77 3 6 6 3 8
Glendale, Calif. U U U U U U U
Honolulu, Hawaii 65 52 8 2 3 - 2
Long Beach, Calif. 59 41 9 3 3 3 6
Los Angeles, Calif. U U U U U U U
Pasadena, Calif. 16 10 4 2 - - 1
Portland, Oreg. 109 80 19 6 2 2 3
Sacramento, Calif. 168 128 28 8 2 2 24
San Diego, Calif. 136 89 21 10 8 6 15
San Francisco, Calif. 117 73 26 12 5 1 11
San Jose, Calif. 208 130 46 13 12 7 25
Santa Cruz, Calif. 30 21 6 3 - - 3
Seattle, Wash. 116 78 20 12 4 2 2
Spokane, Wash. 52 41 9 1 - 1 8
Tacoma, Wash. 76 51 16 5 4 - 6
TOTAL 10,154**** 6,884 1,952 795 303 208 586
---------------------------------------------------------------------------------------------------------------
U: Unavailable -: no reported cases
* Mortality data in this table are voluntarily reported from 122 cities in the United States, most of which have populations
of 100,000 or more. A death is reported by the place of its occurrence and by the week that the death certificate was
filed. Fetal deaths are not included.
** Pneumonia and influenza.
*** Because of changes in reporting methods in this Pennsylvania city, these numbers are partial counts for the current
week. Complete counts will be available in 4 to 6 weeks.
**** Total includes unknown ages.
===================================================================================================================================
Return to top. Disclaimer All MMWR HTML versions of articles are electronic conversions from ASCII text into HTML. This conversion may have resulted in character translation or format errors in the HTML version. Users should not rely on this HTML document, but are referred to the electronic PDF version and/or the original MMWR paper copy for the official text, figures, and tables. An original paper copy of this issue can be obtained from the Superintendent of Documents, U.S. Government Printing Office (GPO), Washington, DC 20402-9371; telephone: (202) 512-1800. Contact GPO for current prices. **Questions or messages regarding errors in formatting should be addressed to mmwrq@cdc.gov.Page converted: 10/05/98 |
|||||||||
This page last reviewed 5/2/01
|