 |
|
|
|
|
|
|
| ||||||||||
|
|
|
|
|
|
|
||||
| ||||||||||
|
|
|
|
|
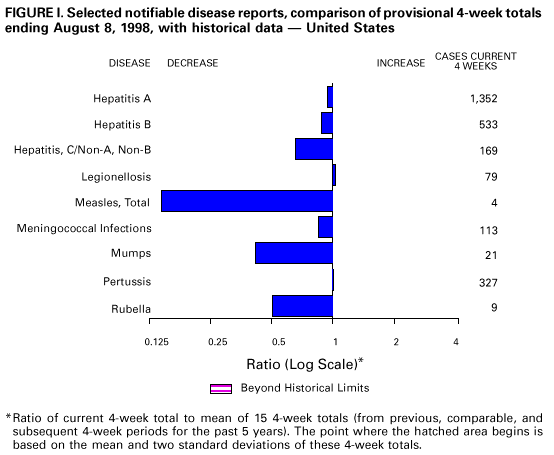
Persons using assistive technology might not be able to fully access information in this file. For assistance, please send e-mail to: mmwrq@cdc.gov. Type 508 Accommodation and the title of the report in the subject line of e-mail. Notifiable Diseases/Deaths in Selected Cities Weekly InformationFigure_I Selected notifiable disease reports, comparison of provisional 4-week totals ending August 8, 1998, with historical data -- United States Table_I Summary -- provisional cases of selected notifiable diseases, United States, cumulative, week ending August 8, 1998 (31st Week) Table_II Provisional cases of selected notifiable diseases, United States, weeks ending August 8, 1998 and August 2, 1997 (31st Week) Table_III Provisional cases of selected notifiable diseases preventable by vaccination, United States, weeks ending August 8, 1998 and August 2, 1997 (31st Week) Table_IV Deaths in 122 U.S. cities, week ending
August 8, 1998 (31st Week)
TABLE I. Summary -- provisional cases of specified notifiable diseases, United
States, cumulative, week ending August 8, 1998 (31st Week)
==================================================================================
                                             Cum. 1998
------------------------------------------------------
Anthrax                                              -
Brucellosis                                         44
Cholera                                              6
Congenital rubella syndrome                          3
Cryptosporidiosis*                               1,172
Diphtheria                                           2
Encephalitis:  California*                          17
               eastern equine*                       2
               St. Louis*                            1
               western equine*                       -
Hansen Disease                                      68
Hantavirus pulmonary syndrome*+                      9
Hemolytic uremic syndrome, post-diarrheal*          31
HIV infection, pediatric*&                         145
Plague                                               5
Poliomyelitis, paralytic                             1
Psittacosis                                         30
Rabies, human                                        -
Rocky Mountain spotted fever (RMSF)                150
Streptococcal disease, invasive Group A          1,438
Streptococcal toxic-shock syndrome*                 37
Syphilis, congenital@                              185
Tetanus                                             20
Toxic-shock syndrome                                78
Trichinosis                                          7
Typhoid fever                                      182
Yellow fever                                         -
------------------------------------------------------
-: no reported cases
 * Not notifiable in all states
 + Updated weekly from reports to the Division of Viral and Rickettsial
   Diseases, National Center for Infectious Diseases (NCID).
 & Updated monthly to the Division of HIV/AIDS Prevention -- Surveillance
   and Epidemiology, National Center for HIV, STD, and TB Prevention
   (NCHSTP), last update July 26, 1998.
 @ One suspected case(s) of polio with onset in 1998 have also been reported
   to date.
** Updated from reports to the Division of STD Prevention, NCHSTP.

==================================================================================
Return to top. Table_II Note: To print large tables and graphs users may have to change their printer settings to landscape and use a small font size.
TABLE II. (page 1) Provisional cases of selected notifiable diseases, United States, weeks ending
August 8, 1998, and August 2, 1997 (31st Week)
Escherichia
coli O157:H7
------------------- Hepatitis
AIDS* Chlamydia NETSS** PHLIS*** Gonorrhea C\NA,NB
----------------- -------------------- -------- -------- ------------------- ----------------
Cum. Cum. Cum. Cum. Cum. Cum. Cum. Cum. Cum. Cum.
Reporting Area 1998 1997 1998 1997 1998 1998 1998 1997 1998 1997
------------------------------------------------------------------------------------------------------------------------------
UNITED STATES 27,399 35,436 314,383 265,430 1,344 762 185,476 166,882 2,264 2,037
NEW ENGLAND 1,025 1,470 11,844 10,149 173 127 3,326 3,451 31 41
Maine 21 36 618 582 22 - 40 34 - -
N.H. 26 19 558 460 23 25 52 64 - -
Vt. 14 24 244 228 8 6 22 32 - 2
Mass. 522 528 5,002 4,199 90 80 1,228 1,306 28 32
R.I. 78 97 1,417 1,140 5 1 212 266 3 7
Conn. 364 766 4,005 3,540 25 15 1,772 1,749 - -
MID. ATLANTIC 7,578 11,061 38,080 32,658 129 35 21,334 21,247 233 196
Upstate N.Y. 961 1,728 N N 96 - 3,508 3,750 181 144
N.Y. City 4,074 5,735 20,945 15,801 4 6 8,916 7,844 - -
N.J. 1,475 2,273 6,271 5,701 29 28 3,798 4,316 - -
Pa. 1,068 1,325 10,864 11,156 N 1 5,112 5,337 52 52
E.N. CENTRAL 2,078 2,556 52,149 35,568 214 130 35,857 22,501 318 358
Ohio 430 561 15,106 13,027 54 22 9,496 8,318 7 11
Ind. 355 394 3,507 5,300 57 28 2,225 3,532 4 10
Ill. 825 892 15,093 U 47 - 12,259 U 16 63
Mich. 353 545 12,486 10,841 56 35 9,423 7,976 291 253
Wis. 115 164 5,957 6,400 N 45 2,454 2,675 - 21
W.N. CENTRAL 532 696 18,528 18,495 210 158 9,176 8,323 120 40
Minn. 104 128 3,649 3,863 78 78 1,300 1,354 7 3
Iowa 49 74 2,063 2,650 65 25 660 720 12 20
Mo. 244 331 7,161 6,922 15 29 5,233 4,506 96 5
N. Dak. 4 7 290 497 6 11 29 32 - 2
S. Dak. 11 3 961 737 12 10 152 80 - -
Nebr. 48 65 1,361 1,140 19 - 494 438 2 2
Kans. 72 88 3,043 2,686 15 5 1,308 1,193 3 8
S. ATLANTIC 6,869 8,699 65,423 55,731 109 79 53,067 54,236 115 138
Del. 91 159 1,473 - - 1 815 699 - -
Md. 826 1,078 4,970 4,153 16 9 5,813 6,840 5 4
D.C. 567 658 N N 1 - 1,997 2,600 - -
Va. 502 719 6,988 6,925 N 25 3,942 4,691 7 18
W. Va. 59 60 1,631 1,722 6 3 469 546 4 13
N.C. 456 503 12,939 10,095 20 31 11,167 9,813 14 34
S.C. 452 475 11,206 7,462 5 2 7,255 6,655 3 27
Ga. 725 1,071 14,049 10,307 40 - 11,827 11,820 9 -
Fla. 3,191 3,976 12,167 15,067 21 8 9,782 10,572 73 42
E.S. CENTRAL 1,084 1,188 23,338 20,244 69 25 22,566 20,216 105 223
Ky. 156 211 3,645 3,884 18 - 2,087 2,453 16 10
Tenn. 378 495 7,789 7,582 32 22 6,684 6,314 85 151
Ala. 330 287 5,982 4,743 19 2 7,649 6,849 4 6
Miss. 220 195 5,922 4,035 U 1 6,146 4,600 U 56
W.S. CENTRAL 3,328 3,601 43,886 35,214 77 12 25,528 22,921 549 278
Ark. 123 131 2,087 1,766 6 6 1,214 2,874 5 9
La. 586 640 8,671 5,260 3 2 7,570 4,936 19 124
Okla. 183 188 5,753 4,414 10 4 3,148 2,777 7 6
Tex. 2,436 2,642 27,375 23,774 58 - 13,596 12,334 518 139
MOUNTAIN 967 1,032 12,797 16,943 180 84 4,774 4,649 256 181
Mont. 18 26 731 644 8 - 26 27 7 13
Idaho 19 34 1,003 853 18 7 97 64 86 36
Wyo. 1 13 388 315 49 - 18 29 45 42
Colo. 186 264 10 3,750 37 32 1,339 1,256 18 20
N. Mex. 153 105 2,172 2,277 16 11 526 518 63 32
Ariz. 377 247 6,615 6,340 13 13 2,390 2,064 3 23
Utah 70 86 1,378 990 33 15 150 145 21 3
Nev. 143 257 500 1,774 6 6 228 546 13 12
PACIFIC 3,938 5,133 48,338 40,428 183 112 9,848 9,338 537 582
Wash. 270 417 6,582 5,419 31 22 1,132 1,135 12 18
Oreg. 116 188 3,382 2,887 54 48 470 444 2 2
Calif. 3,439 4,449 35,971 30,258 96 35 7,801 7,235 468 463
Alaska 17 42 1,128 848 2 - 187 233 1 -
Hawaii 96 37 1,275 1,016 N 7 258 291 54 99
Guam - 2 8 193 N - 2 27 - -
P.R. 1,141 1,198 U U 1 U 242 378 - -
V.I. 18 70 N N N U U U U U
Amer. Samoa - - U U N U U U U U
C.N.M.I. - 1 N N N U 14 17 - 2
------------------------------------------------------------------------------------------------------------------------------
N: Not notifiable U: Unavailable -: no reported cases C.N.M.I.: Commonwealth of North Mariana Islands
* Updated monthly to the Division of HIV/AIDS Prevention, -- Surveillance and Epidemiology, National Center for HIV, STD,
and TB Prevention, last update July 26, 1998.
** National Electronic Telecommunications System for Surveillance.
*** Public Health Laboratory Information System.
=======================================================================================================================================================
TABLE II. (page 2) Provisional cases of selected notifiable diseases, United States, weeks ending
August 8, 1998, and August 2, 1997 (31st Week)
Lyme Syphilis Rabies,
Legionellosis Disease Malaria (Primary & Secondary) Tuberculosis Animal
---------------- ---------------- ---------------- --------------------- ----------------- -------
Cum. Cum. Cum. Cum. Cum. Cum. Cum. Cum. Cum. Cum. Cum.
Reporting Area 1998 1997 1998 1997 1998 1997 1998 1997 1998 * 1997 1998
-------------------------------------------------------------------------------------------------------------------------------------------
UNITED STATES 665 512 5,543 4,975 700 998 4,263 4,958 8,212 10,335 4,138
NEW ENGLAND 39 38 1,833 1,276 41 45 42 99 252 258 797
Maine 1 1 6 7 4 1 1 - 5 16 122
N.H. 3 4 27 9 3 2 1 - 6 10 37
Vt. 4 6 6 6 - 2 4 - 1 3 33
Mass. 15 11 412 209 14 21 25 47 135 143 270
R.I. 8 5 217 169 2 5 1 2 34 18 47
Conn. 8 11 1,165 876 18 14 10 50 71 68 288
MID. ATLANTIC 157 92 3,032 2,642 170 312 150 245 1,655 1,827 953
Upstate N.Y. 46 26 1,745 1,043 49 46 22 24 185 236 670
N.Y. City 22 7 12 122 80 194 32 53 879 939 U
N.J. 7 14 629 818 22 53 53 101 350 376 116
Pa. 82 45 646 659 19 19 43 67 241 276 167
E.N. CENTRAL 201 175 51 418 61 98 562 371 609 1,083 81
Ohio 83 74 41 18 4 12 80 130 U 174 41
Ind. 38 29 8 15 6 9 130 94 76 88 5
Ill. 14 13 1 8 18 41 212 U 361 583 8
Mich. 44 38 1 17 31 24 104 72 172 168 19
Wis. 22 21 U 360 2 12 36 75 - 70 8
W.N. CENTRAL 44 35 69 52 50 31 87 107 238 323 461
Minn. 3 1 47 27 26 10 6 14 87 84 82
Iowa 6 9 16 4 5 8 - 6 20 38 108
Mo. 14 5 1 15 10 7 68 61 86 127 19
N. Dak. - 2 - - 2 2 - - 3 8 89
S. Dak. 2 2 - 1 - - 1 - 14 7 90
Nebr. 15 12 3 2 1 1 4 2 10 12 5
Kans. 4 4 2 3 6 3 8 24 18 47 68
S. ATLANTIC 78 66 394 403 157 159 1,813 1,989 1,195 1,897 1,229
Del. 8 7 12 82 1 2 16 16 U 19 17
Md. 19 14 267 258 50 51 410 547 179 178 308
D.C. 5 3 4 7 12 10 46 77 64 59 -
Va. 8 14 35 18 29 43 97 150 144 194 371
W. Va. N N 7 3 1 - 2 3 26 33 54
N.C. 6 9 35 20 12 9 445 442 244 230 136
S.C. 7 3 3 1 4 10 179 237 185 207 98
Ga. 3 - 3 1 17 20 483 334 283 355 120
Fla. 21 16 28 13 31 14 135 183 70 622 125
E.S. CENTRAL 33 34 47 52 16 20 720 1,098 614 766 174
Ky. 16 7 11 11 3 6 70 88 108 111 25
Tenn. 12 20 25 23 9 4 339 467 208 284 93
Ala. 5 2 11 4 4 7 162 277 162 232 56
Miss. U 5 U 14 U 3 149 266 136 139 U
W.S. CENTRAL 20 12 18 43 20 10 561 740 246 1,527 112
Ark. - 1 6 14 1 2 71 111 72 118 21
La. 2 2 2 2 6 5 237 225 U 119 -
Okla. 8 1 2 9 2 3 32 69 101 131 91
Tex. 10 8 8 18 11 - 221 335 - 1,159 -
MOUNTAIN 43 30 8 6 35 49 129 99 246 336 98
Mont. 2 1 - - - 2 - - 12 6 34
Idaho 2 2 2 2 7 - - - 8 7 -
Wyo. 1 1 - 1 - 2 1 - 3 2 45
Colo. 8 9 3 - 11 24 8 5 U 57 1
N. Mex. 2 1 2 - 11 6 12 4 34 31 3
Ariz. 10 7 - 1 5 7 102 78 124 155 9
Utah 16 6 - - 1 3 3 4 36 14 6
Nev. 2 3 1 2 - 5 3 8 29 64 -
PACIFIC 50 30 91 83 150 274 199 210 3,157 2,318 233
Wash. 8 6 5 4 14 10 23 7 144 182 -
Oreg. - - 9 12 13 14 3 5 71 97 1
Calif. 41 23 76 67 120 242 173 196 2,818 1,871 211
Alaska - - 1 - 1 3 - 1 31 51 21
Hawaii 1 1 - - 2 5 - 1 93 117 -
Guam - - - - - - - 3 - 13 -
P.R. - - - - - 4 121 148 46 129 32
V.I. U U U U U U U U U U U
Amer. Samoa U U U U U U U U U U U
C.N.M.I. - - - - - - 98 9 54 2 -
-------------------------------------------------------------------------------------------------------------------------------------------
N: Not notifiable U: Unavailable -: no reported cases
* Additional information about areas displaying 'U' for cumulative Tuberculosis cases can be found in Notices to Readers, MMWR Vol. 47, No. 2, p. 39.
=======================================================================================================================================================
Return to top. Table_III Note: To print large tables and graphs users may have to change their printer settings to landscape and use a small font size.
TABLE III. (page 1) Provisional cases of selected notifiable diseases preventable by vaccination, United
States, weeks ending August 8, 1998, and August 2, 1997 (31st Week)
Hepatitis (Viral), by type Measles (Rubeola)
H. influenzae, --------------------------------------- ------------------------------------------------------------
invasive A B Indigenous Imported** Total
---------------- ----------------- ----------------- --------------- --------------- ---------------
Cum. Cum. Cum. Cum. Cum. Cum. Cum. Cum. Cum. Cum.
Reporting Area 1998* 1997 1998 1997 1998 1997 1998 1998 1998 1998 1998 1997
-----------------------------------------------------------------------------------------------------------------------------------------------------
UNITED STATES 663 699 12,988 16,419 4,807 5,549 - 28 - 19 47 100
NEW ENGLAND 37 39 151 420 76 101 - 1 - 2 3 18
Maine 2 3 13 45 2 6 - - - - - 1
N.H. 7 6 8 21 10 7 - - - - - 1
Vt. 3 3 13 8 3 5 - - - 1 1 -
Mass. 22 23 47 176 18 43 - 1 - 1 2 15
R.I. 2 2 10 92 43 11 - - - - - -
Conn. 1 2 60 78 - 29 - - - - - 1
MID. ATLANTIC 94 101 856 1,312 671 805 - 9 - 4 13 21
Upstate N.Y. 39 27 203 196 184 168 - 2 - - 2 5
N.Y. City 18 27 213 587 176 303 - - - - - 7
N.J. 32 33 197 194 105 157 - 7 - 1 8 3
Pa. 5 14 243 335 206 177 - - - 3 3 6
E.N. CENTRAL 102 117 1,755 1,680 493 914 - 11 - 3 14 8
Ohio 38 65 202 213 45 54 - - - 1 1 -
Ind. 27 11 99 185 61 69 - 2 - 1 3 -
Ill. 30 27 273 441 90 175 - - - - - 6
Mich. 3 14 1,068 716 275 260 - 9 - 1 10 2
Wis. 4 - 113 125 22 356 - - - - - -
W.N. CENTRAL 64 36 971 1,241 254 303 - - - - - 12
Minn. 49 27 83 111 24 23 - - - - - 3
Iowa 2 3 384 215 45 23 - - - - - -
Mo. 8 3 391 651 151 222 U - U - - 1
N. Dak. - - 3 10 4 3 U - U - - -
S. Dak. - 2 18 15 1 - - - - - - 8
Nebr. - 1 24 50 9 9 - - - - - -
Kans. 5 - 68 189 20 23 U - U - - -
S. ATLANTIC 137 108 1,109 956 690 698 - 3 - 5 8 9
Del. - - 3 20 - 4 - - - 1 1 -
Md. 41 44 193 131 96 102 - - - 1 1 2
D.C. - - 34 16 8 24 - - - - - 1
Va. 13 7 144 126 60 77 - - - 2 2 1
W. Va. 4 3 1 6 4 9 - - - - - -
N.C. 20 17 66 118 127 151 - - - - - 1
S.C. 3 3 18 69 22 62 - - - - - 1
Ga. 28 21 323 199 117 71 - 1 - 1 2 1
Fla. 28 13 327 271 256 198 - 2 - - 2 2
E.S. CENTRAL 40 39 217 393 240 409 - - - 2 2 1
Ky. 6 6 14 49 25 26 - - - - - -
Tenn. 24 23 153 243 170 277 - - - - - -
Ala. 10 8 50 58 45 43 - - - 2 2 1
Miss. U 2 U 43 U 63 U U U U U -
W.S. CENTRAL 38 33 2,501 3,395 811 703 - - - - - 7
Ark. - 2 62 142 54 53 - - - - - -
La. 18 7 51 127 62 82 - - - - - -
Okla. 18 22 351 975 52 25 - - - - - -
Tex. 2 2 2,037 2,151 643 543 - - - - - 7
MOUNTAIN 73 65 2,035 2,489 519 523 - - - - - 7
Mont. - - 67 53 4 6 - - - - - -
Idaho - 1 169 87 20 17 - - - - - -
Wyo. 1 2 25 21 2 16 - - - - - -
Colo. 15 11 163 262 71 100 - - - - - -
N. Mex. 5 7 97 196 215 170 - - - - - -
Ariz. 41 27 1,309 1,228 133 118 - - - - - 5
Utah 4 3 131 383 45 60 - - - - - -
Nev. 7 14 74 259 29 36 U - U - - 2
PACIFIC 78 161 3,393 4,533 1,053 1,093 - 4 - 3 7 17
Wash. 7 3 696 314 71 48 - - - 1 1 1
Oreg. 32 25 231 230 69 66 - - - - - -
Calif. 31 124 2,429 3,875 900 960 - 4 - 2 6 12
Alaska 1 2 14 24 8 11 - - - - - -
Hawaii 7 7 23 90 5 8 - - - - - 4
Guam - - - - - 3 U - U - - -
P.R. 2 - 37 198 263 461 - - - - - -
V.I. U U U U U U U U U U U U
Amer. Samoa U U U U U U U U U U U U
C.N.M.I. - 6 1 1 28 34 U - U - - 1
-----------------------------------------------------------------------------------------------------------------------------------------------------
N: Not notifiable U: Unavailable -: no reported cases
* Of 150 cases among children aged <5 years, serotype was reported for 82 and of those, 33 were type b.
** For imported measles, cases include only those resulting from importation from other countries.
=======================================================================================================================================================
TABLE III. (page 2) Provisional cases of selected notifiable diseases preventable by vaccination, United
States, weeks ending August 8, 1998, and August 2, 1997 (31st Week)
Meningococcal
Disease Mumps Pertussis Rubella
----------------- -------------------------- --------------------------- ---------------------------
Cum. Cum. Cum. Cum. Cum. Cum. Cum. Cum.
Reporting Area 1998 1997 1998 1998 1997 1998 1998 1997 1998 1998 1997
------------------------------------------------------------------------------------------------------------------------------------------
UNITED STATES 1,723 2,210 7 292 391 82 2,835 3,137 - 295 125
NEW ENGLAND 74 138 - 2 8 4 498 609 - 36 1
Maine 5 15 - - - - 5 7 - - -
N.H. 4 12 - - - - 40 70 - - -
Vt. 1 3 - - - 3 52 181 - - -
Mass. 36 71 - 1 2 - 369 327 - 6 1
R.I. 3 11 - - 5 - 5 12 - 1 -
Conn. 25 26 - 1 1 1 27 12 - 29 -
MID. ATLANTIC 159 233 1 18 45 5 311 235 - 124 28
Upstate N.Y. 42 64 - 3 10 2 159 88 - 110 4
N.Y. City 18 41 - 4 3 - 9 54 - 9 24
N.J. 41 44 - 2 7 - 5 11 - 4 -
Pa. 58 84 1 9 25 3 138 82 - 1 -
E.N. CENTRAL 261 324 2 53 49 14 249 314 - - 5
Ohio 94 119 1 21 18 11 90 92 - - -
Ind. 48 35 - 5 6 - 69 35 - - -
Ill. 64 94 - 7 8 3 35 45 - - 1
Mich. 31 47 1 20 14 - 38 32 - - -
Wis. 24 29 - - 3 - 17 110 - - 4
W.N. CENTRAL 144 164 - 21 12 23 244 187 - 27 -
Minn. 25 29 - 10 5 17 149 120 - - -
Iowa 26 38 - 7 6 6 53 10 - - -
Mo. 53 71 U 3 - U 16 33 U 2 -
N. Dak. 2 1 U 1 - U 2 1 U - -
S. Dak. 6 4 - - - - 6 3 - - -
Nebr. 7 6 - - 1 - 8 4 - - -
Kans. 25 15 U - - U 10 16 U 25 -
S. ATLANTIC 305 376 - 37 46 6 176 281 - 9 58
Del. 1 5 - - - - 2 1 - - -
Md. 24 36 - - 1 - 31 87 - - -
D.C. - 6 - - - - 1 3 - - -
Va. 24 38 - 5 8 1 8 34 - - 1
W. Va. 12 14 - - - - 1 5 - - -
N.C. 45 72 - 9 7 - 65 80 - 6 50
S.C. 44 40 - 4 10 2 22 11 - - 6
Ga. 65 75 - 1 6 - 10 8 - - -
Fla. 90 90 - 18 14 3 36 52 - 3 1
E.S. CENTRAL 129 165 1 7 21 1 65 74 - 1 1
Ky. 19 38 - - 3 - 22 26 - - -
Tenn. 46 58 - 1 3 1 23 25 - - -
Ala. 64 52 1 6 6 - 20 16 - 1 1
Miss. U 17 U U 9 U U 7 U U -
W.S. CENTRAL 195 201 - 40 44 4 200 126 - 80 3
Ark. 25 25 - - 1 - 26 10 - - -
La. 42 43 - 8 11 - 2 13 - - -
Okla. 29 24 - - - - 18 17 - - -
Tex. 99 109 - 32 32 4 154 86 - 80 3
MOUNTAIN 97 130 2 26 48 9 587 795 - 5 6
Mont. 3 7 - - - - 3 14 - - -
Idaho 6 8 - 3 2 1 194 467 - - 2
Wyo. 4 1 - 1 1 1 8 6 - - -
Colo. 19 35 2 8 3 1 129 214 - - -
N. Mex. 17 22 N N N 5 75 48 - 1 -
Ariz. 33 33 - 5 31 - 129 23 - 1 4
Utah 11 11 - 3 6 1 36 12 - 2 -
Nev. 4 13 U 6 5 U 13 11 U 1 -
PACIFIC 359 479 1 88 118 16 505 516 - 13 23
Wash. 50 56 1 7 13 8 193 216 - 9 5
Oreg. 58 94 N N N 6 36 23 - - -
Calif. 245 324 - 63 86 2 268 259 - 2 10
Alaska 2 1 - 2 5 - 3 4 - - -
Hawaii 4 4 - 16 14 - 5 14 - 2 8
Guam - 1 U - 1 U - - U - -
P.R. 6 8 - 1 5 - 2 - - - -
V.I. U U U U U U U U U U U
Amer. Samoa U U U U U U U U U U U
C.N.M.I. - - U 2 4 U 1 - U - -
------------------------------------------------------------------------------------------------------------------------------------------
N: Not notifiable U: Unavailable -: no reported cases
=======================================================================================================================================================
Return to top. Table_IV Note: To print large tables and graphs users may have to change their printer settings to landscape and use a small font size.
TABLE IV. Deaths in 122 U.S. cities,* week ending
August 8, 1998 (31st Week)
===================================================================================================================================
All Causes, By Age (Years)
------------------------------------------------------------------------ P&I**
Reporting Area All Ages >=65 45-64 25-44 1-24 <1 Total
---------------------------------------------------------------------------------------------------------------
NEW ENGLAND 577 411 104 34 13 15 31
Boston, Mass. 147 104 25 10 4 4 15
Bridgeport, Conn. 40 26 9 3 1 1 2
Cambridge, Mass. 14 13 1 - - - -
Fall River, Mass. 23 22 1 - - - -
Hartford, Conn. 67 40 18 4 3 2 2
Lowell, Mass. 20 17 2 1 - - 1
Lynn, Mass. 14 11 2 1 - - 1
New Bedford, Mass. 26 23 2 1 - - -
New Haven, Conn. 41 25 8 4 2 2 1
Providence, R.I. 60 39 13 3 1 4 -
Somerville, Mass. 5 3 1 1 - - -
Springfield, Mass. 41 28 9 2 1 1 1
Waterbury, Conn. 28 24 3 1 - - -
Worcester, Mass. 51 36 10 3 1 1 8
MID. ATLANTIC 2,143 1,507 428 143 41 24 108
Albany, N.Y. 41 33 4 3 - 1 2
Allentown, Pa. 10 10 - - - - -
Buffalo, N.Y. 71 50 13 4 3 1 2
Camden, N.J. 33 20 7 3 1 2 6
Elizabeth, N.J. 28 19 5 4 - - -
Erie, Pa. 31 22 5 1 2 1 1
Jersey City, N.J. 57 33 19 4 1 - -
New York City, N.Y. 1,095 769 236 65 18 7 50
Newark, N.J. 71 33 17 17 1 3 4
Paterson, N.J. 11 8 2 1 - - -
Philadelphia, Pa. 300 201 60 25 10 4 12
Pittsburgh, Pa.*** 37 31 4 2 - - 2
Reading, Pa. 34 28 3 1 1 1 3
Rochester, N.Y. 114 85 23 3 1 2 9
Schenectady, N.Y. 27 22 4 - 1 - 1
Scranton, Pa. 29 26 2 1 - - 2
Syracuse, N.Y. 105 81 15 7 1 1 11
Trenton, N.J. 28 21 4 1 1 1 3
Utica, N.Y. 21 15 5 1 - - -
Yonkers, N.Y. U U U U U U U
E.N. CENTRAL 1,479 1,025 273 115 33 33 76
Akron, Ohio 45 34 7 2 1 1 -
Canton, Ohio 27 23 3 1 - - 2
Chicago, Ill. U U U U U U U
Cincinnati, Ohio 83 59 11 9 3 1 13
Cleveland, Ohio 138 93 31 11 1 2 -
Columbus, Ohio 162 109 31 16 2 4 13
Dayton, Ohio 117 91 18 4 3 1 12
Detroit, Mich. 182 102 40 24 8 8 3
Evansville, Ind. 51 37 10 2 - 2 1
Fort Wayne, Ind. 45 33 9 2 - 1 2
Gary, Ind. 6 3 2 - 1 - -
Grand Rapids, Mich. 47 34 7 3 2 1 4
Indianapolis, Ind. 173 110 40 13 5 5 9
Lansing, Mich. 44 38 2 3 1 - 3
Milwaukee, Wis. 103 77 14 10 1 1 8
Peoria, Ill. 23 13 6 2 2 - -
Rockford, Ill. 39 25 9 3 1 1 1
South Bend, Ind. 39 26 6 5 - 2 3
Toledo, Ohio 97 70 20 4 1 2 2
Youngstown, Ohio 58 48 7 1 1 1 -
W.N. CENTRAL 873 601 155 64 19 27 35
Des Moines, Iowa 140 103 23 8 4 2 15
Duluth, Minn. 46 30 11 3 - 2 1
Kansas City, Kans. 45 30 10 5 - - -
Kansas City, Mo. 104 61 21 9 2 4 2
Lincoln, Nebr. 31 24 4 3 - - 3
Minneapolis, Minn. 136 109 15 5 2 5 7
Omaha, Nebr. 73 45 18 5 2 3 3
St. Louis, Mo. 119 71 29 9 - 10 2
St. Paul, Minn. 81 64 10 4 2 1 2
Wichita, Kans. 98 64 14 13 7 - -
S. ATLANTIC 995 650 205 91 23 24 69
Atlanta, Ga. U U U U U U U
Baltimore, Md. 173 113 38 17 1 4 19
Charlotte, N.C. 101 57 29 5 5 5 12
Jacksonville, Fla. 195 158 23 5 7 2 7
Miami, Fla. 94 42 26 18 2 6 -
Norfolk, Va. 28 20 4 3 - 1 2
Richmond, Va. 60 31 21 6 2 - 1
Savannah, Ga. 61 38 12 9 2 - 4
St. Petersburg, Fla. 62 44 7 6 3 2 8
Tampa, Fla. 198 135 42 14 1 4 16
Washington, D.C. U U U U U U U
Wilmington, Del. 23 12 3 8 - - -
E.S. CENTRAL 825 557 160 67 26 15 33
Birmingham, Ala. 166 116 33 8 6 3 14
Chattanooga, Tenn. 90 69 10 8 3 - 1
Knoxville, Tenn. 80 61 10 5 3 1 -
Lexington, Ky. 69 45 14 6 2 2 4
Memphis, Tenn. 190 113 45 20 7 5 7
Mobile, Ala. 68 52 7 5 3 1 1
Montgomery, Ala. 61 45 12 3 - 1 6
Nashville, Tenn. 101 56 29 12 2 2 -
W.S. CENTRAL 1,400 853 302 128 76 41 65
Austin, Tex. 58 31 14 7 4 2 2
Baton Rouge, La. 36 19 7 7 3 - -
Corpus Christi, Tex. 55 35 11 6 3 - 4
Dallas, Tex. 180 103 39 20 10 8 1
El Paso, Tex. 79 55 18 2 3 1 4
Ft. Worth, Tex. 103 70 20 5 5 3 8
Houston, Tex. 385 203 103 42 26 11 28
Little Rock, Ark. 82 50 19 3 4 6 1
New Orleans, La. 68 35 15 12 2 4 -
San Antonio, Tex. 222 158 33 16 10 5 9
Shreveport, La. 22 17 3 2 - - 1
Tulsa, Okla. 110 77 20 6 6 1 7
MOUNTAIN 896 572 179 90 30 25 50
Albuquerque, N.M. 100 67 21 11 1 - 1
Boise, Idaho 35 24 7 2 2 - 2
Colo. Springs, Colo. 50 33 12 3 1 1 1
Denver, Colo. 102 64 20 8 3 7 9
Las Vegas, Nev. 195 111 45 24 10 5 10
Ogden, Utah 25 18 2 4 - 1 4
Phoenix, Ariz. 157 103 22 18 6 8 7
Pueblo, Colo. 26 18 6 2 - - -
Salt Lake City, Utah 91 60 16 10 3 2 11
Tucson, Ariz. 115 74 28 8 4 1 5
PACIFIC 1,556 1,075 273 108 39 61 110
Berkeley, Calif. 14 12 1 - - 1 2
Fresno, Calif. 80 55 12 8 3 2 3
Glendale, Calif. 24 16 6 2 - - 1
Honolulu, Hawaii 66 49 14 3 - - 6
Long Beach, Calif. 69 53 9 2 2 3 9
Los Angeles, Calif. 339 235 61 24 6 13 19
Pasadena, Calif. 30 18 9 1 - 2 2
Portland, Oreg. 121 81 25 9 5 1 7
Sacramento, Calif. 143 99 26 7 7 4 13
San Diego, Calif. 138 98 25 14 1 - 12
San Francisco, Calif. 127 89 22 12 2 2 13
San Jose, Calif. 105 75 17 9 3 1 10
Santa Cruz, Calif. 22 19 1 1 1 - 4
Seattle, Wash. 132 85 30 9 6 2 4
Spokane, Wash. 47 37 6 2 1 1 1
Tacoma, Wash. 99 54 9 5 2 29 4
TOTAL 10,744**** 7,251 2,079 840 300 265 577
---------------------------------------------------------------------------------------------------------------
U: Unavailable -: no reported cases
* Mortality data in this table are voluntarily reported from 122 cities in the United States, most of which have populations
of 100,000 or more. A death is reported by the place of its occurrence and by the week that the death certificate was
filed. Fetal deaths are not included.
** Pneumonia and influenza.
*** Because of changes in reporting methods in this Pennsylvania city, these numbers are partial counts for the current
week. Complete counts will be available in 4 to 6 weeks.
**** Total includes unknown ages.
===================================================================================================================================
Return to top. Disclaimer All MMWR HTML versions of articles are electronic conversions from ASCII text into HTML. This conversion may have resulted in character translation or format errors in the HTML version. Users should not rely on this HTML document, but are referred to the electronic PDF version and/or the original MMWR paper copy for the official text, figures, and tables. An original paper copy of this issue can be obtained from the Superintendent of Documents, U.S. Government Printing Office (GPO), Washington, DC 20402-9371; telephone: (202) 512-1800. Contact GPO for current prices. **Questions or messages regarding errors in formatting should be addressed to mmwrq@cdc.gov.Page converted: 10/05/98 |
|||||||||
This page last reviewed 5/2/01
|