 |
|
|
|
|
|
|
| ||||||||||
|
|
|
|
|
|
|
||||
| ||||||||||
|
|
|
|
|
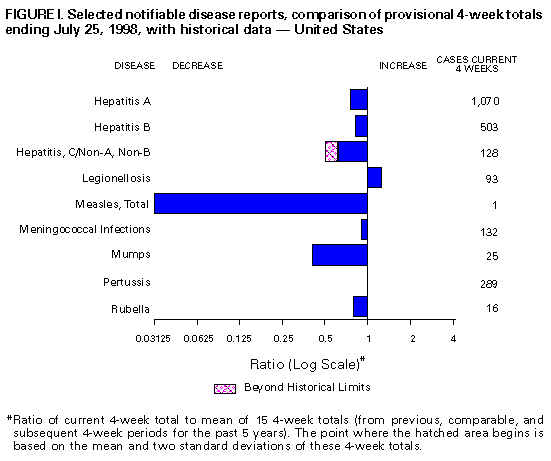
Persons using assistive technology might not be able to fully access information in this file. For assistance, please send e-mail to: mmwrq@cdc.gov. Type 508 Accommodation and the title of the report in the subject line of e-mail. Notifiable Diseases/Deaths in Selected Cities Weekly InformationFigure_I Selected notifiable disease reports, comparison of provisional 4-week totals ending July 25, 1998, with historical data -- United States Table_I Summary -- provisional cases of selected notifiable diseases, United States, cumulative, week ending July 25, 1998 (29th Week) Table_II Provisional cases of selected notifiable diseases, United States, weeks ending July 25, 1998 and July 19, 1997 (29th Week) Table_III Provisional cases of selected notifiable diseases preventable by vaccination, United States, weeks ending July 25, 1998 and July 19, 1997 (29th Week) Table_IV Deaths in 122 U.S. cities, week ending
July 25, 1998 (29th Week)
TABLE I. Summary -- provisional cases of specified notifiable diseases, United
States, cumulative, week ending July 25, 1998 (29th Week)
==================================================================================
                                             Cum. 1998
------------------------------------------------------
Anthrax                                              -
Brucellosis                                         42
Cholera                                              6
Congenital rubella syndrome                          5
Cryptosporidiosis*                               1,048
Diphtheria                                           3
Encephalitis:  California*                           3
               eastern equine*                       -
               St. Louis*                            -
               western equine*                       -
Hansen Disease                                      65
Hantavirus pulmonary syndrome*+                      6
Hemolytic uremic syndrome, post-diarrheal*          25
HIV infection, pediatric*&                         127
Plague                                               4
Poliomyelitis, paralytic                             1
Psittacosis                                         30
Rabies, human                                        -
Rocky Mountain spotted fever (RMSF)                126
Streptococcal disease, invasive Group A          1,377
Streptococcal toxic-shock syndrome*                 37
Syphilis, congenital**                             131
Tetanus                                             17
Toxic-shock syndrome                                71
Trichinosis                                          6
Typhoid fever                                      166
Yellow fever                                         -
------------------------------------------------------
-: no reported cases
 * Not notifiable in all states
 + Updated weekly from reports to the Division of Viral and Rickettsial
   Diseases, National Center for Infectious Diseases (NCID).
 & Updated monthly to the Division of HIV/AIDS Prevention -- Surveillance
   and Epidemiology, National Center for HIV, STD, and TB Prevention
   (NCHSTP), last update June 28, 1998.
** Updated from reports to the Division of STD Prevention, NCHSTP.

==================================================================================
Return to top. Table_II Note: To print large tables and graphs users may have to change their printer settings to landscape and use a small font size.
TABLE II. (page 1) Provisional cases of selected notifiable diseases, United States, weeks ending
July 25, 1998, and July 19, 1997 (29th Week)
Escherichia
coli O157:H7
------------------- Hepatitis
AIDS* Chlamydia NETSS** PHLIS*** Gonorrhea C\NA,NB
----------------- -------------------- -------- -------- ------------------- ----------------
Cum. Cum. Cum. Cum. Cum. Cum. Cum. Cum. Cum. Cum.
Reporting Area 1998 1997 1998 1997 1998 1998 1998 1997 1998 1997
------------------------------------------------------------------------------------------------------------------------------
UNITED STATES 23,929 32,521 291,740 252,518 1,156 592 169,556 157,755 2,149 1,908
NEW ENGLAND 830 1,454 11,145 9,498 153 107 3,128 3,232 31 37
Maine 18 36 570 547 16 - 39 31 - -
N.H. 22 19 513 431 22 25 49 60 - -
Vt. 10 24 224 214 8 6 19 27 - 2
Mass. 386 526 4,618 3,929 81 60 1,121 1,232 28 31
R.I. 67 83 1,347 1,086 5 1 195 256 3 4
Conn. 327 766 3,873 3,291 21 15 1,705 1,626 - -
MID. ATLANTIC 6,951 9,910 34,006 30,194 112 27 19,160 19,467 223 184
Upstate N.Y. 849 1,621 N N 79 - 3,245 3,358 171 135
N.Y. City 3,910 4,966 18,216 14,579 4 6 7,952 7,280 - -
N.J. 1,232 2,090 5,351 5,364 29 20 3,025 3,980 - -
Pa. 960 1,233 10,439 10,251 N 1 4,938 4,849 52 49
E.N. CENTRAL 1,768 2,281 47,677 40,616 198 111 32,548 24,505 291 346
Ohio 331 465 13,605 12,234 49 20 8,344 7,776 7 10
Ind. 326 360 3,265 4,761 55 25 2,078 3,186 3 10
Ill. 706 761 13,507 7,270 46 - 10,871 3,593 16 58
Mich. 305 544 12,004 10,372 48 27 9,110 7,484 265 248
Wis. 100 151 5,296 5,979 N 39 2,145 2,466 - 20
W.N. CENTRAL 444 615 17,185 17,428 161 95 8,609 7,872 120 39
Minn. 65 99 3,235 3,620 55 47 1,126 1,270 7 3
Iowa 49 69 2,063 2,575 51 7 660 690 12 19
Mo. 209 296 6,580 6,473 15 21 4,986 4,291 96 5
N. Dak. 4 6 290 470 2 6 29 32 - 2
S. Dak. 9 3 902 683 8 10 145 76 - -
Nebr. 39 59 1,273 1,100 19 - 450 419 2 2
Kans. 69 83 2,842 2,507 11 4 1,213 1,094 3 8
S. ATLANTIC 5,900 8,188 60,970 51,976 93 61 49,020 50,572 109 129
Del. 75 145 1,404 - - 1 762 639 - -
Md. 718 1,071 4,713 3,917 14 4 5,431 6,435 5 3
D.C. 481 613 N N 2 - 1,911 2,378 - -
Va. 425 654 6,476 6,520 N 25 3,604 4,496 7 18
W. Va. 57 62 1,485 1,605 5 3 432 504 4 11
N.C. 390 429 12,003 9,350 15 20 10,095 9,035 14 33
S.C. 386 422 10,270 6,935 4 1 6,642 6,223 3 27
Ga. 616 972 13,486 9,647 33 - 11,212 11,019 9 -
Fla. 2,752 3,820 11,133 14,002 20 7 8,931 9,843 67 37
E.S. CENTRAL 936 1,074 19,940 18,787 59 25 18,930 18,743 93 203
Ky. 127 177 3,438 3,636 16 - 1,959 2,320 16 9
Tenn. 333 469 7,198 7,006 27 22 6,160 5,811 74 134
Ala. 274 239 5,644 4,548 16 2 7,123 6,412 3 6
Miss. 202 189 3,660 3,597 U 1 3,688 4,200 U 54
W.S. CENTRAL 2,899 3,546 42,636 30,152 72 8 24,282 20,242 534 247
Ark. 104 130 1,939 1,598 6 3 1,190 2,652 3 9
La. 512 610 7,863 4,904 3 2 6,485 4,581 17 118
Okla. 170 165 5,459 4,077 10 3 3,011 2,560 7 5
Tex. 2,113 2,641 27,375 19,573 53 - 13,596 10,449 507 115
MOUNTAIN 831 935 11,698 15,576 153 61 4,369 4,237 244 170
Mont. 15 26 696 580 8 - 26 25 5 12
Idaho 15 28 946 818 14 7 91 61 86 30
Wyo. 2 13 357 315 47 - 17 29 45 41
Colo. 147 224 3 3,454 31 20 1,270 1,194 15 18
N. Mex. 130 80 2,083 2,089 13 6 500 478 56 32
Ariz. 329 227 6,081 5,731 13 12 2,201 1,819 3 22
Utah 65 80 1,223 942 20 10 126 137 21 3
Nev. 128 257 309 1,647 7 6 138 494 13 12
PACIFIC 3,370 4,518 46,483 38,291 155 97 9,510 8,885 504 553
Wash. 236 377 6,167 5,023 28 22 1,056 1,069 11 17
Oreg. 93 162 3,136 2,702 38 34 440 421 2 2
Calif. 2,962 3,914 35,123 28,832 87 35 7,643 6,908 436 440
Alaska 12 28 1,039 797 2 - 168 219 1 -
Hawaii 67 37 1,018 937 N 6 203 268 54 94
Guam - 2 8 193 N - 2 27 - -
P.R. 1,001 1,019 U U - U 228 353 - -
V.I. 17 57 N N N U U U U U
Amer. Samoa - - U U N U U U U U
C.N.M.I. - 1 N N N U 14 17 - 2
------------------------------------------------------------------------------------------------------------------------------
N: Not notifiable U: Unavailable -: no reported cases C.N.M.I.: Commonwealth of North Mariana Islands
* Updated monthly to the Division of HIV/AIDS Prevention, -- Surveillance and Epidemiology, National Center for HIV, STD,
and TB Prevention, last update June 28, 1998.
** National Electronic Telecommunications System for Surveillance.
*** Public Health Laboratory Information System.
=======================================================================================================================================================
TABLE II. (page 2) Provisional cases of selected notifiable diseases, United States, weeks ending
July 25, 1998, and July 19, 1997 (29th Week)
Lyme Syphilis Rabies,
Legionellosis Disease Malaria (Primary & Secondary) Tuberculosis Animal
---------------- ---------------- ---------------- --------------------- ----------------- -------
Cum. Cum. Cum. Cum. Cum. Cum. Cum. Cum. Cum. Cum. Cum.
Reporting Area 1998 1997 1998 1997 1998 1997 1998 1997 1998 * 1997 1998
-------------------------------------------------------------------------------------------------------------------------------------------
UNITED STATES 611 471 4,563 3,318 638 885 3,909 4,669 7,016 8,836 3,861
NEW ENGLAND 35 33 1,675 734 41 44 40 95 232 244 730
Maine 1 1 6 7 4 1 1 - 4 16 120
N.H. 3 4 26 7 3 2 1 - 6 9 35
Vt. 3 4 6 3 - 2 4 - 1 3 31
Mass. 12 10 307 172 14 21 24 45 123 134 238
R.I. 8 5 165 53 2 4 - 2 31 17 42
Conn. 8 9 1,165 492 18 14 10 48 67 65 264
MID. ATLANTIC 135 82 2,324 2,022 149 270 139 228 1,293 1,684 887
Upstate N.Y. 39 21 1,402 744 43 39 18 24 166 220 616
N.Y. City 19 7 10 106 68 171 29 48 810 867 U
N.J. 7 14 412 562 22 45 49 97 317 335 109
Pa. 70 40 500 610 16 15 43 59 U 262 162
E.N. CENTRAL 194 164 48 48 55 87 515 406 544 985 74
Ohio 82 71 40 15 3 11 76 120 U 169 40
Ind. 36 28 7 11 6 8 112 89 76 82 4
Ill. 14 7 - 7 18 37 188 51 296 509 5
Mich. 41 37 1 15 27 20 104 72 172 164 19
Wis. 21 21 U U 1 11 35 74 U 61 6
W.N. CENTRAL 41 32 42 42 48 28 82 98 203 296 444
Minn. 3 1 23 20 24 10 5 14 74 77 78
Iowa 4 8 13 2 5 6 - 4 U 34 97
Mo. 14 4 1 15 10 6 64 56 86 115 19
N. Dak. - 2 - - 2 2 - - 3 6 89
S. Dak. 2 2 - - - - 1 - 14 7 90
Nebr. 15 12 3 2 1 1 4 1 8 12 3
Kans. 3 3 2 3 6 3 8 23 18 45 68
S. ATLANTIC 74 63 338 318 146 138 1,720 1,860 1,089 1,772 1,171
Del. 8 7 8 73 1 2 15 15 U 18 17
Md. 17 13 237 198 45 44 394 515 162 165 291
D.C. 5 3 4 7 12 10 43 71 62 57 -
Va. 8 13 31 11 26 38 92 148 144 165 357
W. Va. N N 6 1 - - 2 3 24 29 49
N.C. 6 8 20 15 12 8 425 404 216 219 136
S.C. 5 3 3 1 4 9 170 222 181 194 92
Ga. 2 - 2 1 15 15 455 308 230 323 106
Fla. 23 16 27 11 31 12 124 174 70 602 123
E.S. CENTRAL 30 31 43 46 16 19 606 1,014 362 700 138
Ky. 15 7 10 8 2 5 67 85 - 103 21
Tenn. 11 17 22 20 10 4 315 430 200 258 85
Ala. 4 2 11 4 4 7 145 258 162 221 32
Miss. U 5 U 14 U 3 79 241 U 118 U
W.S. CENTRAL 20 8 10 36 18 10 511 681 64 1,402 109
Ark. - 1 5 11 1 2 67 106 64 118 21
La. 2 2 - 2 4 5 191 212 U 102 -
Okla. 8 1 - 5 2 3 32 67 U 122 88
Tex. 10 4 5 18 11 - 221 296 U 1,060 -
MOUNTAIN 35 29 7 6 29 45 123 91 231 321 94
Mont. 1 1 - - - 2 - - 12 6 32
Idaho - 2 1 2 3 - - - 8 8 -
Wyo. 1 1 - 1 - 2 1 - 2 2 43
Colo. 7 9 3 - 9 23 8 5 U 56 1
N. Mex. 2 1 2 - 11 6 12 4 33 27 3
Ariz. 7 7 - 1 5 5 97 72 114 145 9
Utah 16 5 - - 1 3 3 3 33 13 6
Nev. 1 3 1 2 - 4 2 7 29 64 -
PACIFIC 47 29 76 66 136 244 173 196 2,998 1,432 214
Wash. 7 6 2 2 9 9 12 7 144 169 -
Oreg. - - 8 10 11 13 3 5 66 94 1
Calif. 39 22 65 54 114 214 158 182 2,672 1,014 193
Alaska - - 1 - 1 3 - 1 27 47 20
Hawaii 1 1 - - 1 5 - 1 89 108 -
Guam - - - - - - - 3 - 13 -
P.R. - - - - - 3 118 134 46 129 30
V.I. U U U U U U U U U U U
Amer. Samoa U U U U U U U U U U U
C.N.M.I. - - - - - - 98 9 54 2 -
-------------------------------------------------------------------------------------------------------------------------------------------
N: Not notifiable U: Unavailable -: no reported cases
* Additional information about areas displaying 'U' for cumulative Tuberculosis cases can be found in Notices to Readers, MMWR Vol. 47, No. 2, p. 39.
=======================================================================================================================================================
Return to top. Table_III Note: To print large tables and graphs users may have to change their printer settings to landscape and use a small font size.
TABLE III. (page 1) Provisional cases of selected notifiable diseases preventable by vaccination, United
States, weeks ending July 25, 1998, and July 19, 1997 (29th Week)
Hepatitis (Viral), by type Measles (Rubeola)
H. influenzae, --------------------------------------- ------------------------------------------------------------
invasive A B Indigenous Imported** Total
---------------- ----------------- ----------------- --------------- --------------- ---------------
Cum. Cum. Cum. Cum. Cum. Cum. Cum. Cum. Cum. Cum.
Reporting Area 1998* 1997 1998 1997 1998 1997 1998 1998 1998 1998 1998 1997
-----------------------------------------------------------------------------------------------------------------------------------------------------
UNITED STATES 624 666 12,053 15,445 4,496 5,149 - 26 - 14 40 90
NEW ENGLAND 34 36 150 395 74 95 - 1 - 2 3 13
Maine 2 3 13 45 2 6 - - - - - -
N.H. 6 5 8 21 10 6 - - - - - 1
Vt. 2 3 13 7 1 5 - - - 1 1 -
Mass. 22 22 46 167 18 40 - 1 - 1 2 11
R.I. 2 2 10 80 43 9 - - - - - -
Conn. - 1 60 75 - 29 - - - - - 1
MID. ATLANTIC 88 93 767 1,244 640 748 - 9 - 2 11 21
Upstate N.Y. 35 25 188 175 176 149 - 2 - - 2 5
N.Y. City 16 24 204 562 172 283 - - - - - 7
N.J. 32 30 160 187 105 148 - 7 - 1 8 3
Pa. 5 14 215 320 187 168 - - - 1 1 6
E.N. CENTRAL 95 110 1,577 1,616 463 862 - 11 - 3 14 8
Ohio 35 60 194 207 43 48 - - - 1 1 -
Ind. 27 11 95 178 59 69 - 2 - 1 3 -
Ill. 29 25 261 414 89 166 - - - - - 6
Mich. - 14 914 696 250 250 - 9 - 1 10 2
Wis. 4 - 113 121 22 329 - - - - - -
W.N. CENTRAL 60 34 958 1,161 243 281 - - - - - 11
Minn. 46 25 78 104 21 23 - - - - - 2
Iowa 1 3 382 193 37 21 - - - - - -
Mo. 8 3 391 618 151 206 - - - - - 1
N. Dak. - - 3 10 4 3 - - - - - -
S. Dak. - 2 17 14 1 - - - - - - 8
Nebr. - 1 23 49 9 8 - - - - - -
Kans. 5 - 64 173 20 20 - - - - - -
S. ATLANTIC 132 105 1,016 864 640 625 - 2 - 5 7 8
Del. - - 2 16 - 4 - - - 1 1 -
Md. 41 44 187 124 94 94 - - - 1 1 2
D.C. - - 30 15 6 24 - - - - - 1
Va. 13 7 137 114 56 74 - - - 2 2 1
W. Va. 4 3 1 6 3 9 - - - - - -
N.C. 18 17 59 113 119 134 - - - - - 1
S.C. 4 3 18 69 21 62 - - - - - -
Ga. 26 22 268 195 96 64 - - - 1 1 1
Fla. 26 9 314 212 245 160 - 2 - - 2 2
E.S. CENTRAL 36 38 206 372 220 380 - - - - - 1
Ky. 4 5 13 46 24 25 - - - - - -
Tenn. 24 23 144 229 163 255 - - - - - -
Ala. 8 8 49 58 33 41 - - - - - 1
Miss. U 2 U 39 U 59 U U U U U -
W.S. CENTRAL 36 32 2,294 3,126 746 649 - - - - - 5
Ark. - 2 58 134 52 47 - - - - - -
La. 16 7 46 117 57 82 - - - - - -
Okla. 18 21 332 924 48 22 - - - - - -
Tex. 2 2 1,858 1,951 589 498 - - - - - 5
MOUNTAIN 69 63 1,876 2,352 490 483 - - - - - 7
Mont. - - 63 53 3 5 - - - - - -
Idaho - 1 158 82 19 15 - - - - - -
Wyo. 1 2 24 20 2 14 - - - - - -
Colo. 15 10 148 252 62 91 - - - - - -
N. Mex. 5 7 88 183 211 159 - - - - - -
Ariz. 38 26 1,199 1,154 126 111 - - - - - 5
Utah 4 3 127 365 42 56 - - - - - -
Nev. 6 14 69 243 25 32 U - U - - 2
PACIFIC 74 155 3,209 4,315 980 1,026 - 3 - 2 5 16
Wash. 6 2 634 302 69 45 - - - 1 1 -
Oreg. 30 24 223 224 66 63 - - - - - -
Calif. 30 121 2,315 3,682 834 899 - 3 - 1 4 12
Alaska 1 2 14 24 6 11 - - - - - -
Hawaii 7 6 23 83 5 8 - - - - - 4
Guam - - - - - 3 U - U - - -
P.R. 2 - 28 191 257 435 - - - - - -
V.I. U U U U U U U U U U U U
Amer. Samoa U U U U U U U U U U U U
C.N.M.I. - 6 1 1 28 34 U - U - - 1
-----------------------------------------------------------------------------------------------------------------------------------------------------
N: Not notifiable U: Unavailable -: no reported cases
* Of 146 cases among children aged <5 years, serotype was reported for 79 and of those, 33 were type b.
** For imported measles, cases include only those resulting from importation from other countries.
=======================================================================================================================================================
TABLE III. (page 2) Provisional cases of selected notifiable diseases preventable by vaccination, United
States, weeks ending July 25, 1998, and July 19, 1997 (29th Week)
Meningococcal
Disease Mumps Pertussis Rubella
----------------- -------------------------- --------------------------- ---------------------------
Cum. Cum. Cum. Cum. Cum. Cum. Cum. Cum.
Reporting Area 1998 1997 1998 1998 1997 1998 1998 1997 1998 1998 1997
------------------------------------------------------------------------------------------------------------------------------------------
UNITED STATES 1,653 2,145 5 266 376 71 2,519 2,946 2 287 121
NEW ENGLAND 75 134 - 1 7 17 456 592 - 36 1
Maine 5 15 - - - - 5 6 - - -
N.H. 4 12 - - - - 39 69 - - -
Vt. 1 2 - - - 2 44 180 - - -
Mass. 37 70 - 1 2 11 338 314 - 6 1
R.I. 3 9 - - 4 - 5 12 - 1 -
Conn. 25 26 - - 1 4 25 11 - 29 -
MID. ATLANTIC 152 225 - 16 43 4 298 225 2 121 29
Upstate N.Y. 38 62 - 3 9 3 149 83 - 107 5
N.Y. City 18 40 - 4 3 1 9 53 2 9 24
N.J. 41 43 - 1 7 - 5 11 - 4 -
Pa. 55 80 - 8 24 - 135 78 - 1 -
E.N. CENTRAL 251 318 3 46 47 4 216 284 - - 5
Ohio 92 116 1 20 18 3 79 85 - - -
Ind. 46 35 - 5 4 - 68 33 - - -
Ill. 60 91 1 3 8 - 16 35 - - 1
Mich. 29 47 1 18 14 1 36 31 - - -
Wis. 24 29 - - 3 - 17 100 - - 4
W.N. CENTRAL 140 162 - 20 12 17 210 172 - 27 -
Minn. 25 29 - 10 5 15 130 108 - - -
Iowa 23 37 - 6 6 - 40 9 - - -
Mo. 53 70 - 3 - - 16 31 - 2 -
N. Dak. 2 1 - 1 - - - 1 - - -
S. Dak. 6 4 - - - 1 6 3 - - -
Nebr. 7 6 - - 1 1 8 4 - - -
Kans. 24 15 - - - - 10 16 - 25 -
S. ATLANTIC 292 362 - 37 45 6 147 262 - 8 56
Del. 1 5 - - - - 2 - - - -
Md. 23 35 - - 1 - 29 82 - - -
D.C. - 5 - - - - 1 3 - - -
Va. 24 35 - 5 7 - 7 32 - - 1
W. Va. 9 14 - - - - 1 5 - - -
N.C. 42 69 - 9 7 - 50 73 - 5 49
S.C. 41 40 - 4 10 1 17 11 - - 6
Ga. 64 72 - 1 6 - 6 8 - - -
Fla. 88 87 - 18 14 5 34 48 - 3 -
E.S. CENTRAL 116 155 - 1 19 2 58 60 - - 1
Ky. 17 38 - - 3 - 22 16 - - -
Tenn. 45 54 - 1 3 1 19 23 - - -
Ala. 54 46 - - 6 1 17 15 - - 1
Miss. U 17 U U 7 U U 6 U U -
W.S. CENTRAL 190 200 - 40 44 - 181 110 - 77 3
Ark. 23 25 - - 1 - 26 8 - - -
La. 39 43 - 8 11 - 2 12 - - -
Okla. 29 23 - - - - 18 15 - - -
Tex. 99 109 - 32 32 - 135 75 - 77 3
MOUNTAIN 91 124 1 24 48 17 553 742 - 5 5
Mont. 3 7 - - - - 3 9 - - -
Idaho 4 8 - 3 2 - 194 455 - - 1
Wyo. 4 1 - 1 1 - 7 5 - - -
Colo. 19 33 1 6 3 9 120 194 - - -
N. Mex. 16 20 N N N 2 69 39 - 1 -
Ariz. 32 31 - 5 31 4 118 20 - 1 4
Utah 10 11 - 3 6 2 30 10 - 2 -
Nev. 3 13 U 6 5 U 12 10 U 1 -
PACIFIC 346 465 1 81 111 4 400 499 - 13 21
Wash. 47 55 - 6 13 - 153 210 - 9 5
Oreg. 55 92 N N N 2 29 22 - - -
Calif. 239 315 1 60 81 2 211 250 - 2 8
Alaska 1 1 - 2 5 - 2 4 - - -
Hawaii 4 2 - 13 12 - 5 13 - 2 8
Guam - 1 U - 1 U - - U - -
P.R. 6 8 - 1 5 - 2 - - - -
V.I. U U U U U U U U U U U
Amer. Samoa U U U U U U U U U U U
C.N.M.I. - - U 2 4 U 1 - U - -
------------------------------------------------------------------------------------------------------------------------------------------
N: Not notifiable U: Unavailable -: no reported cases
=======================================================================================================================================================
Return to top. Table_IV Note: To print large tables and graphs users may have to change their printer settings to landscape and use a small font size.
TABLE IV. Deaths in 122 U.S. cities,* week ending
July 25, 1998 (29th Week)
===================================================================================================================================
All Causes, By Age (Years)
------------------------------------------------------------------------ P&I**
Reporting Area All Ages >=65 45-64 25-44 1-24 <1 Total
---------------------------------------------------------------------------------------------------------------
NEW ENGLAND 543 379 98 42 13 11 32
Boston, Mass. 141 95 27 13 3 3 10
Bridgeport, Conn. 35 25 8 1 - 1 3
Cambridge, Mass. 15 10 4 1 - - 1
Fall River, Mass. 18 15 2 1 - - 2
Hartford, Conn. 55 34 10 9 1 1 -
Lowell, Mass. 25 18 3 3 1 - -
Lynn, Mass. 6 4 2 - - - 1
New Bedford, Mass. 14 10 2 1 1 - 1
New Haven, Conn. 31 16 8 4 2 1 1
Providence, R.I. 66 49 11 3 2 1 -
Somerville, Mass. 6 4 2 - - - -
Springfield, Mass. 33 18 11 1 2 1 -
Waterbury, Conn. 41 30 7 2 1 1 3
Worcester, Mass. 57 51 1 3 - 2 10
MID. ATLANTIC 2,211 1,483 449 189 51 39 88
Albany, N.Y. 58 33 17 4 2 2 4
Allentown, Pa. 18 11 5 - 2 - -
Buffalo, N.Y. 71 52 15 4 - - 7
Camden, N.J. 34 22 7 1 1 3 -
Elizabeth, N.J. 20 15 3 2 - - -
Erie, Pa. 41 31 5 4 - 1 3
Jersey City, N.J. 28 13 8 5 - 2 -
New York City, N.Y. 1,144 760 232 118 21 13 31
Newark, N.J. U U U U U U U
Paterson, N.J. 17 8 5 3 - 1 -
Philadelphia, Pa. 400 265 76 32 15 12 22
Pittsburgh, Pa.*** 58 38 16 3 - 1 3
Reading, Pa. 38 33 3 2 - - 1
Rochester, N.Y. 112 82 19 8 2 1 3
Schenectady, N.Y. 26 17 7 - 1 1 2
Scranton, Pa. 22 12 5 1 4 - -
Syracuse, N.Y. 77 61 14 - 1 1 9
Trenton, N.J. 28 15 9 2 1 1 2
Utica, N.Y. 19 15 3 - 1 - 1
Yonkers, N.Y. U U U U U U U
E.N. CENTRAL 1,549 1,101 250 92 66 40 79
Akron, Ohio 34 27 4 1 1 1 1
Canton, Ohio 37 29 6 2 - - 4
Chicago, Ill. U U U U U U U
Cincinnati, Ohio 96 62 14 6 7 7 5
Cleveland, Ohio 133 91 24 8 5 5 5
Columbus, Ohio 190 130 38 15 4 3 12
Dayton, Ohio 106 77 15 6 3 5 6
Detroit, Mich. 180 108 39 18 11 4 3
Evansville, Ind. 39 32 3 1 3 - 1
Fort Wayne, Ind. 60 45 11 2 2 - 5
Gary, Ind. 13 4 4 1 3 1 -
Grand Rapids, Mich. 52 43 4 1 1 3 4
Indianapolis, Ind. 174 126 24 12 8 4 5
Lansing, Mich. 35 27 7 - 1 - 8
Milwaukee, Wis. 104 79 19 3 2 1 5
Peoria, Ill. 51 40 6 - 4 1 2
Rockford, Ill. 39 30 3 3 2 1 3
South Bend, Ind. 48 39 4 3 2 - 4
Toledo, Ohio 103 70 19 8 5 1 4
Youngstown, Ohio 55 42 6 2 2 3 2
W.N. CENTRAL 764 523 144 48 25 19 36
Des Moines, Iowa 64 43 11 7 1 2 5
Duluth, Minn. 39 24 10 5 - - 2
Kansas City, Kans. 40 19 15 3 3 - 1
Kansas City, Mo. 68 43 10 6 3 1 1
Lincoln, Nebr. 33 28 4 - 1 - 2
Minneapolis, Minn. 191 135 37 13 3 3 8
Omaha, Nebr. 72 51 13 2 3 3 7
St. Louis, Mo. 112 70 21 5 8 8 5
St. Paul, Minn. 55 47 7 1 - - 2
Wichita, Kans. 90 63 16 6 3 2 3
S. ATLANTIC 951 626 196 84 24 21 49
Atlanta, Ga. U U U U U U U
Baltimore, Md. 126 68 37 13 5 3 10
Charlotte, N.C. 85 61 13 6 1 4 10
Jacksonville, Fla. 140 102 24 11 1 2 5
Miami, Fla. 100 70 19 9 1 1 -
Norfolk, Va. 41 34 3 2 1 1 1
Richmond, Va. 66 40 13 8 4 1 2
Savannah, Ga. 40 27 10 1 1 1 4
St. Petersburg, Fla. 47 34 8 3 2 - 2
Tampa, Fla. 164 114 29 16 4 1 12
Washington, D.C. 129 69 35 14 4 7 3
Wilmington, Del. 13 7 5 1 - - -
E.S. CENTRAL 607 415 112 42 23 14 28
Birmingham, Ala. U U U U U U U
Chattanooga, Tenn. 89 61 17 3 8 - 5
Knoxville, Tenn. 92 69 17 4 - 2 10
Lexington, Ky. 71 46 13 6 4 2 2
Memphis, Tenn. 122 81 27 6 3 5 9
Mobile, Ala. 67 44 13 4 4 2 -
Montgomery, Ala. 43 34 2 6 - 1 1
Nashville, Tenn. 123 80 23 13 4 2 1
W.S. CENTRAL 1,438 926 281 134 45 52 91
Austin, Tex. 80 54 14 10 2 - 4
Baton Rouge, La. 21 15 3 2 - 1 -
Corpus Christi, Tex. 52 39 7 3 3 - 4
Dallas, Tex. 209 123 47 20 5 14 5
El Paso, Tex. 60 43 9 4 2 2 3
Ft. Worth, Tex. 106 75 14 6 8 3 9
Houston, Tex. 351 200 81 47 10 13 25
Little Rock, Ark. 71 43 19 2 3 4 4
New Orleans, La. 91 58 21 8 2 2 -
San Antonio, Tex. 187 132 31 16 5 3 15
Shreveport, La. 97 67 19 7 4 - 10
Tulsa, Okla. 113 77 16 9 1 10 12
MOUNTAIN 939 624 170 94 33 18 55
Albuquerque, N.M. 73 43 15 10 5 - 1
Boise, Idaho 43 35 5 1 - 2 6
Colo. Springs, Colo. 43 24 8 7 2 2 1
Denver, Colo. 113 67 26 14 2 4 6
Las Vegas, Nev. 225 156 39 16 11 3 10
Ogden, Utah 22 14 3 2 3 - 2
Phoenix, Ariz. 173 119 23 19 6 6 14
Pueblo, Colo. 38 30 6 2 - - 2
Salt Lake City, Utah 111 75 19 14 2 1 8
Tucson, Ariz. 98 61 26 9 2 - 5
PACIFIC 1,875 1,338 331 132 29 45 143
Berkeley, Calif. 18 14 2 - - 2 1
Fresno, Calif. 127 91 21 13 2 - 7
Glendale, Calif. 52 39 11 2 - - 3
Honolulu, Hawaii 83 58 19 2 2 2 6
Long Beach, Calif. 68 51 12 2 - 3 11
Los Angeles, Calif. 594 444 100 37 5 8 35
Pasadena, Calif. 20 12 3 1 - 4 2
Portland, Oreg. U U U U U U U
Sacramento, Calif. 195 137 28 22 3 5 24
San Diego, Calif. 113 68 28 9 6 2 9
San Francisco, Calif. 118 78 21 11 1 7 9
San Jose, Calif. 184 131 37 10 2 4 21
Santa Cruz, Calif. 34 27 4 3 - - 8
Seattle, Wash. 144 95 25 14 7 3 3
Spokane, Wash. 54 42 8 2 - 2 2
Tacoma, Wash. 71 51 12 4 1 3 2
TOTAL 10,877**** 7,415 2,031 857 309 259 601
---------------------------------------------------------------------------------------------------------------
U: Unavailable -: no reported cases
* Mortality data in this table are voluntarily reported from 122 cities in the United States, most of which have populations
of 100,000 or more. A death is reported by the place of its occurrence and by the week that the death certificate was
filed. Fetal deaths are not included.
** Pneumonia and influenza.
*** Because of changes in reporting methods in this Pennsylvania city, these numbers are partial counts for the current
week. Complete counts will be available in 4 to 6 weeks.
**** Total includes unknown ages.
===================================================================================================================================
Return to top. Disclaimer All MMWR HTML versions of articles are electronic conversions from ASCII text into HTML. This conversion may have resulted in character translation or format errors in the HTML version. Users should not rely on this HTML document, but are referred to the electronic PDF version and/or the original MMWR paper copy for the official text, figures, and tables. An original paper copy of this issue can be obtained from the Superintendent of Documents, U.S. Government Printing Office (GPO), Washington, DC 20402-9371; telephone: (202) 512-1800. Contact GPO for current prices. **Questions or messages regarding errors in formatting should be addressed to mmwrq@cdc.gov.Page converted: 10/05/98 |
|||||||||
This page last reviewed 5/2/01
|