 |
|
|
|
|
|
|
| ||||||||||
|
|
|
|
|
|
|
||||
| ||||||||||
|
|
|
|
|
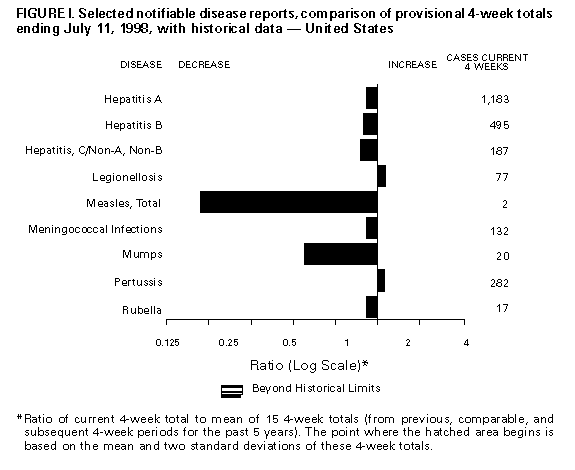
Persons using assistive technology might not be able to fully access information in this file. For assistance, please send e-mail to: mmwrq@cdc.gov. Type 508 Accommodation and the title of the report in the subject line of e-mail. Notifiable Diseases/Deaths in Selected Cities Weekly InformationFigure_I Selected notifiable disease reports, comparison of provisional 4-week totals ending July 11, 1998, with historical data -- United States Table_I Summary -- provisional cases of selected notifiable diseases, United States, cumulative, week ending July 11, 1998 (27th Week) Table_II Provisional cases of selected notifiable diseases, United States, weeks ending July 11, 1998 and July 5, 1997 (27th Week) Table_III Provisional cases of selected notifiable diseases preventable by vaccination, United States, weeks ending July 11, 1998 and July 5, 1997 (27th Week) Table_IV Deaths in 122 U.S. cities, week ending
July 11, 1998 (27th Week)
TABLE I. Summary -- provisional cases of specified notifiable diseases, United
States, cumulative, week ending July 11, 1998 (27th Week)
==================================================================================
                                             Cum. 1998
------------------------------------------------------
Anthrax                                              -
Brucellosis                                         37
Cholera                                              5
Congenital rubella syndrome                          3
Cryptosporidiosis*                                 956
Diphtheria                                           1
Encephalitis:  California*                           2
               eastern equine*                       -
               St. Louis*                            -
               western equine*                       -
Hansen Disease                                      60
Hantavirus pulmonary syndrome*+                      1
Hemolytic uremic syndrome, post-diarrheal*          19
HIV infection, pediatric*&                         127
Plague                                               3
Poliomyelitis, paralytic                             1
Psittacosis                                         26
Rabies, human                                        -
Rocky Mountain spotted fever (RMSF)                 97
Streptococcal disease, invasive Group A          1,327
Streptococcal toxic-shock syndrome*                 34
Syphilis, congenital@                              128
Tetanus                                             16
Toxic-shock syndrome                                67
Trichinosis                                          6
Typhoid fever                                      143
Yellow fever                                         -
------------------------------------------------------
-: no reported cases
 * Not notifiable in all states
 + Updated weekly from reports to the Division of Viral and Rickettsial
   Diseases, National Center for Infectious Diseases (NCID).
 & Updated monthly to the Division of HIV/AIDS Prevention -- Surveillance
   and Epidemiology, National Center for HIV, STD, and TB Prevention
   (NCHSTP), last update June 28, 1998.
 @ Updated from reports to the Division of STD Prevention, NCHSTP.

==================================================================================
Return to top. Table_II Note: To print large tables and graphs users may have to change their printer settings to landscape and use a small font size.
TABLE II. (page 1) Provisional cases of selected notifiable diseases, United States, weeks ending
July 11, 1998, and July 5, 1997 (27th Week)
Escherichia
coli O157:H7
------------------- Hepatitis
AIDS* Chlamydia NETSS** PHLIS*** Gonorrhea C\NA,NB
----------------- -------------------- -------- -------- ------------------- ----------------
Cum. Cum. Cum. Cum. Cum. Cum. Cum. Cum. Cum. Cum.
Reporting Area 1998 1997 1998 1997 1998 1998 1998 1997 1998 1997
------------------------------------------------------------------------------------------------------------------------------
UNITED STATES 23,929 31,182 270,066 254,987 912 405 156,074 149,479 2,047 1,749
NEW ENGLAND 830 1,269 9,988 8,809 126 90 2,713 2,991 27 35
Maine 18 28 499 484 12 - 35 29 - -
N.H. 22 17 473 397 18 18 48 58 - -
Vt. 10 24 206 201 6 4 13 25 - 1
Mass. 386 462 4,297 3,633 64 52 1,030 1,122 25 30
R.I. 67 83 1,276 1,019 5 1 183 242 2 4
Conn. 327 655 3,237 3,075 21 15 1,404 1,515 - -
MID. ATLANTIC 6,951 9,760 32,453 27,987 85 18 18,000 18,042 216 161
Upstate N.Y. 849 1,620 N N 62 - 3,015 3,142 166 117
N.Y. City 3,910 4,965 17,563 13,618 3 6 7,676 6,730 - -
N.J. 1,232 2,027 5,208 5,028 20 11 2,880 3,723 - -
Pa. 960 1,148 9,682 9,341 N 1 4,429 4,447 50 44
E.N. CENTRAL 1,768 2,165 44,106 37,200 173 78 30,201 22,040 266 336
Ohio 331 432 12,419 11,343 39 16 7,564 6,969 7 8
Ind. 326 360 2,864 4,396 52 22 1,851 2,960 3 10
Ill. 706 760 13,079 6,758 43 - 10,460 3,308 14 56
Mich. 305 473 11,206 9,173 39 20 8,523 6,529 242 243
Wis. 100 140 4,538 5,530 N 20 1,803 2,274 - 19
W.N. CENTRAL 444 613 16,074 16,239 112 51 7,886 7,275 115 34
Minn. 65 99 3,098 3,366 38 26 1,081 1,170 6 2
Iowa 49 69 2,010 2,397 33 - 638 647 11 17
Mo. 209 294 6,110 5,986 13 17 4,538 3,928 94 4
N. Dak. 4 6 290 437 2 5 29 33 - 2
S. Dak. 9 3 827 642 8 1 133 69 - -
Nebr. 39 59 1,102 1,036 7 - 366 392 2 2
Kans. 69 83 2,637 2,375 11 2 1,101 1,036 2 7
S. ATLANTIC 5,900 7,766 56,698 48,317 71 29 45,618 46,771 103 113
Del. 75 144 1,292 - - 1 702 601 - -
Md. 718 954 4,324 3,710 13 4 4,787 5,951 5 3
D.C. 481 598 N N 1 - 1,794 2,175 - -
Va. 425 650 5,581 5,809 N 7 3,339 4,003 5 11
W. Va. 57 57 1,426 1,488 N 2 410 471 4 9
N.C. 390 429 11,370 8,755 12 10 9,536 8,370 12 29
S.C. 386 403 9,723 6,499 3 - 6,282 5,779 3 26
Ga. 616 970 12,914 8,850 24 - 10,678 10,154 9 -
Fla. 2,752 3,561 10,068 13,206 15 5 8,090 9,267 65 35
E.S. CENTRAL 936 1,019 18,539 17,503 51 11 17,517 17,312 81 195
Ky. 127 177 3,125 3,492 13 - 1,789 2,186 16 8
Tenn. 333 414 6,593 6,490 24 10 5,640 5,393 62 127
Ala. 274 239 5,161 4,140 14 - 6,400 5,916 3 6
Miss. 202 189 3,660 3,381 U 1 3,688 3,817 U 54
W.S. CENTRAL 2,899 3,174 36,650 29,070 53 8 21,054 19,271 514 215
Ark. 104 120 1,727 1,466 4 3 1,162 2,438 3 7
La. 512 562 6,732 4,276 - 2 5,638 4,000 10 115
Okla. 170 165 5,093 3,755 5 3 2,786 2,384 4 4
Tex. 2,113 2,327 23,098 19,573 44 - 11,468 10,449 497 89
MOUNTAIN 831 900 11,090 14,341 108 50 4,023 3,908 239 160
Mont. 15 22 655 534 6 - 25 20 5 12
Idaho 15 28 919 754 9 1 85 57 87 24
Wyo. 2 13 330 290 21 - 15 27 43 40
Colo. 147 224 - 3,142 26 18 1,180 1,083 14 19
N. Mex. 130 80 1,986 2,000 10 6 394 465 53 32
Ariz. 329 227 5,723 5,249 N 9 2,072 1,670 3 21
Utah 65 73 1,168 854 16 10 114 124 21 3
Nev. 128 233 309 1,518 7 6 138 462 13 9
PACIFIC 3,370 4,516 44,468 55,521 133 70 9,062 11,869 486 500
Wash. 236 377 5,717 4,703 27 22 986 983 10 16
Oreg. 93 162 2,910 2,475 33 27 402 380 2 2
Calif. 2,962 3,913 33,849 46,714 71 18 7,312 10,043 419 396
Alaska 12 28 974 751 2 - 159 211 1 -
Hawaii 67 36 1,018 878 N 3 203 252 54 86
Guam - 2 8 193 N - 2 27 - -
P.R. 1,001 1,019 U U - U 223 339 - -
V.I. 17 51 N N N U U U U U
Amer. Samoa - - U U N U U U U U
C.N.M.I. - 1 N N N U 14 16 - 2
------------------------------------------------------------------------------------------------------------------------------
N: Not notifiable U: Unavailable -: no reported cases C.N.M.I.: Commonwealth of North Mariana Islands
* Updated monthly to the Division of HIV/AIDS Prevention, -- Surveillance and Epidemiology, National Center for HIV, STD,
and TB Prevention, last update June 28, 1998.
** National Electronic Telecommunications System for Surveillance.
*** Public Health Laboratory Information System.
=======================================================================================================================================================
TABLE II. (page 2) Provisional cases of selected notifiable diseases, United States, weeks ending
July 11, 1998, and July 5, 1997 (27th Week)
Lyme Syphilis Rabies,
Legionellosis Disease Malaria (Primary & Secondary) Tuberculosis Animal
---------------- ---------------- ---------------- --------------------- ----------------- -------
Cum. Cum. Cum. Cum. Cum. Cum. Cum. Cum. Cum. Cum. Cum.
Reporting Area 1998 1997 1998 1997 1998 1997 1998 1997 1998 * 1997 1998
-------------------------------------------------------------------------------------------------------------------------------------------
UNITED STATES 553 430 3,610 2,601 579 792 3,393 4,414 6,565 8,887 3,571
NEW ENGLAND 30 27 1,229 613 38 42 38 88 226 226 684
Maine 1 1 6 3 4 1 1 - 4 15 114
N.H. 3 4 18 7 3 2 1 - 6 6 34
Vt. 2 4 5 3 - 2 3 - 1 3 31
Mass. 10 8 199 122 11 19 24 40 121 124 224
R.I. 8 5 90 43 2 4 - 2 30 16 36
Conn. 6 5 911 435 18 14 9 46 64 62 245
MID. ATLANTIC 119 73 1,937 1,569 138 235 105 216 1,283 1,584 784
Upstate N.Y. 35 18 1,094 566 38 35 17 24 155 210 541
N.Y. City 19 4 10 82 65 145 25 42 730 813 U
N.J. 4 14 350 415 20 41 20 94 295 316 100
Pa. 61 37 483 506 15 14 43 56 103 245 143
E.N. CENTRAL 176 154 43 39 49 83 484 381 468 936 66
Ohio 75 67 37 12 3 9 74 112 5 153 39
Ind. 33 27 5 10 2 7 100 76 6 81 4
Ill. 14 5 - 6 18 37 180 47 285 496 5
Mich. 34 34 1 11 25 19 104 72 172 149 15
Wis. 20 21 U U 1 11 26 74 U 57 3
W.N. CENTRAL 38 29 22 32 38 26 76 91 126 269 390
Minn. 3 1 9 15 18 9 5 13 U 70 73
Iowa 4 7 9 1 3 6 - 3 U 30 86
Mo. 14 4 1 12 10 5 58 51 86 106 19
N. Dak. - 2 - - 2 2 - - 3 5 80
S. Dak. 2 2 - - - - 1 - 14 7 66
Nebr. 12 10 1 1 - 1 4 1 5 12 3
Kans. 3 3 2 3 5 3 8 23 18 39 63
S. ATLANTIC 73 56 267 218 138 123 1,418 1,737 1,063 1,656 1,116
Del. 8 7 5 45 1 2 15 15 - 17 17
Md. 14 11 184 140 44 42 355 486 146 149 275
D.C. 4 3 4 7 10 9 39 66 61 52 -
Va. 7 11 25 4 23 32 89 145 144 165 343
W. Va. N N 6 1 - - 2 3 24 29 46
N.C. 6 6 13 8 12 7 386 364 217 196 136
S.C. 5 2 3 1 4 9 162 212 171 191 81
Ga. 2 - 2 1 15 14 249 288 230 298 106
Fla. 26 16 25 11 29 8 121 158 70 559 112
E.S. CENTRAL 25 28 35 41 14 16 576 947 282 653 133
Ky. 14 7 8 6 2 4 62 80 - 96 20
Tenn. 8 14 17 17 8 4 296 395 120 240 81
Ala. 3 2 10 4 4 5 139 242 162 209 32
Miss. U 5 U 14 U 3 79 230 U 108 U
W.S. CENTRAL 16 7 10 28 17 9 422 655 54 1,317 107
Ark. - 1 5 8 1 2 59 96 54 107 21
La. 1 2 - 1 4 4 155 204 - 102 -
Okla. 6 1 - 5 2 3 26 59 U 117 86
Tex. 9 3 5 14 10 - 182 296 U 991 -
MOUNTAIN 32 29 5 6 27 37 114 86 226 285 84
Mont. 1 1 - - - 2 - - 12 6 29
Idaho - 2 1 2 3 - - - 8 7 -
Wyo. 1 1 - 1 - 2 1 - 2 2 42
Colo. 6 9 2 - 7 18 8 4 U 49 1
N. Mex. 2 1 1 - 11 5 12 4 28 22 2
Ariz. 5 7 - 1 5 4 88 68 114 142 7
Utah 16 5 - - 1 2 3 3 33 11 3
Nev. 1 3 1 2 - 4 2 7 29 46 -
PACIFIC 44 27 62 55 120 221 160 213 2,837 1,961 207
Wash. 5 6 2 2 9 8 12 7 120 152 -
Oreg. - - 8 10 11 10 2 4 60 89 1
Calif. 38 20 51 43 99 196 146 200 2,548 1,577 186
Alaska - - 1 - - 3 - 1 26 46 20
Hawaii 1 1 - - 1 4 - 1 83 97 -
Guam - - - - - - - 3 - 13 -
P.R. - - - - - 3 116 124 46 88 28
V.I. U U U U U U U U U U U
Amer. Samoa U U U U U U U U U U U
C.N.M.I. - - - - - - 98 9 54 2 -
-------------------------------------------------------------------------------------------------------------------------------------------
N: Not notifiable U: Unavailable -: no reported cases
* Additional information about areas displaying 'U' for cumulative Tuberculosis cases can be found in Notices to Readers, MMWR Vol. 47, No. 2, p. 39.
=======================================================================================================================================================
Return to top. Table_III Note: To print large tables and graphs users may have to change their printer settings to landscape and use a small font size.
TABLE III. (page 1) Provisional cases of selected notifiable diseases preventable by vaccination, United
States, weeks ending July 11, 1998, and July 5, 1997 (27th Week)
Hepatitis (Viral), by type Measles (Rubeola)
H. influenzae, --------------------------------------- ------------------------------------------------------------
invasive A B Indigenous Imported** Total
---------------- ----------------- ----------------- --------------- --------------- ---------------
Cum. Cum. Cum. Cum. Cum. Cum. Cum. Cum. Cum. Cum.
Reporting Area 1998* 1997 1998 1997 1998 1997 1998 1998 1998 1998 1998 1997
-----------------------------------------------------------------------------------------------------------------------------------------------------
UNITED STATES 585 643 11,327 14,306 4,103 4,754 - 26 - 13 39 78
NEW ENGLAND 33 36 145 339 69 87 - 1 - 1 2 11
Maine 2 3 13 42 2 6 - - - - - -
N.H. 5 5 8 18 10 5 - - - - - 1
Vt. 2 3 13 7 1 5 - - - - - -
Mass. 22 22 44 158 17 38 - 1 - 1 2 9
R.I. 2 2 9 47 39 9 - - - - - -
Conn. - 1 58 67 - 24 - - - - - 1
MID. ATLANTIC 82 88 728 1,180 589 683 - 9 - 2 11 20
Upstate N.Y. 34 23 175 164 165 128 - 2 - - 2 5
N.Y. City 15 23 188 528 143 269 - - - - - 7
N.J. 28 28 161 181 105 131 - 7 - 1 8 3
Pa. 5 14 204 307 176 155 - - - 1 1 5
E.N. CENTRAL 93 108 1,433 1,527 409 800 - 11 - 3 14 8
Ohio 35 59 184 204 42 44 - - - 1 1 -
Ind. 25 10 93 149 39 60 - 2 - 1 3 -
Ill. 29 25 246 392 81 151 - - - - - 6
Mich. - 14 808 669 231 239 - 9 - 1 10 2
Wis. 4 - 102 113 16 306 - - - - - -
W.N. CENTRAL 51 30 906 1,060 221 269 - - - - - 11
Minn. 37 21 71 90 18 23 - - - - - 2
Iowa 1 3 374 176 33 21 - - - - - -
Mo. 8 3 365 570 138 196 - - - - - 1
N. Dak. - - 3 9 4 2 - - - - - -
S. Dak. - 2 17 14 1 - - - - - - 8
Nebr. - 1 15 43 7 8 - - - - - -
Kans. 5 - 61 158 20 19 - - - - - -
S. ATLANTIC 123 102 978 776 600 555 - 2 - 5 7 3
Del. - - 2 16 - 3 - - - 1 1 -
Md. 40 43 179 119 92 85 - - - 1 1 1
D.C. - - 30 14 6 21 - - - - - 1
Va. 12 7 135 100 54 65 - - - 2 2 -
W. Va. 4 3 1 6 3 9 - - - - - -
N.C. 15 17 51 106 113 123 - - - - - 1
S.C. 4 3 17 67 13 60 - - - - - -
Ga. 24 20 264 189 96 57 - - - 1 1 -
Fla. 24 9 299 159 223 132 - 2 - - 2 -
E.S. CENTRAL 34 37 194 351 202 363 - - - - - 1
Ky. 4 4 13 45 22 23 - - - - - -
Tenn. 23 23 133 214 147 243 - - - - - -
Ala. 7 8 48 53 33 38 - - - - - 1
Miss. U 2 U 39 U 59 U U U U U -
W.S. CENTRAL 31 29 2,126 2,941 669 580 - - - - - 4
Ark. - 2 49 127 46 45 - - - - - -
La. 14 6 41 113 47 67 - - - - - -
Okla. 15 19 307 873 41 18 - - - - - -
Tex. 2 2 1,729 1,828 535 450 - - - - - 4
MOUNTAIN 68 65 1,799 2,125 449 458 - - - - - 7
Mont. - - 59 51 3 5 - - - - - -
Idaho - 1 148 78 18 15 - - - - - -
Wyo. 1 1 23 20 2 14 - - - - - -
Colo. 14 10 136 238 54 88 - - - - - -
N. Mex. 5 6 87 166 189 151 - - - - - -
Ariz. 38 23 1,158 1,006 119 100 - - - - - 5
Utah 4 3 119 347 39 54 - - - - - -
Nev. 6 21 69 219 25 31 U - U - - 2
PACIFIC 70 148 3,018 4,007 895 959 - 3 - 2 5 13
Wash. 4 2 573 285 64 41 - - - 1 1 -
Oreg. 30 24 211 201 59 59 - - - - - -
Calif. 28 116 2,197 3,421 761 840 - 3 - 1 4 10
Alaska 1 1 14 23 6 11 - - - - - -
Hawaii 7 5 23 77 5 8 - - - - - 3
Guam - - - - - 3 U - U - - -
P.R. 2 - 24 183 247 403 - - - - - -
V.I. U U U U U U U U U U U U
Amer. Samoa U U U U U U U U U U U U
C.N.M.I. - 6 1 1 28 28 U - U - - 1
-----------------------------------------------------------------------------------------------------------------------------------------------------
N: Not notifiable U: Unavailable -: no reported cases
* Of 135 cases among children aged <5 years, serotype was reported for 74 and of those, 32 were type b.
** For imported measles, cases include only those resulting from importation from other countries.
=======================================================================================================================================================
TABLE III. (page 2) Provisional cases of selected notifiable diseases preventable by vaccination, United
States, weeks ending July 11, 1998, and July 5, 1997 (27th Week)
Meningococcal
Disease Mumps Pertussis Rubella
----------------- -------------------------- --------------------------- ---------------------------
Cum. Cum. Cum. Cum. Cum. Cum. Cum. Cum.
Reporting Area 1998 1997 1998 1998 1997 1998 1998 1997 1998 1998 1997
------------------------------------------------------------------------------------------------------------------------------------------
UNITED STATES 1,584 2,057 7 251 361 92 2,252 2,720 9 274 91
NEW ENGLAND 69 127 - 1 7 10 393 560 - 35 1
Maine 4 12 - - - - 5 6 - - -
N.H. 4 12 - - - 5 39 65 - - -
Vt. 1 2 - - - 2 38 174 - - -
Mass. 34 66 - 1 2 2 292 292 - 6 1
R.I. 3 9 - - 4 - 3 12 - - -
Conn. 23 26 - - 1 1 16 11 - 29 -
MID. ATLANTIC 146 210 - 16 43 4 284 217 2 113 27
Upstate N.Y. 37 58 - 3 9 4 144 78 2 106 5
N.Y. City 16 37 - 4 3 - 6 52 - 2 22
N.J. 40 42 - 1 7 - 5 11 - 4 -
Pa. 53 73 - 8 24 - 129 76 - 1 -
E.N. CENTRAL 236 307 - 43 41 9 205 259 - - 5
Ohio 86 110 - 19 16 1 73 77 - - -
Ind. 41 33 - 5 4 5 66 30 - - -
Ill. 58 90 - 2 8 1 15 34 - - 1
Mich. 27 46 - 17 11 2 34 31 - - -
Wis. 24 28 - - 2 - 17 87 - - 4
W.N. CENTRAL 130 151 - 20 12 19 188 157 - 25 -
Minn. 24 24 - 10 5 15 115 101 - - -
Iowa 20 34 - 6 6 1 40 8 - - -
Mo. 50 69 - 3 - 2 15 25 - 2 -
N. Dak. 2 1 - 1 - - - 1 - - -
S. Dak. 6 4 - - - 1 5 3 - - -
Nebr. 4 5 - - 1 - 5 4 - - -
Kans. 24 14 - - - - 8 15 - 23 -
S. ATLANTIC 285 345 1 35 41 8 135 234 1 8 29
Del. 1 5 - - - 1 2 - - - -
Md. 23 35 - - 1 - 26 80 - - -
D.C. - 5 - - - - 1 2 - - -
Va. 23 34 - 5 6 - 6 25 - - 1
W. Va. 9 14 - - - - 1 4 - - -
N.C. 40 64 1 9 7 4 48 68 - 5 22
S.C. 41 38 - 4 10 - 15 11 - - 6
Ga. 62 63 - 1 5 - 6 6 - - -
Fla. 86 87 - 16 12 3 30 38 1 3 -
E.S. CENTRAL 112 149 - 1 19 3 54 52 - - 1
Ky. 17 38 - - 3 - 20 13 - - -
Tenn. 43 49 - 1 3 - 18 20 - - -
Ala. 52 45 - - 6 3 16 13 - - 1
Miss. U 17 U U 7 U U 6 U U -
W.S. CENTRAL 186 192 4 38 43 17 161 96 6 75 3
Ark. 23 25 - - - 6 24 7 - - -
La. 38 38 3 8 11 - 1 11 - - -
Okla. 29 23 - - - - 13 13 - - -
Tex. 96 106 1 30 32 11 123 65 6 75 3
MOUNTAIN 90 120 1 23 46 19 506 698 - 5 5
Mont. 3 7 - - - 1 2 8 - - -
Idaho 4 8 - 3 2 5 194 435 - - 1
Wyo. 4 1 - 1 1 - 7 5 - - -
Colo. 19 31 1 5 3 1 99 184 - - -
N. Mex. 16 19 N N N 2 66 33 - 1 -
Ariz. 31 30 - 5 29 8 99 19 - 1 4
Utah 10 11 - 3 6 2 27 4 - 2 -
Nev. 3 13 U 6 5 U 12 10 U 1 -
PACIFIC 330 456 1 74 109 3 326 447 - 13 20
Wash. 41 54 - 5 12 - 148 192 - 9 5
Oreg. 56 91 N N N 3 23 22 - - -
Calif. 228 308 1 54 80 - 149 217 - 2 8
Alaska 1 1 - 2 5 - 2 3 - - -
Hawaii 4 2 - 13 12 - 4 13 - 2 7
Guam - 1 U - 1 U - - U - -
P.R. 5 8 - 1 4 - 2 - - - -
V.I. U U U U U U U U U U U
Amer. Samoa U U U U U U U U U U U
C.N.M.I. - - U 2 4 U 1 - U - -
------------------------------------------------------------------------------------------------------------------------------------------
N: Not notifiable U: Unavailable -: no reported cases
=======================================================================================================================================================
Return to top. Table_IV Note: To print large tables and graphs users may have to change their printer settings to landscape and use a small font size.
TABLE IV. Deaths in 122 U.S. cities,* week ending
July 11, 1998 (27th Week)
===================================================================================================================================
All Causes, By Age (Years)
------------------------------------------------------------------------ P&I**
Reporting Area All Ages >=65 45-64 25-44 1-24 <1 Total
---------------------------------------------------------------------------------------------------------------
NEW ENGLAND 570 410 95 37 14 14 34
Boston, Mass. 157 97 30 16 8 6 12
Bridgeport, Conn. 34 31 - 2 1 - 4
Cambridge, Mass. 24 17 5 1 - 1 2
Fall River, Mass. 12 8 4 - - - -
Hartford, Conn. 63 40 10 5 4 4 3
Lowell, Mass. 26 23 3 - - - -
Lynn, Mass. 13 9 3 1 - - -
New Bedford, Mass. 27 24 3 - - - 1
New Haven, Conn. 39 25 9 5 - - 1
Providence, R.I. 57 42 12 1 1 1 1
Somerville, Mass. 2 1 1 - - - -
Springfield, Mass. 30 26 2 2 - - 2
Waterbury, Conn. 26 22 3 1 - - 2
Worcester, Mass. 60 45 10 3 - 2 6
MID. ATLANTIC 2,256 1,560 454 171 43 27 106
Albany, N.Y. 44 28 8 2 4 2 -
Allentown, Pa. 19 17 1 1 - - 2
Buffalo, N.Y. 89 72 11 5 - - 9
Camden, N.J. 36 23 7 3 2 1 2
Elizabeth, N.J. 35 26 7 2 - - -
Erie, Pa. 50 35 11 3 1 - -
Jersey City, N.J. 51 34 12 3 2 - -
New York City, N.Y. 993 680 206 81 17 9 29
Newark, N.J. 46 19 16 10 - 1 5
Paterson, N.J. 27 18 5 2 - 2 -
Philadelphia, Pa. 399 262 84 34 12 7 23
Pittsburgh, Pa.*** 105 62 25 12 3 3 10
Reading, Pa. 36 27 7 1 1 - 1
Rochester, N.Y. 154 124 26 4 - - 9
Schenectady, N.Y. 15 12 3 - - - 1
Scranton, Pa. 22 20 2 - - - 1
Syracuse, N.Y. 81 63 14 4 - - 10
Trenton, N.J. 37 24 6 4 1 2 -
Utica, N.Y. 17 14 3 - - - 4
Yonkers, N.Y. U U U U U U U
E.N. CENTRAL 2,076 1,372 418 179 50 55 103
Akron, Ohio 51 33 11 3 1 3 -
Canton, Ohio 35 25 8 2 - - 3
Chicago, Ill. 386 241 86 38 11 8 28
Cincinnati, Ohio 106 81 12 8 1 4 11
Cleveland, Ohio 151 98 27 16 9 1 1
Columbus, Ohio 185 120 37 20 3 5 19
Dayton, Ohio 135 91 32 8 2 2 6
Detroit, Mich. 213 113 50 36 6 8 6
Evansville, Ind. 57 39 11 3 - 4 3
Fort Wayne, Ind. 53 30 14 7 1 1 2
Gary, Ind. 8 7 - 1 - - -
Grand Rapids, Mich. 51 34 11 3 1 2 2
Indianapolis, Ind. 220 140 45 18 4 13 -
Lansing, Mich. 57 42 13 2 - - 2
Milwaukee, Wis. 125 86 27 6 4 2 7
Peoria, Ill. 30 26 2 - 2 - 3
Rockford, Ill. 41 30 6 3 1 1 3
South Bend, Ind. 51 38 9 1 3 - 1
Toledo, Ohio 77 63 10 2 1 1 2
Youngstown, Ohio 44 35 7 2 - - 4
W.N. CENTRAL 674 484 106 44 13 19 36
Des Moines, Iowa U U U U U U U
Duluth, Minn. 35 26 6 2 - 1 2
Kansas City, Kans. 20 18 1 1 - - -
Kansas City, Mo. 84 53 13 7 1 2 3
Lincoln, Nebr. 38 31 4 3 - - 2
Minneapolis, Minn. 214 156 37 12 4 5 14
Omaha, Nebr. 55 42 10 - - 3 4
St. Louis, Mo. 95 62 17 8 4 4 6
St. Paul, Minn. 68 48 10 4 2 4 3
Wichita, Kans. 65 48 8 7 2 - 2
S. ATLANTIC 959 614 189 109 28 18 47
Atlanta, Ga. U U U U U U U
Baltimore, Md. 164 100 42 17 3 1 13
Charlotte, N.C. 71 46 13 9 1 2 4
Jacksonville, Fla. 150 103 30 11 4 2 5
Miami, Fla. 107 68 21 13 2 3 -
Norfolk, Va. 33 19 5 4 2 3 -
Richmond, Va. 61 40 8 9 1 3 1
Savannah, Ga. 53 36 8 6 2 1 4
St. Petersburg, Fla. 58 46 6 3 2 1 7
Tampa, Fla. 140 93 25 18 3 1 11
Washington, D.C. 101 54 27 11 8 1 2
Wilmington, Del. 21 9 4 8 - - -
E.S. CENTRAL 770 527 146 56 23 15 44
Birmingham, Ala. 147 98 27 15 3 1 7
Chattanooga, Tenn. 73 53 12 5 3 - 6
Knoxville, Tenn. 60 42 11 4 3 - 7
Lexington, Ky. 77 56 11 4 - 6 3
Memphis, Tenn. 201 132 44 13 7 5 16
Mobile, Ala. 40 27 6 4 1 2 -
Montgomery, Ala. 38 29 9 - - - 2
Nashville, Tenn. 134 90 26 11 6 1 3
W.S. CENTRAL 1,457 941 313 125 40 38 79
Austin, Tex. 76 45 15 12 3 1 6
Baton Rouge, La. 27 10 11 3 3 - -
Corpus Christi, Tex. 53 35 10 6 1 1 2
Dallas, Tex. 234 146 44 27 7 10 8
El Paso, Tex. 53 35 9 6 - 3 1
Ft. Worth, Tex. 103 76 17 6 1 3 10
Houston, Tex. 359 216 92 26 14 11 27
Little Rock, Ark. 66 43 12 5 2 4 2
New Orleans, La. 109 66 24 13 5 1 -
San Antonio, Tex. 237 170 54 13 - - 16
Shreveport, La. U U U U U U U
Tulsa, Okla. 140 99 25 8 4 4 7
MOUNTAIN 926 632 184 65 21 24 56
Albuquerque, N.M. 128 93 29 4 1 1 5
Boise, Idaho 40 26 12 - 1 1 3
Colo. Springs, Colo. 39 27 4 4 1 3 1
Denver, Colo. 97 63 18 9 3 4 8
Las Vegas, Nev. 148 101 28 12 4 3 5
Ogden, Utah 41 32 4 3 1 1 4
Phoenix, Ariz. 165 97 37 17 5 9 8
Pueblo, Colo. 30 21 8 - 1 - -
Salt Lake City, Utah 93 65 14 11 1 2 13
Tucson, Ariz. 145 107 30 5 3 - 9
PACIFIC 1,955 1,446 302 135 30 42 157
Berkeley, Calif. 19 16 3 - - - 2
Fresno, Calif. 78 53 15 7 1 2 6
Glendale, Calif. 38 23 11 2 1 1 -
Honolulu, Hawaii 75 59 13 1 1 1 7
Long Beach, Calif. 71 44 13 11 2 1 4
Los Angeles, Calif. 700 579 49 49 10 13 31
Pasadena, Calif. 28 21 6 - - 1 3
Portland, Oreg. 53 38 10 3 1 1 3
Sacramento, Calif. 152 105 31 13 3 - 27
San Diego, Calif. 172 110 38 11 5 8 19
San Francisco, Calif. 109 78 20 8 - 3 12
San Jose, Calif. 150 106 29 11 - 4 19
Santa Cruz, Calif. 24 16 6 2 - - 3
Seattle, Wash. 123 81 26 10 2 4 5
Spokane, Wash. 62 47 10 3 2 - 11
Tacoma, Wash. 101 70 22 4 2 3 5
TOTAL 11,643**** 7,986 2,207 921 262 252 662
---------------------------------------------------------------------------------------------------------------
U: Unavailable -: no reported cases
* Mortality data in this table are voluntarily reported from 122 cities in the United States, most of which have populations
of 100,000 or more. A death is reported by the place of its occurrence and by the week that the death certificate was
filed. Fetal deaths are not included.
** Pneumonia and influenza.
*** Because of changes in reporting methods in this Pennsylvania city, these numbers are partial counts for the current
week. Complete counts will be available in 4 to 6 weeks.
**** Total includes unknown ages.
===================================================================================================================================
Return to top. Disclaimer All MMWR HTML versions of articles are electronic conversions from ASCII text into HTML. This conversion may have resulted in character translation or format errors in the HTML version. Users should not rely on this HTML document, but are referred to the electronic PDF version and/or the original MMWR paper copy for the official text, figures, and tables. An original paper copy of this issue can be obtained from the Superintendent of Documents, U.S. Government Printing Office (GPO), Washington, DC 20402-9371; telephone: (202) 512-1800. Contact GPO for current prices. **Questions or messages regarding errors in formatting should be addressed to mmwrq@cdc.gov.Page converted: 10/05/98 |
|||||||||
This page last reviewed 5/2/01
|