 |
|
|
|
|
|
|
| ||||||||||
|
|
|
|
|
|
|
||||
| ||||||||||
|
|
|
|
|
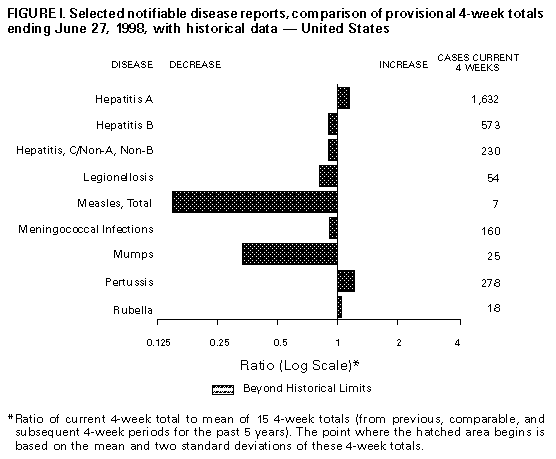
Persons using assistive technology might not be able to fully access information in this file. For assistance, please send e-mail to: mmwrq@cdc.gov. Type 508 Accommodation and the title of the report in the subject line of e-mail. Notifiable Diseases/Deaths in Selected Cities Weekly InformationFigure_I Selected notifiable disease reports, comparison of provisional 4-week totals ending June 27, 1998, with historical data -- United States Table_I Summary -- provisional cases of selected notifiable diseases, United States, cumulative, week ending June 27, 1998 (25th Week) Table_II Provisional cases of selected notifiable diseases, United States, weeks ending June 27, 1998 and June 21, 1997 (25th Week) Table_III Provisional cases of selected notifiable diseases preventable by vaccination, United States, weeks ending June 27, 1998 and June 21, 1997 (25th Week) Table_IV Deaths in 122 U.S. cities, week ending
June 27, 1998 (25th Week)
TABLE I. Summary -- provisional cases of specified notifiable diseases, United
States, cumulative, week ending June 27, 1998 (25th Week)
==================================================================================
                                             Cum. 1998
------------------------------------------------------
Anthrax                                              -
Brucellosis                                         34
Cholera                                              4
Congenital rubella syndrome                          3
Cryptosporidiosis*                                 846
Diphtheria                                           1
Encephalitis:  California*                           2
               eastern equine*                       -
               St. Louis*                            -
               western equine*                       -
Hansen Disease                                      58
Hantavirus pulmonary syndrome*+                      4
Hemolytic uremic syndrome, post-diarrheal*          16
HIV infection, pediatric*&                         106
Plague                                               -
Poliomyelitis, paralytic@                            -
Psittacosis                                         21
Rabies, human                                        -
Rocky Mountain spotted fever (RMSF)                 81
Streptococcal disease, invasive Group A          1,148
Streptococcal toxic-shock syndrome*                 33
Syphilis, congenital**                             128
Tetanus                                             12
Toxic-shock syndrome                                65
Trichinosis                                          6
Typhoid fever                                      135
Yellow fever                                         -
------------------------------------------------------
-: no reported cases
 * Not notifiable in all states
 + Updated weekly from reports to the Division of Viral and Rickettsial
   Diseases, National Center for Infectious Diseases (NCID).
 & Updated monthly to the Division of HIV/AIDS Prevention -- Surveillance
   and Epidemiology, National Center for HIV, STD, and TB Prevention
   (NCHSTP), last update May 24, 1998.
 @ One suspected case(s) of polio with onset in 1998 have also been reported
   to date.
** Updated from reports to the Division of STD Prevention, NCHSTP.

==================================================================================
Return to top. Table_II Note: To print large tables and graphs users may have to change their printer settings to landscape and use a small font size.
TABLE II. (page 1) Provisional cases of selected notifiable diseases, United States, weeks ending
June 27, 1998, and June 21, 1997 (25th Week)
Escherichia
coli O157:H7
------------------- Hepatitis
AIDS* Chlamydia NETSS** PHLIS*** Gonorrhea C\NA,NB
----------------- -------------------- -------- -------- ------------------- ----------------
Cum. Cum. Cum. Cum. Cum. Cum. Cum. Cum. Cum. Cum.
Reporting Area 1998 1997 1998 1997 1998 1998 1998 1997 1998 1997
------------------------------------------------------------------------------------------------------------------------------
UNITED STATES 20,034 27,944 244,571 235,320 685 357 143,519 137,638 1,891 1,636
NEW ENGLAND 640 1,151 9,161 8,239 103 69 2,430 2,803 23 33
Maine 13 25 457 452 5 - 30 28 - -
N.H. 21 17 441 370 18 16 45 57 - -
Vt. 10 24 187 188 4 4 13 24 - 1
Mass. 275 462 4,062 3,388 57 38 975 1,050 22 29
R.I. 58 80 1,199 981 3 1 175 231 1 3
Conn. 263 543 2,815 2,860 16 10 1,192 1,413 - -
MID. ATLANTIC 5,695 8,425 29,581 27,575 72 18 16,406 16,698 200 145
Upstate N.Y. 710 1,338 N N 50 - 2,878 2,848 154 107
N.Y. City 3,153 4,138 16,364 14,269 3 6 7,046 6,324 - -
N.J. 993 1,861 4,626 4,742 19 11 2,631 3,457 - -
Pa. 839 1,088 8,591 8,564 N 1 3,851 4,069 46 38
E.N. CENTRAL 1,518 1,977 41,074 34,691 134 67 27,683 20,611 248 320
Ohio 281 408 11,921 10,434 32 12 7,157 6,439 6 7
Ind. 293 359 2,706 4,204 46 20 1,769 2,820 3 9
Ill. 610 608 11,994 6,231 29 - 9,589 3,030 11 52
Mich. 252 473 10,232 8,678 27 17 7,480 6,197 228 234
Wis. 82 129 4,221 5,144 N 18 1,688 2,125 - 18
W.N. CENTRAL 351 536 14,555 15,081 80 46 7,017 6,566 110 33
Minn. 56 99 2,305 3,143 30 24 814 1,091 5 2
Iowa 20 66 2,010 2,222 21 - 638 598 11 16
Mo. 176 254 5,634 5,565 10 17 4,034 3,493 90 4
N. Dak. 4 4 290 408 1 2 29 26 - 2
S. Dak. 9 2 788 595 2 1 125 62 - -
Nebr. 36 48 1,023 931 7 - 346 341 2 2
Kans. 50 63 2,505 2,217 9 2 1,031 955 2 7
S. ATLANTIC 5,037 7,208 52,583 44,769 48 29 42,159 43,145 96 108
Del. 57 111 1,210 612 - 1 649 542 - -
Md. 571 948 4,001 3,446 12 4 4,576 5,570 5 3
D.C. 413 533 N N 1 - 1,656 1,959 - -
Va. 368 599 5,135 5,289 N 7 2,849 3,762 5 10
W. Va. 47 57 1,309 1,427 N 2 371 455 4 9
N.C. 335 364 10,801 7,935 11 10 9,034 7,724 12 28
S.C. 318 371 9,002 5,919 1 - 5,823 5,350 1 25
Ga. 608 859 11,989 7,928 8 - 9,896 9,284 9 -
Fla. 2,320 3,366 9,136 12,213 12 5 7,305 8,499 60 33
E.S. CENTRAL 788 828 17,268 16,319 39 11 16,347 16,170 74 180
Ky. 101 114 2,984 3,149 10 - 1,702 2,015 14 7
Tenn. 272 373 5,945 6,038 20 10 5,051 5,038 57 113
Ala. 233 196 4,679 3,847 9 - 5,906 5,458 3 6
Miss. 182 145 3,660 3,285 U 1 3,688 3,659 U 54
W.S. CENTRAL 2,473 3,120 35,864 22,547 44 5 20,492 16,690 512 191
Ark. 81 119 1,553 1,369 3 1 1,145 2,213 5 5
La. 415 538 6,429 3,941 - 1 5,274 3,711 10 101
Okla. 134 138 4,784 3,496 5 3 2,605 2,232 2 4
Tex. 1,843 2,325 23,098 13,741 36 - 11,468 8,534 495 81
MOUNTAIN 725 841 8,435 13,296 61 43 3,144 3,561 233 151
Mont. 13 22 595 477 4 - 23 20 4 10
Idaho 14 28 917 691 7 1 83 50 87 23
Wyo. 2 13 301 255 2 - 15 25 43 37
Colo. 127 224 - 2,884 19 11 1,083 947 13 21
N. Mex. 111 67 1,830 1,865 9 6 355 418 51 32
Ariz. 286 189 3,735 4,882 N 9 1,373 1,547 3 18
Utah 57 65 748 815 13 10 74 119 19 3
Nev. 115 233 309 1,427 7 6 138 435 13 7
PACIFIC 2,807 3,858 36,050 52,803 104 69 7,841 11,394 395 475
Wash. 203 287 5,286 4,348 25 22 899 927 10 14
Oreg. 88 144 2,682 2,245 29 26 360 329 2 2
Calif. 2,463 3,377 26,201 44,733 48 18 6,232 9,711 328 375
Alaska 12 22 913 668 2 - 155 190 1 -
Hawaii 41 28 968 809 N 3 195 237 54 84
Guam - 2 8 193 N - 2 27 - -
P.R. 834 760 U U - U 187 319 - -
V.I. 17 49 N N N U U U U U
Amer. Samoa - - U U N U U U U U
C.N.M.I. - 1 N N N U 14 16 - 2
------------------------------------------------------------------------------------------------------------------------------
N: Not notifiable U: Unavailable -: no reported cases C.N.M.I.: Commonwealth of North Mariana Islands
* Updated monthly to the Division of HIV/AIDS Prevention, -- Surveillance and Epidemiology, National Center for HIV, STD,
and TB Prevention, last update May 24, 1998.
** National Electronic Telecommunications System for Surveillance.
*** Public Health Laboratory Information System.
=======================================================================================================================================================
TABLE II. (page 2) Provisional cases of selected notifiable diseases, United States, weeks ending
June 27, 1998, and June 21, 1997 (25th Week)
Lyme Syphilis Rabies,
Legionellosis Disease Malaria (Primary & Secondary) Tuberculosis Animal
---------------- ---------------- ---------------- --------------------- ----------------- -------
Cum. Cum. Cum. Cum. Cum. Cum. Cum. Cum. Cum. Cum. Cum.
Reporting Area 1998 1997 1998 1997 1998 1997 1998 1997 1998 * 1997 1998
-------------------------------------------------------------------------------------------------------------------------------------------
UNITED STATES 485 395 2,376 2,154 513 706 3,182 4,157 4,757 8,080 3,274
NEW ENGLAND 24 27 677 458 19 31 37 81 147 209 634
Maine 1 1 1 3 3 1 1 - U 15 101
N.H. 3 4 14 7 3 2 1 - 2 6 33
Vt. 1 4 4 3 - 2 3 - 1 3 30
Mass. 9 8 157 75 11 16 23 39 119 117 214
R.I. 4 5 31 43 2 2 - 1 25 16 35
Conn. 6 5 470 327 - 8 9 41 U 52 221
MID. ATLANTIC 102 69 1,328 1,346 132 210 100 201 1,051 1,430 709
Upstate N.Y. 30 17 767 445 34 34 16 20 140 194 509
N.Y. City 19 3 7 74 65 126 23 38 667 753 U
N.J. 4 12 193 344 19 37 18 87 244 293 86
Pa. 49 37 361 483 14 13 43 56 U 190 114
E.N. CENTRAL 151 145 39 36 46 72 452 352 282 853 48
Ohio 64 63 34 12 3 7 74 110 5 148 35
Ind. 23 25 4 10 2 7 97 75 6 76 4
Ill. 14 5 - 4 15 31 168 36 271 437 2
Mich. 30 31 1 10 25 17 89 59 U 140 6
Wis. 20 21 U U 1 10 24 72 U 52 1
W.N. CENTRAL 37 26 22 26 29 23 71 82 118 238 345
Minn. 3 1 9 14 13 9 3 13 U 64 63
Iowa 4 7 9 1 3 6 - 3 U 27 77
Mo. 14 2 1 9 9 5 55 45 82 92 17
N. Dak. - 2 - - 2 - - - U 5 74
S. Dak. 1 1 - - - - 1 - 13 4 54
Nebr. 12 10 1 1 - 1 4 1 5 8 3
Kans. 3 3 2 1 2 2 8 20 18 38 57
S. ATLANTIC 64 54 220 186 124 117 1,332 1,673 862 1,484 1,030
Del. 7 6 5 39 1 2 15 14 - 17 17
Md. 12 11 147 117 43 41 318 469 137 140 253
D.C. 4 3 4 7 7 7 38 62 55 46 -
Va. 7 11 20 3 21 29 85 134 118 140 330
W. Va. N N 5 1 - - 2 3 24 26 41
N.C. 6 6 12 7 10 7 369 344 200 172 136
S.C. 5 2 1 1 4 9 155 206 142 166 72
Ga. 2 - 2 1 15 14 238 292 186 273 81
Fla. 20 15 24 10 23 8 112 149 U 504 100
E.S. CENTRAL 20 20 23 35 14 16 533 897 160 605 121
Ky. 12 6 6 5 2 4 59 76 U 88 19
Tenn. 5 7 8 12 8 4 265 375 U 221 70
Ala. 3 2 9 4 4 5 130 233 160 197 32
Miss. U 5 U 14 U 3 79 213 U 99 U
W.S. CENTRAL 16 5 10 13 17 8 405 587 53 1,198 104
Ark. - - 5 4 1 2 52 94 53 98 21
La. 1 1 - 1 4 4 150 197 - 85 -
Okla. 6 1 - 2 2 2 24 57 U 104 83
Tex. 9 3 5 6 10 - 179 239 U 911 -
MOUNTAIN 29 26 3 6 24 36 98 81 214 250 80
Mont. 1 1 - - - 2 - - 12 6 29
Idaho - 2 1 - 3 - - - 4 5 -
Wyo. 1 1 - 1 - 2 1 - 2 2 40
Colo. 5 6 1 2 7 17 7 3 U 49 1
N. Mex. 2 1 - - 9 5 12 4 27 19 1
Ariz. 4 7 - 1 4 4 73 65 108 112 7
Utah 15 5 - - 1 2 3 3 32 11 2
Nev. 1 3 1 2 - 4 2 6 29 46 -
PACIFIC 42 23 54 48 108 193 154 203 1,870 1,813 203
Wash. 4 6 1 1 9 8 12 7 117 141 -
Oreg. - - 8 10 10 10 2 4 57 73 -
Calif. 37 16 45 37 88 169 140 190 1,598 1,461 183
Alaska - - - - - 3 - 1 22 44 20
Hawaii 1 1 - - 1 3 - 1 76 94 -
Guam - - - - - - - 3 - 13 -
P.R. - - - - - 3 109 110 46 88 28
V.I. U U U U U U U U U U U
Amer. Samoa U U U U U U U U U U U
C.N.M.I. - - - - - - 98 8 54 - -
-------------------------------------------------------------------------------------------------------------------------------------------
N: Not notifiable U: Unavailable -: no reported cases
* Additional information about areas displaying 'U' for cumulative Tuberculosis cases can be found in Notices to Readers, MMWR Vol. 47, No. 2, p. 39.
=======================================================================================================================================================
Return to top. Table_III Note: To print large tables and graphs users may have to change their printer settings to landscape and use a small font size.
TABLE III. (page 1) Provisional cases of selected notifiable diseases preventable by vaccination, United
States, weeks ending June 27, 1998, and June 21, 1997 (25th Week)
Hepatitis (Viral), by type Measles (Rubeola)
H. influenzae, --------------------------------------- ------------------------------------------------------------
invasive A B Indigenous Imported** Total
---------------- ----------------- ----------------- --------------- --------------- ---------------
Cum. Cum. Cum. Cum. Cum. Cum. Cum. Cum. Cum. Cum.
Reporting Area 1998* 1997 1998 1997 1998 1997 1998 1998 1998 1998 1998 1997
-----------------------------------------------------------------------------------------------------------------------------------------------------
UNITED STATES 539 590 10,456 13,295 3,715 4,438 1 23 - 13 36 73
NEW ENGLAND 33 33 132 305 52 81 - - - 1 1 10
Maine 2 3 13 41 - 5 - - - - - -
N.H. 5 4 7 18 10 5 - - - - - 1
Vt. 2 2 11 7 1 3 - - - - - -
Mass. 22 21 41 150 16 37 - - - 1 1 8
R.I. 2 2 9 26 25 8 - - - - - -
Conn. - 1 51 63 - 23 - - - - - 1
MID. ATLANTIC 76 84 650 1,142 527 656 - 9 - 2 11 16
Upstate N.Y. 31 18 155 146 148 124 - 2 - - 2 4
N.Y. City 13 23 185 497 143 257 - - - - - 5
N.J. 28 27 140 169 90 126 U 7 U 1 8 2
Pa. 4 16 170 330 146 149 U - U 1 1 5
E.N. CENTRAL 83 88 1,319 1,420 368 743 - 9 - 3 12 8
Ohio 34 45 172 194 35 41 - - - 1 1 -
Ind. 22 8 89 144 36 53 - 2 - 1 3 -
Ill. 23 24 218 356 66 144 - - - - - 6
Mich. - 11 745 619 215 229 - 7 - 1 8 2
Wis. 4 - 95 107 16 276 - - - - - -
W.N. CENTRAL 39 28 857 982 171 263 - - - - - 11
Minn. 25 19 60 90 16 23 - - - - - 2
Iowa 1 3 373 143 30 20 - - - - - -
Mo. 8 3 346 537 98 192 - - - - - 1
N. Dak. - - 3 9 4 3 - - - - - -
S. Dak. - 2 8 14 1 - - - - - - 8
Nebr. - 1 15 41 7 8 - - - - - -
Kans. 5 - 52 148 15 17 U - U - - -
S. ATLANTIC 115 98 910 677 542 524 1 2 - 5 7 3
Del. - - 2 14 - 3 - - - 1 1 -
Md. 35 40 169 112 80 78 - - - 1 1 1
D.C. - - 30 14 6 21 - - - - - 1
Va. 12 7 127 92 53 60 - - - 2 2 -
W. Va. 4 3 1 6 3 9 - - - - - -
N.C. 15 16 49 103 104 108 - - - - - 1
S.C. 4 3 16 64 3 59 - - - - - -
Ga. 24 20 241 128 86 57 - - - 1 1 -
Fla. 21 9 275 144 207 129 1 2 - - 2 -
E.S. CENTRAL 31 36 173 335 187 347 - - - - - 1
Ky. 4 4 12 42 22 21 - - - - - -
Tenn. 20 22 117 205 134 229 - - - - - -
Ala. 7 8 44 49 31 38 - - - - - 1
Miss. U 2 U 39 U 59 U U U U U -
W.S. CENTRAL 30 28 2,040 2,658 631 521 - - - - - 4
Ark. - 2 43 123 46 40 - - - - - -
La. 13 6 40 108 47 63 - - - - - -
Okla. 15 18 282 823 31 18 - - - - - -
Tex. 2 2 1,675 1,604 507 400 - - - - - 4
MOUNTAIN 66 64 1,658 1,960 419 422 - - - - - 7
Mont. - - 51 50 3 5 - - - - - -
Idaho - 1 136 76 18 14 - - - - - -
Wyo. - 1 23 20 2 14 - - - - - -
Colo. 14 9 128 224 52 83 - - - - - -
N. Mex. 5 6 83 152 167 145 - - - - - -
Ariz. 37 23 1,052 906 114 84 - - - - - 5
Utah 4 3 116 337 38 49 - - - - - -
Nev. 6 21 69 195 25 28 U - U - - 2
PACIFIC 66 131 2,717 3,816 818 881 - 3 - 2 5 13
Wash. 3 2 570 261 63 34 - - - 1 1 -
Oreg. 29 22 205 192 57 55 - - - - - -
Calif. 28 101 1,907 3,268 687 775 - 3 - 1 4 10
Alaska 1 1 12 22 6 11 - - - - - -
Hawaii 5 5 23 73 5 6 U - U - - 3
Guam - - - - - 3 U - U - - -
P.R. 2 - 23 176 245 332 - - - - - -
V.I. U U U U U U U U U U U U
Amer. Samoa U U U U U U U U U U U U
C.N.M.I. - 5 1 1 28 26 U - U - - 1
-----------------------------------------------------------------------------------------------------------------------------------------------------
N: Not notifiable U: Unavailable -: no reported cases
* Of 131 cases among children aged <5 years, serotype was reported for 73 and of those, 31 were type b.
** For imported measles, cases include only those resulting from importation from other countries.
=======================================================================================================================================================
TABLE III. (page 2) Provisional cases of selected notifiable diseases preventable by vaccination, United
States, weeks ending June 27, 1998, and June 21, 1997 (25th Week)
Meningococcal
Disease Mumps Pertussis Rubella
----------------- -------------------------- --------------------------- ---------------------------
Cum. Cum. Cum. Cum. Cum. Cum. Cum. Cum.
Reporting Area 1998 1997 1998 1998 1997 1998 1998 1997 1998 1998 1997
------------------------------------------------------------------------------------------------------------------------------------------
UNITED STATES 1,472 1,977 3 229 339 78 2,050 2,537 5 253 64
NEW ENGLAND 68 116 - - 7 15 358 534 - 33 -
Maine 4 11 - - - - 5 6 - - -
N.H. 4 12 - - - 6 34 61 - - -
Vt. 1 2 - - - 3 34 166 - - -
Mass. 33 62 - - 2 6 269 279 - 6 -
R.I. 3 8 - - 4 - 3 12 - - -
Conn. 23 21 - - 1 - 13 10 - 27 -
MID. ATLANTIC 139 214 - 15 37 10 259 203 1 112 19
Upstate N.Y. 36 57 - 3 8 10 130 76 1 105 4
N.Y. City 15 34 - 4 1 - 4 46 - 2 15
N.J. 37 41 U 1 6 U 5 11 U 4 -
Pa. 51 82 U 7 22 U 120 70 U 1 -
E.N. CENTRAL 221 288 - 40 37 4 187 248 - - 3
Ohio 83 104 - 19 14 - 71 72 - - -
Ind. 41 33 - 4 4 4 53 29 - - -
Ill. 47 85 - 1 8 - 14 34 - - -
Mich. 26 38 - 16 10 - 32 31 - - -
Wis. 24 28 - - 1 - 17 82 - - 3
W.N. CENTRAL 118 145 - 20 11 14 168 139 - 13 -
Minn. 19 24 - 10 4 14 100 87 - - -
Iowa 18 31 - 6 6 - 39 8 - - -
Mo. 48 66 - 3 - - 12 22 - 2 -
N. Dak. - 1 - 1 - - - 1 - - -
S. Dak. 6 4 - - - - 4 3 - - -
Nebr. 4 5 - - 1 - 5 3 - - -
Kans. 23 14 U - - U 8 15 U 11 -
S. ATLANTIC 254 328 1 33 41 5 126 207 3 9 17
Del. 1 4 - - - - 1 - - - -
Md. 22 34 - - 1 - 25 77 - - -
D.C. - 5 - - - - 1 2 - - -
Va. 23 34 - 4 6 - 6 25 - - 1
W. Va. 7 13 - - - - 1 4 - - -
N.C. 36 59 1 8 7 2 44 46 2 5 10
S.C. 37 38 - 4 10 1 14 11 - - 6
Ga. 58 61 - 1 5 1 6 6 1 1 -
Fla. 70 80 - 16 12 1 28 36 - 3 -
E.S. CENTRAL 103 143 - 1 19 - 48 48 - - 1
Ky. 16 38 - - 3 - 18 12 - - -
Tenn. 40 44 - 1 3 - 17 18 - - -
Ala. 47 44 - - 6 - 13 12 - - 1
Miss. U 17 U U 7 U U 6 U U -
W.S. CENTRAL 179 192 - 31 41 6 135 72 1 68 3
Ark. 22 25 - - - 1 18 2 - - -
La. 35 38 - 2 11 - 1 11 - - -
Okla. 26 23 - - - - 13 9 - - -
Tex. 96 106 - 29 30 5 103 50 1 68 3
MOUNTAIN 85 118 - 21 46 19 456 678 - 5 4
Mont. 3 7 - - - - 1 7 - - -
Idaho 4 8 - 3 2 11 188 432 - - 1
Wyo. 3 1 - 1 1 - 7 4 - - -
Colo. 19 33 - 4 3 7 93 174 - - -
N. Mex. 15 19 N N N - 64 32 - 1 -
Ariz. 29 27 - 4 29 - 68 15 - 1 3
Utah 9 11 - 3 6 1 23 4 - 2 -
Nev. 3 12 U 6 5 U 12 10 U 1 -
PACIFIC 305 433 2 68 100 5 313 408 - 13 17
Wash. 41 51 - 5 12 3 139 179 - 9 3
Oreg. 56 89 N N N 2 19 23 - - -
Calif. 203 290 2 48 71 - 149 193 - 2 7
Alaska 1 1 - 2 5 - 2 2 - - -
Hawaii 4 2 U 13 12 U 4 11 U 2 7
Guam - 1 U - 1 U - - U - -
P.R. 4 8 - 1 4 - 2 - - - -
V.I. U U U U U U U U U U U
Amer. Samoa U U U U U U U U U U U
C.N.M.I. - - U 2 4 U 1 - U - -
------------------------------------------------------------------------------------------------------------------------------------------
N: Not notifiable U: Unavailable -: no reported cases
=======================================================================================================================================================
Return to top. Table_IV Note: To print large tables and graphs users may have to change their printer settings to landscape and use a small font size.
TABLE IV. Deaths in 122 U.S. cities,* week ending
June 27, 1998 (25th Week)
===================================================================================================================================
All Causes, By Age (Years)
------------------------------------------------------------------------ P&I**
Reporting Area All Ages >=65 45-64 25-44 1-24 <1 Total
---------------------------------------------------------------------------------------------------------------
NEW ENGLAND 328 237 56 21 6 8 16
Boston, Mass. U U U U U U U
Bridgeport, Conn. 27 21 3 2 1 - 1
Cambridge, Mass. 15 13 1 1 - - 2
Fall River, Mass. 22 16 4 2 - - -
Hartford, Conn. U U U U U U U
Lowell, Mass. 28 18 7 3 - - 2
Lynn, Mass. 9 8 1 - - - -
New Bedford, Mass. 25 19 4 2 - - 1
New Haven, Conn. 42 32 7 1 - 2 2
Providence, R.I. 47 35 4 2 3 3 -
Somerville, Mass. 5 4 1 - - - -
Springfield, Mass. 27 17 6 2 1 1 -
Waterbury, Conn. 32 20 9 3 - - -
Worcester, Mass. 49 34 9 3 1 2 8
MID. ATLANTIC 2,134 1,431 458 168 46 30 100
Albany, N.Y. 46 28 8 9 - 1 3
Allentown, Pa. U U U U U U U
Buffalo, N.Y. 74 60 12 1 1 - 9
Camden, N.J. 29 13 8 5 - 3 1
Elizabeth, N.J. 22 9 10 1 1 1 -
Erie, Pa. 40 32 6 2 - - -
Jersey City, N.J. 31 19 8 2 1 1 -
New York City, N.Y. 1,156 770 252 102 21 11 46
Newark, N.J. U U U U U U U
Paterson, N.J. 19 10 5 1 2 - -
Philadelphia, Pa. 300 183 75 21 12 9 13
Pittsburgh, Pa.*** 44 27 11 4 2 - 3
Reading, Pa. 30 25 3 1 1 - 3
Rochester, N.Y. 124 89 26 5 2 2 9
Schenectady, N.Y. 24 19 4 1 - - 2
Scranton, Pa. 28 23 4 1 - - 2
Syracuse, N.Y. 59 48 5 2 2 2 6
Trenton, N.J. 61 43 14 4 - - 2
Utica, N.Y. 24 15 5 3 1 - -
Yonkers, N.Y. 23 18 2 3 - - 1
E.N. CENTRAL 1,960 1,320 389 152 60 38 92
Akron, Ohio 44 31 7 5 1 - -
Canton, Ohio 28 20 5 2 1 - 2
Chicago, Ill. 386 234 82 39 17 13 21
Cincinnati, Ohio 107 82 16 5 - 4 13
Cleveland, Ohio 150 104 28 6 3 9 3
Columbus, Ohio 156 103 33 11 8 1 10
Dayton, Ohio 108 74 22 10 1 1 5
Detroit, Mich. 224 122 59 30 11 2 9
Evansville, Ind. 52 39 6 6 - 1 1
Fort Wayne, Ind. 47 39 5 2 1 - 1
Gary, Ind. 14 10 3 1 - - -
Grand Rapids, Mich. 49 36 9 3 - 1 9
Indianapolis, Ind. 155 100 38 9 4 4 -
Lansing, Mich. 32 24 4 1 3 - 1
Milwaukee, Wis. 119 87 24 5 3 - 3
Peoria, Ill. 51 41 8 1 1 - 4
Rockford, Ill. 47 33 10 4 - - 3
South Bend, Ind. 63 48 8 3 3 1 1
Toledo, Ohio 83 60 17 3 3 - 5
Youngstown, Ohio 45 33 5 6 - 1 1
W.N. CENTRAL 754 545 121 35 21 17 43
Des Moines, Iowa 158 111 26 13 6 2 11
Duluth, Minn. 24 17 5 1 1 - 2
Kansas City, Kans. U U U U U U U
Kansas City, Mo. 94 58 16 1 2 2 6
Lincoln, Nebr. 32 27 4 1 - - 2
Minneapolis, Minn. 161 130 19 3 5 4 11
Omaha, Nebr. 71 52 9 4 5 1 2
St. Louis, Mo. 120 74 29 8 1 8 -
St. Paul, Minn. 94 76 13 4 1 - 9
Wichita, Kans. U U U U U U U
S. ATLANTIC 3,234 1,947 731 363 82 106 101
Atlanta, Ga. 1,971 1,158 478 224 38 73 40
Baltimore, Md. 206 113 51 31 6 3 16
Charlotte, N.C. 93 59 16 9 3 6 8
Jacksonville, Fla. 148 102 25 14 4 3 4
Miami, Fla. 107 72 25 7 2 1 -
Norfolk, Va. 50 37 3 4 3 3 2
Richmond, Va. 59 30 16 8 2 - 2
Savannah, Ga. 53 28 6 11 6 2 5
St. Petersburg, Fla. 75 58 9 6 - 2 6
Tampa, Fla. 163 110 29 16 6 2 11
Washington, D.C. 295 166 73 33 12 11 7
Wilmington, Del. 14 14 - - - - -
E.S. CENTRAL 795 536 162 56 20 18 54
Birmingham, Ala. 180 126 30 7 8 6 16
Chattanooga, Tenn. 67 46 17 4 - - 5
Knoxville, Tenn. 86 63 15 3 3 2 8
Lexington, Ky. 65 39 17 5 2 2 8
Memphis, Tenn. 113 71 26 11 3 2 8
Mobile, Ala. 89 55 17 13 - 4 1
Montgomery, Ala. 65 48 12 2 2 1 1
Nashville, Tenn. 130 88 28 11 2 1 7
W.S. CENTRAL 1,344 862 290 112 42 38 74
Austin, Tex. 70 45 13 6 4 2 5
Baton Rouge, La. 42 23 12 6 1 - -
Corpus Christi, Tex. 44 32 10 1 - 1 5
Dallas, Tex. 223 133 52 19 11 8 3
El Paso, Tex. 72 46 15 6 - 5 7
Ft. Worth, Tex. 91 67 15 6 - 3 4
Houston, Tex. 315 201 64 30 12 8 19
Little Rock, Ark. 72 43 13 7 3 6 4
New Orleans, La. 125 81 28 11 2 3 -
San Antonio, Tex. 186 129 38 13 6 - 18
Shreveport, La. U U U U U U U
Tulsa, Okla. 104 62 30 7 3 2 9
MOUNTAIN 907 598 187 80 20 22 60
Albuquerque, N.M. 94 53 25 12 3 1 8
Boise, Idaho 35 21 9 5 - - -
Colo. Springs, Colo. 49 34 7 5 1 2 1
Denver, Colo. 111 78 20 7 1 5 14
Las Vegas, Nev. 202 134 45 14 3 6 9
Ogden, Utah U U U U U U U
Phoenix, Ariz. 160 100 32 15 7 6 11
Pueblo, Colo. 27 16 4 6 1 - 1
Salt Lake City, Utah 112 76 27 7 1 1 5
Tucson, Ariz. 117 86 18 9 3 1 11
PACIFIC 2,190 1,570 391 146 43 40 157
Berkeley, Calif. 11 7 2 1 - 1 1
Fresno, Calif. 118 92 12 8 4 2 10
Glendale, Calif. 39 28 10 1 - - 1
Honolulu, Hawaii 82 49 23 4 2 4 7
Long Beach, Calif. 59 46 12 1 - - 8
Los Angeles, Calif. 771 544 139 63 17 8 48
Pasadena, Calif. 25 19 5 1 - - 3
Portland, Oreg. 164 127 24 5 3 5 7
Sacramento, Calif. 201 153 33 8 3 4 21
San Diego, Calif. 112 80 19 8 2 3 10
San Francisco, Calif. 129 83 29 14 - 3 11
San Jose, Calif. 154 108 28 12 3 3 14
Santa Cruz, Calif. 48 38 9 1 - - 2
Seattle, Wash. 119 82 18 9 6 4 1
Spokane, Wash. 63 47 11 5 - - 6
Tacoma, Wash. 95 67 17 5 3 3 7
TOTAL 13,646**** 9,046 2,785 1,133 340 317 697
---------------------------------------------------------------------------------------------------------------
U: Unavailable -: no reported cases
* Mortality data in this table are voluntarily reported from 122 cities in the United States, most of which have populations
of 100,000 or more. A death is reported by the place of its occurrence and by the week that the death certificate was
filed. Fetal deaths are not included.
** Pneumonia and influenza.
*** Because of changes in reporting methods in this Pennsylvania city, these numbers are partial counts for the current
week. Complete counts will be available in 4 to 6 weeks.
**** Total includes unknown ages.
===================================================================================================================================
Return to top. Disclaimer All MMWR HTML versions of articles are electronic conversions from ASCII text into HTML. This conversion may have resulted in character translation or format errors in the HTML version. Users should not rely on this HTML document, but are referred to the electronic PDF version and/or the original MMWR paper copy for the official text, figures, and tables. An original paper copy of this issue can be obtained from the Superintendent of Documents, U.S. Government Printing Office (GPO), Washington, DC 20402-9371; telephone: (202) 512-1800. Contact GPO for current prices. **Questions or messages regarding errors in formatting should be addressed to mmwrq@cdc.gov.Page converted: 10/05/98 |
|||||||||
This page last reviewed 5/2/01
|