 |
|
|
|
|
|
|
| ||||||||||
|
|
|
|
|
|
|
||||
| ||||||||||
|
|
|
|
|
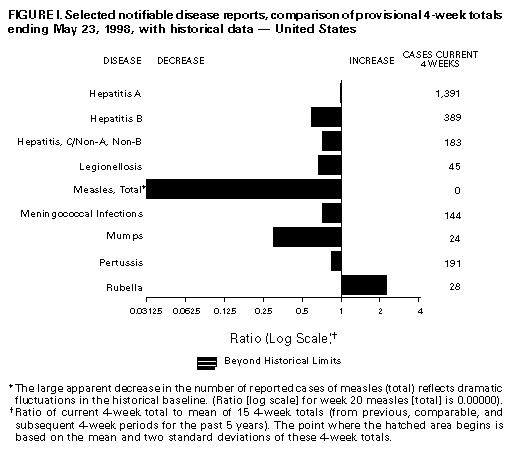
Persons using assistive technology might not be able to fully access information in this file. For assistance, please send e-mail to: mmwrq@cdc.gov. Type 508 Accommodation and the title of the report in the subject line of e-mail. Notifiable Diseases/Deaths in Selected Cities Weekly InformationFigure_I Selected notifiable disease reports, comparison of provisional 4-week totals ending May 23, 1998, with historical data -- United States Table_I Summary -- provisional cases of selected notifiable diseases, United States, cumulative, week ending May 23, 1998 (20th Week) Table_II Provisional cases of selected notifiable diseases, United States, weeks ending May 23, 1998 and May 17, 1997 (20th Week) Table_III Provisional cases of selected notifiable diseases preventable by vaccination, United States, weeks ending May 23, 1998 and May 17, 1997 (20th Week) Table_IV Deaths in 122 U.S. cities, week ending
May 23, 1998 (20th Week)
TABLE I. Summary -- provisional cases of specified notifiable diseases, United
States, cumulative, week ending May 23, 1998 (20th Week)
==================================================================================
                                             Cum. 1998
------------------------------------------------------
Anthrax                                              -
Brucellosis                                          8
Cholera                                              3
Congenital rubella syndrome                          2
Cryptosporidiosis*                                 662
Diphtheria                                           1
Encephalitis:  California*                           -
               eastern equine*                       -
               St. Louis*                            -
               western equine*                       -
Hansen Disease                                      45
Hantavirus pulmonary syndrome*+                      2
Hemolytic uremic syndrome, post-diarrheal*          10
HIV infection, pediatric*&                          88
Plague                                               -
Poliomyelitis, paralytic@                            -
Psittacosis                                         15
Rabies, human                                        -
Rocky Mountain spotted fever (RMSF)                 32
Streptococcal disease, invasive Group A            893
Streptococcal toxic-shock syndrome*                 25
Syphilis, congenital**                              64
Tetanus                                              8
Toxic-shock syndrome                                52
Trichinosis                                          5
Typhoid fever                                      109
Yellow fever                                         -
------------------------------------------------------
-: no reported cases
 * Not notifiable in all states
 + Updated weekly from reports to the Division of Viral and Rickettsial
   Diseases, National Center for Infectious Diseases (NCID).
 & Updated monthly to the Division of HIV/AIDS Prevention -- Surveillance
   and Epidemiology, National Center for HIV, STD, and TB Prevention
   (NCHSTP), last update April 26, 1998.
 @ One suspected case(s) of polio with onset in 1998 have also been reported
   to date.
** Updated from reports to the Division of STD Prevention, NCHSTP.

==================================================================================
Return to top. Table_II Note: To print large tables and graphs users may have to change their printer settings to landscape and use a small font size.
TABLE II. (page 1) Provisional cases of selected notifiable diseases, United States, weeks ending
May 23, 1998, and May 17, 1997 (20th Week)
Escherichia
coli O157:H7
------------------- Hepatitis
AIDS* Chlamydia NETSS** PHLIS*** Gonorrhea C\NA,NB
----------------- -------------------- -------- -------- ------------------- ----------------
Cum. Cum. Cum. Cum. Cum. Cum. Cum. Cum. Cum. Cum.
Reporting Area 1998 1997 1998 1997 1998 1998 1998 1997 1998 1997
------------------------------------------------------------------------------------------------------------------------------
UNITED STATES 16,097 22,446 186,752 174,647 357 166 110,456 106,060 1,630 1,121
NEW ENGLAND 489 676 7,230 6,638 40 25 1,871 2,267 17 30
Maine 10 25 364 358 1 - 14 20 - -
N.H. 14 14 337 297 7 5 32 53 - 3
Vt. 10 18 146 145 - - 11 22 - 1
Mass. 211 279 3,294 2,710 19 15 792 852 16 24
R.I. 40 55 964 800 3 1 139 193 1 2
Conn. 204 285 2,125 2,328 10 4 883 1,127 - -
MID. ATLANTIC 4,607 6,832 24,399 21,613 30 9 13,369 13,266 151 123
Upstate N.Y. 545 1,122 N N 22 - 1,937 2,369 125 94
N.Y. City 2,631 3,293 13,244 11,653 2 4 5,616 5,249 - -
N.J. 823 1,538 3,628 3,969 6 4 2,398 2,769 - -
Pa. 608 879 7,527 5,991 N 1 3,418 2,879 26 29
E.N. CENTRAL 1,299 1,639 32,562 27,852 58 19 22,133 16,388 184 270
Ohio 242 348 9,657 8,680 16 3 5,858 5,311 5 5
Ind. 275 301 2,706 3,363 10 7 1,769 2,296 3 6
Ill. 495 505 8,937 4,357 18 - 7,173 2,123 7 43
Mich. 218 394 8,372 7,309 14 4 6,227 4,950 169 201
Wis. 69 91 2,890 4,143 N 5 1,106 1,708 - 15
W.N. CENTRAL 288 449 10,963 11,632 45 26 5,485 5,196 100 25
Minn. 50 79 1,830 2,473 20 12 650 860 - 1
Iowa 14 58 1,639 1,778 3 - 505 453 10 12
Mo. 139 210 4,437 4,431 8 12 3,312 2,962 86 3
N. Dak. 4 3 290 339 1 1 29 23 - 2
S. Dak. 7 2 616 442 1 - 104 41 - -
Nebr. 32 34 915 724 6 - 331 266 2 1
Kans. 42 63 1,236 1,445 6 1 554 591 2 6
S. ATLANTIC 4,121 5,759 40,137 32,902 31 14 32,533 32,058 71 81
Del. 44 69 992 612 - 1 522 420 - -
Md. 488 725 3,217 2,768 10 4 3,544 5,072 3 6
D.C. 343 400 N N - - 1,365 1,516 - -
Va. 284 484 3,500 4,287 N 7 2,336 3,177 1 8
W. Va. 36 38 1,150 1,220 N - 324 379 3 5
N.C. 273 282 8,753 6,569 7 2 7,366 6,294 10 22
S.C. 283 293 7,320 4,751 1 - 4,725 4,236 - 17
Ga. 501 690 8,863 3,377 2 - 7,308 4,453 8 -
Fla. 1,869 2,778 6,342 9,318 10 - 5,043 6,511 46 23
E.S. CENTRAL 591 628 13,403 12,742 27 7 12,655 12,900 51 136
Ky. 87 61 2,329 2,546 6 - 1,298 1,695 9 6
Tenn. 184 302 4,735 4,845 16 7 3,963 4,070 39 83
Ala. 183 153 3,608 3,088 5 - 4,621 4,329 3 5
Miss. 137 112 2,731 2,263 - - 2,773 2,806 - 42
W.S. CENTRAL 1,953 2,504 22,753 20,791 24 4 13,471 13,830 452 124
Ark. 71 96 1,228 1,022 1 1 1,108 1,713 1 4
La. 333 428 4,731 3,098 - - 3,940 2,855 2 77
Okla. 106 116 4,052 2,930 3 3 2,179 1,840 1 4
Tex. 1,443 1,864 12,742 13,741 20 - 6,244 7,422 448 39
MOUNTAIN 526 706 6,997 9,822 29 17 2,646 2,939 286 136
Mont. 13 18 415 391 2 - 21 14 4 5
Idaho 12 22 715 578 2 - 63 43 80 19
Wyo. 2 13 268 200 - - 11 22 128 45
Colo. 91 194 - 1,736 5 4 917 752 10 17
N. Mex. 76 66 1,359 1,322 7 4 267 501 35 27
Ariz. 200 157 3,315 3,848 N 5 1,213 1,212 1 15
Utah 45 46 672 660 9 1 62 87 16 2
Nev. 87 190 253 1,087 4 3 92 308 12 6
PACIFIC 2,223 3,253 28,308 30,655 73 45 6,293 7,216 318 196
Wash. 165 241 4,301 3,575 17 22 718 784 9 10
Oreg. 64 144 2,137 1,807 23 17 292 275 2 2
Calif. 1,947 2,826 20,370 24,092 33 3 5,002 5,803 253 116
Alaska 11 18 726 541 - - 127 175 1 -
Hawaii 36 24 774 640 N 3 154 179 53 68
Guam - 2 8 181 N - 2 24 - -
P.R. 666 517 U U - U 158 250 - 44
V.I. 15 28 N N N U - - - -
Amer. Samoa - - - - N U - - - -
C.N.M.I. - - N N N U 7 15 - 2
------------------------------------------------------------------------------------------------------------------------------
N: Not notifiable U: Unavailable -: no reported cases C.N.M.I.: Commonwealth of North Mariana Islands
* Updated monthly to the Division of HIV/AIDS Prevention, -- Surveillance and Epidemiology, National Center for HIV, STD,
and TB Prevention, last update April 26, 1998.
** National Electronic Telecommunications System for Surveillance.
*** Public Health Laboratory Information System.
=======================================================================================================================================================
TABLE II. (page 2) Provisional cases of selected notifiable diseases, United States, weeks ending
May 23, 1998, and May 17, 1997 (20th Week)
Lyme Syphilis Rabies,
Legionellosis Disease Malaria (Primary & Secondary) Tuberculosis Animal
---------------- ---------------- ---------------- --------------------- ----------------- -------
Cum. Cum. Cum. Cum. Cum. Cum. Cum. Cum. Cum. Cum. Cum.
Reporting Area 1998 1997 1998 1997 1998 1997 1998 1997 1998 * 1997 1998
-------------------------------------------------------------------------------------------------------------------------------------------
UNITED STATES 387 318 1,546 1,222 396 506 2,525 3,384 2,363 6,061 2,586
NEW ENGLAND 22 26 367 255 17 22 29 66 107 151 504
Maine 1 1 1 3 1 1 1 - U 15 80
N.H. 2 4 7 6 3 2 1 - 2 1 33
Vt. 1 3 2 2 - 1 2 - 1 2 29
Mass. 8 10 77 47 11 16 20 36 87 79 157
R.I. 4 4 26 33 2 2 - - 17 7 33
Conn. 6 4 254 164 - - 5 30 U 47 172
MID. ATLANTIC 85 56 945 753 110 138 86 166 207 1,106 567
Upstate N.Y. 25 12 499 96 28 22 9 18 U 148 390
N.Y. City 14 2 2 59 51 82 21 33 U 578 U
N.J. 4 7 124 190 17 24 18 77 207 226 77
Pa. 42 35 320 408 14 10 38 38 U 154 100
E.N. CENTRAL 119 124 23 21 27 51 362 297 172 596 16
Ohio 52 59 22 7 2 4 69 95 5 120 15
Ind. 17 16 1 9 1 4 65 68 U 51 -
Ill. 12 5 - 2 6 24 136 24 167 293 1
Mich. 24 31 - 3 17 15 72 45 U 89 -
Wis. 14 13 U U 1 4 20 65 U 43 -
W.N. CENTRAL 29 24 11 12 21 11 63 66 74 183 260
Minn. 3 1 3 9 8 5 3 13 U 49 48
Iowa 2 4 7 - 2 3 - 3 U 20 50
Mo. 11 2 - 2 8 2 48 34 62 71 15
N. Dak. - 2 - - 1 - - - U 4 45
S. Dak. - 1 - - - - 1 - 9 2 54
Nebr. 10 10 - 1 - 1 4 - 3 4 2
Kans. 3 4 1 - 2 - 7 16 U 33 46
S. ATLANTIC 51 39 134 125 102 92 1,097 1,368 503 1,084 840
Del. 6 5 - 24 1 2 12 11 - 13 17
Md. 10 11 100 84 33 32 257 382 98 107 209
D.C. 3 2 4 5 7 6 31 49 43 34 -
Va. 4 4 6 - 15 22 72 113 89 111 250
W. Va. N N 4 - - - 2 3 21 21 36
N.C. 6 5 3 3 8 6 319 273 142 127 136
S.C. 4 2 1 1 3 5 130 168 U 90 62
Ga. - - 2 1 13 12 191 243 U 200 45
Fla. 17 10 14 7 22 7 83 126 U 381 85
E.S. CENTRAL 12 10 17 25 10 14 417 746 - 452 109
Ky. 8 - 3 3 1 3 46 62 U 63 16
Tenn. 4 4 7 9 6 4 212 304 U 146 66
Ala. - 2 7 2 3 4 98 193 U 161 27
Miss. - 4 - 11 - 3 61 187 U 82 -
W.S. CENTRAL 9 5 5 3 10 7 272 464 41 904 69
Ark. - - 2 1 - 1 47 65 41 76 1
La. - 1 - 1 4 4 116 153 - 58 -
Okla. 4 1 - - 1 2 20 48 U 66 68
Tex. 5 3 3 1 5 - 89 198 U 704 -
MOUNTAIN 24 18 1 2 19 30 80 69 117 189 60
Mont. 1 1 - - - 2 - - 12 2 19
Idaho - 1 - - 2 - - - 4 4 -
Wyo. 1 1 - - - 1 - - 2 2 35
Colo. 4 4 - - 6 15 4 2 U 42 1
N. Mex. 2 1 - - 6 4 10 - 7 6 -
Ariz. 4 4 - 1 4 3 61 59 71 83 5
Utah 11 4 - - 1 1 3 2 21 6 -
Nev. 1 2 1 1 - 4 2 6 U 44 -
PACIFIC 36 16 43 26 80 141 119 142 1,142 1,396 161
Wash. 3 3 1 - 6 8 7 6 - 116 -
Oreg. - - 5 8 9 8 2 3 U 57 -
Calif. 33 12 37 18 64 121 110 131 1,066 1,109 146
Alaska - - - - - 2 - 1 16 35 15
Hawaii - 1 - - 1 2 - 1 60 79 -
Guam - - - - - - - 3 - 13 -
P.R. - - - - - 3 92 80 46 88 24
V.I. - - - - - - - - - - -
Amer. Samoa - - - - - - - - - - -
C.N.M.I. - - - - - - 1 5 8 - -
-------------------------------------------------------------------------------------------------------------------------------------------
N: Not notifiable U: Unavailable -: no reported cases
* Additional information about areas displaying 'U' for cumulative Tuberculosis cases can be found in Notices to Readers, MMWR Vol. 47, No. 2, p. 39.
=======================================================================================================================================================
Return to top. Table_III Note: To print large tables and graphs users may have to change their printer settings to landscape and use a small font size.
TABLE III. (page 1) Provisional cases of selected notifiable diseases preventable by vaccination, United
States, weeks ending May 23, 1998, and May 17, 1997 (20th Week)
Hepatitis (Viral), by type Measles (Rubeola)
H. influenzae, --------------------------------------- ------------------------------------------------------------
invasive A B Indigenous Imported** Total
---------------- ----------------- ----------------- --------------- --------------- ---------------
Cum. Cum. Cum. Cum. Cum. Cum. Cum. Cum. Cum. Cum.
Reporting Area 1998* 1997 1998 1997 1998 1997 1998 1998 1998 1998 1998 1997
-----------------------------------------------------------------------------------------------------------------------------------------------------
UNITED STATES 421 474 7,996 10,683 2,819 3,505 - 6 - 10 16 56
NEW ENGLAND 24 25 101 265 33 71 - - - 1 1 7
Maine 2 3 10 35 - 3 - - - - - -
N.H. 1 3 6 16 7 5 - - - - - -
Vt. 2 - 8 6 1 2 - - - - - -
Mass. 17 16 25 133 12 35 - - - 1 1 7
R.I. 2 2 8 20 13 8 - - - - - -
Conn. - 1 44 55 - 18 - - - - - -
MID. ATLANTIC 62 59 519 954 415 538 - 1 - 1 2 12
Upstate N.Y. 24 3 128 105 114 95 - - - - - 4
N.Y. City 10 20 137 431 114 218 - - - - - 5
N.J. 26 23 113 145 60 104 - 1 - - 1 2
Pa. 2 13 141 273 127 121 - - - 1 1 1
E.N. CENTRAL 57 72 991 1,238 285 635 - 2 - 2 4 6
Ohio 27 38 122 169 26 37 - - - - - -
Ind. 13 5 71 125 24 43 U 2 U 1 3 -
Ill. 16 20 158 318 51 125 - - - - - 5
Mich. - 9 563 540 172 200 - - - 1 1 1
Wis. 1 - 77 86 12 230 - - - - - -
W.N. CENTRAL 31 23 685 748 128 214 - - - - - 10
Minn. 17 14 28 64 11 17 - - - - - 1
Iowa 1 2 323 98 19 15 - - - - - -
Mo. 9 3 267 420 78 159 - - - - - 1
N. Dak. - - 2 7 2 1 U - U - - -
S. Dak. - 2 8 12 1 - - - - - - 8
Nebr. - 1 13 22 6 8 - - - - - -
Kans. 4 1 44 125 11 14 U - U - - -
S. ATLANTIC 95 85 679 585 400 424 - 1 - 5 6 2
Del. - - 2 11 - 3 - - - 1 1 -
Md. 26 35 144 120 60 71 - - - 1 1 1
D.C. - - 25 13 6 18 - - - - - 1
Va. 11 6 110 68 40 45 - - - 2 2 -
W. Va. 3 3 1 5 3 6 - - - - - -
N.C. 12 13 41 80 82 93 - - - - - -
S.C. 3 3 12 54 - 41 - - - - - -
Ga. 18 17 116 115 59 46 U - U 1 1 -
Fla. 22 8 228 119 150 101 - 1 - - 1 -
E.S. CENTRAL 24 30 154 275 163 245 - - - - - 1
Ky. 3 4 8 30 18 16 - - - - - -
Tenn. 15 18 110 167 119 154 - - - - - -
Ala. 6 7 36 45 26 30 - - - - - 1
Miss. - 1 - 33 - 45 U - U - - -
W.S. CENTRAL 26 20 1,403 1,947 416 347 - - - - - 4
Ark. - 1 24 102 23 22 - - - - - -
La. 12 3 13 82 9 45 - - - - - -
Okla. 12 14 230 652 26 11 - - - - - -
Tex. 2 2 1,136 1,111 358 269 - - - - - 4
MOUNTAIN 59 51 1,323 1,606 334 350 - - - - - 3
Mont. - - 30 44 3 5 - - - - - -
Idaho - 1 91 70 16 12 - - - - - -
Wyo. - 1 26 18 7 9 - - - - - -
Colo. 12 9 101 184 41 71 - - - - - -
N. Mex. 4 3 74 107 126 123 - - - - - -
Ariz. 33 13 848 759 91 72 - - - - - 2
Utah 4 3 90 284 28 38 - - - - - -
Nev. 6 21 63 140 22 20 U - U - - 1
PACIFIC 43 109 2,141 3,065 645 681 - 2 - 1 3 11
Wash. 3 1 380 212 48 24 - - - - - -
Oreg. 27 20 151 154 50 46 - - - - - -
Calif. 10 84 1,580 2,622 538 595 - 2 - 1 3 8
Alaska 1 1 10 16 4 10 - - - - - -
Hawaii 2 3 20 61 5 6 - - - - - 3
Guam - - - - - 3 U - U - - -
P.R. 2 - 16 148 226 527 - - - - - -
V.I. - - - - - - U - U - - -
Amer. Samoa - - - - - - U - U - - -
C.N.M.I. - 5 - 1 7 21 U - U - - 1
-----------------------------------------------------------------------------------------------------------------------------------------------------
N: Not notifiable U: Unavailable -: no reported cases
* Of 99 cases among children aged <5 years, serotype was reported for 51 and of those, 24 were type b.
** For imported measles, cases include only those resulting from importation from other countries.
=======================================================================================================================================================
TABLE III. (page 2) Provisional cases of selected notifiable diseases preventable by vaccination, United
States, weeks ending May 23, 1998, and May 17, 1997 (20th Week)
Meningococcal
Disease Mumps Pertussis Rubella
----------------- -------------------------- --------------------------- ---------------------------
Cum. Cum. Cum. Cum. Cum. Cum. Cum. Cum.
Reporting Area 1998 1997 1998 1998 1997 1998 1998 1997 1998 1998 1997
------------------------------------------------------------------------------------------------------------------------------------------
UNITED STATES 1,180 1,646 2 179 275 34 1,437 2,111 2 202 37
NEW ENGLAND 65 101 - - 7 - 245 479 - 32 -
Maine 4 8 - - - - 5 6 - - -
N.H. 4 10 - - - - 19 57 - - -
Vt. 1 2 - - - - 24 161 - - -
Mass. 30 56 - - 2 - 191 235 - 6 -
R.I. 3 6 - - 4 - - 12 - - -
Conn. 23 19 - - 1 - 6 8 - 26 -
MID. ATLANTIC 123 165 - 10 29 2 167 180 - 93 13
Upstate N.Y. 30 38 - 3 4 2 101 62 - 89 2
N.Y. City 13 28 - 4 1 - 4 44 - 2 11
N.J. 35 32 - - 4 - 5 10 - 2 -
Pa. 45 67 - 3 20 - 57 64 - - -
E.N. CENTRAL 151 241 - 27 33 2 143 206 - - 3
Ohio 58 91 - 11 12 - 53 62 - - -
Ind. 25 27 U 2 4 U 42 22 U - -
Ill. 33 79 - 1 9 - 10 27 - - -
Mich. 17 22 - 13 7 2 21 28 - - -
Wis. 18 22 - - 1 - 17 67 - - 3
W.N. CENTRAL 98 118 - 18 7 - 125 112 1 3 -
Minn. 16 17 - 10 3 - 76 67 - - -
Iowa 14 23 - 5 3 - 26 7 - - -
Mo. 40 59 - 2 - - 9 21 1 2 -
N. Dak. - 1 U 1 - U - 2 U - -
S. Dak. 6 3 - - - - 4 1 - - -
Nebr. 4 4 - - 1 - 4 2 - - -
Kans. 18 11 U - - U 6 12 U 1 -
S. ATLANTIC 203 275 - 30 37 4 105 174 - 4 1
Del. 1 4 - - - - - - - - -
Md. 19 29 - - 4 - 19 73 - - -
D.C. - 5 - - - - 1 2 - - -
Va. 20 25 - 4 4 - 6 19 - - 1
W. Va. 5 10 - - - - 1 3 - - -
N.C. 27 48 - 7 6 - 42 35 - 3 -
S.C. 30 36 - 4 9 - 12 9 - - -
Ga. 40 51 U 1 5 U 1 5 U - -
Fla. 61 67 - 14 9 4 23 28 - 1 -
E.S. CENTRAL 86 113 - - 15 2 38 39 - - -
Ky. 13 29 - - 2 - 16 10 - - -
Tenn. 37 36 - - 3 1 10 12 - - -
Ala. 36 31 - - 5 1 12 10 - - -
Miss. - 17 U - 5 U - 7 U - -
W.S. CENTRAL 131 150 - 25 31 10 88 44 1 55 3
Ark. 17 22 - - - 2 12 3 - - -
La. 25 29 - 2 7 - - 7 - - -
Okla. 23 18 - - - 7 13 8 - - -
Tex. 66 81 - 23 24 1 63 26 1 55 3
MOUNTAIN 75 105 - 16 36 10 334 555 - 5 2
Mont. 2 7 - - - - 1 5 - - -
Idaho 3 7 - 1 2 4 161 371 - - -
Wyo. 3 - - 1 1 - 7 3 - - -
Colo. 17 31 - 2 3 1 52 133 - - -
N. Mex. 13 17 N N N 1 56 23 - 1 -
Ariz. 26 22 - 4 22 4 36 9 - 1 2
Utah 8 11 - 3 4 - 14 3 - 2 -
Nev. 3 10 U 5 4 U 7 8 U 1 -
PACIFIC 248 378 2 53 80 4 192 322 - 10 15
Wash. 28 46 1 5 9 4 115 152 - 8 2
Oreg. 48 81 N N N - 12 21 - - -
Calif. 167 248 1 34 56 - 61 141 - 1 7
Alaska 1 1 - 2 5 - - 2 - - -
Hawaii 4 2 - 12 10 - 4 6 - 1 6
Guam - 1 U - 1 U - - U - -
P.R. 2 9 - 2 4 - 2 - - - -
V.I. - - U - - U - - U - -
Amer. Samoa - - U - - U - - U - -
C.N.M.I. - - U - 1 U - - U - -
------------------------------------------------------------------------------------------------------------------------------------------
N: Not notifiable U: Unavailable -: no reported cases
=======================================================================================================================================================
Return to top. Table_IV Note: To print large tables and graphs users may have to change their printer settings to landscape and use a small font size.
TABLE IV. Deaths in 122 U.S. cities,* week ending
May 23, 1998 (20th Week)
===================================================================================================================================
All Causes, By Age (Years)
------------------------------------------------------------------------ P&I**
Reporting Area All Ages >=65 45-64 25-44 1-24 <1 Total
---------------------------------------------------------------------------------------------------------------
NEW ENGLAND 607 446 100 39 12 10 48
Boston, Mass. 130 87 27 10 4 2 11
Bridgeport, Conn. 43 33 6 3 - 1 4
Cambridge, Mass. 21 16 3 2 - - 5
Fall River, Mass. 30 24 4 - 1 1 2
Hartford, Conn. 58 37 12 5 2 2 4
Lowell, Mass. 37 29 8 - - - -
Lynn, Mass. 13 11 1 1 - - -
New Bedford, Mass. 33 28 2 2 1 - 3
New Haven, Conn. 43 29 7 5 1 1 5
Providence, R.I. 53 40 8 1 2 2 1
Somerville, Mass. 8 6 2 - - - 2
Springfield, Mass. 53 36 12 5 - - 4
Waterbury, Conn. 31 26 2 2 1 - -
Worcester, Mass. 54 44 6 3 - 1 7
MID. ATLANTIC 2,226 1,583 411 160 40 32 130
Albany, N.Y. 48 36 3 5 - 4 4
Allentown, Pa. 10 10 - - - - -
Buffalo, N.Y. 98 72 16 5 3 2 11
Camden, N.J. 26 22 2 1 1 - 2
Elizabeth, N.J. 23 13 6 1 - 3 -
Erie, Pa. 51 41 9 1 - - -
Jersey City, N.J. 49 26 12 8 1 2 1
New York City, N.Y. 1,103 753 223 93 20 14 37
Newark, N.J. U U U U U U U
Paterson, N.J. 18 11 3 2 1 1 -
Philadelphia, Pa. 400 291 80 23 4 2 40
Pittsburgh, Pa.*** 66 48 7 8 1 2 8
Reading, Pa. 31 26 4 - 1 - 3
Rochester, N.Y. 115 91 15 3 4 2 6
Schenectady, N.Y. 23 17 5 1 - - 1
Scranton, Pa. 22 15 4 3 - - 2
Syracuse, N.Y. 110 85 15 6 4 - 12
Trenton, N.J. 18 14 4 - - - 3
Utica, N.Y. 15 12 3 - - - -
Yonkers, N.Y. U U U U U U U
E.N. CENTRAL 1,832 1,244 356 127 50 55 109
Akron, Ohio 32 23 5 2 1 1 -
Canton, Ohio 44 38 4 1 - 1 2
Chicago, Ill. 407 243 95 37 18 14 28
Cincinnati, Ohio 94 60 23 2 6 3 7
Cleveland, Ohio 122 78 28 9 1 6 1
Columbus, Ohio 169 126 29 8 3 3 12
Dayton, Ohio 132 90 33 5 - 4 10
Detroit, Mich. 198 124 48 13 3 10 4
Evansville, Ind. 49 36 8 3 1 1 1
Fort Wayne, Ind. 14 12 1 1 - - 2
Gary, Ind. 7 6 - - 1 - -
Grand Rapids, Mich. 61 44 7 5 3 2 7
Indianapolis, Ind. 205 133 37 23 6 6 15
Lansing, Mich. 28 22 4 2 - - 1
Milwaukee, Wis. 85 61 14 8 1 1 9
Peoria, Ill. 50 35 7 4 2 2 5
Rockford, Ill. 32 23 6 2 1 - 1
South Bend, Ind. 49 44 3 1 - 1 2
Toledo, Ohio U U U U U U U
Youngstown, Ohio 54 46 4 1 3 - 2
W.N. CENTRAL 748 529 133 44 19 13 36
Des Moines, Iowa 67 52 11 3 1 - 5
Duluth, Minn. 16 14 2 - - - 2
Kansas City, Kans. 34 23 5 5 1 - 1
Kansas City, Mo. 84 49 19 3 2 1 5
Lincoln, Nebr. 42 34 6 1 1 - 2
Minneapolis, Minn. 128 98 17 9 2 2 4
Omaha, Nebr. 92 68 16 3 4 1 5
St. Louis, Mo. 118 63 31 10 6 8 6
St. Paul, Minn. 91 76 9 4 1 1 5
Wichita, Kans. 76 52 17 6 1 - 1
S. ATLANTIC 1,048 671 237 89 38 13 49
Atlanta, Ga. U U U U U U U
Baltimore, Md. 122 67 27 20 5 3 13
Charlotte, N.C. 73 52 15 2 2 2 6
Jacksonville, Fla. 127 79 37 8 2 1 -
Miami, Fla. 100 70 20 8 2 - 1
Norfolk, Va. 37 28 3 3 2 1 1
Richmond, Va. 58 34 16 6 1 1 4
Savannah, Ga. 38 29 6 2 1 - 5
St. Petersburg, Fla. 76 59 10 3 3 1 3
Tampa, Fla. 175 108 45 14 7 1 13
Washington, D.C. 232 135 58 23 13 3 3
Wilmington, Del. 10 10 - - - - -
E.S. CENTRAL 815 555 151 68 28 10 69
Birmingham, Ala. 167 107 38 15 4 - 16
Chattanooga, Tenn. 75 56 10 7 1 1 7
Knoxville, Tenn. 83 58 17 5 3 - 7
Lexington, Ky. 68 46 10 6 4 2 10
Memphis, Tenn. 178 123 33 15 6 1 11
Mobile, Ala. 80 56 12 7 3 2 2
Montgomery, Ala. 34 27 3 3 1 - -
Nashville, Tenn. 130 82 28 10 6 4 16
W.S. CENTRAL 1,169 778 234 93 49 14 84
Austin, Tex. 55 37 15 2 1 - 3
Baton Rouge, La. 49 34 6 5 3 1 2
Corpus Christi, Tex. 49 27 12 5 3 1 1
Dallas, Tex. 179 107 35 21 15 1 4
El Paso, Tex. 33 24 6 1 1 1 -
Ft. Worth, Tex. 76 53 17 5 - 1 9
Houston, Tex. 368 240 71 36 16 5 32
Little Rock, Ark. 71 47 19 4 1 - 11
New Orleans, La. U U U U U U U
San Antonio, Tex. 181 124 37 10 6 4 7
Shreveport, La. U U U U U U U
Tulsa, Okla. 108 85 16 4 3 - 15
MOUNTAIN 1,001 681 172 73 38 28 79
Albuquerque, N.M. 106 71 26 6 1 2 6
Boise, Idaho 37 31 2 3 1 - 4
Colo. Springs, Colo. 57 42 10 2 2 1 3
Denver, Colo. 88 54 18 8 1 6 11
Las Vegas, Nev. 192 126 38 19 5 4 11
Ogden, Utah 29 24 3 1 1 - 7
Phoenix, Ariz. 225 133 43 18 20 8 17
Pueblo, Colo. 22 17 2 2 1 - 3
Salt Lake City, Utah 103 76 15 4 2 6 11
Tucson, Ariz. 142 107 15 10 4 1 6
PACIFIC 1,095 767 188 81 35 24 95
Berkeley, Calif. 10 9 - - - 1 1
Fresno, Calif. 100 76 12 5 7 - 5
Glendale, Calif. 20 15 4 1 - - 3
Honolulu, Hawaii 73 53 15 4 - 1 3
Long Beach, Calif. 64 45 12 3 2 2 11
Los Angeles, Calif. 296 180 57 38 15 6 31
Pasadena, Calif. 24 18 4 - - 2 4
Portland, Oreg. U U U U U U U
Sacramento, Calif. U U U U U U U
San Diego, Calif. 127 87 29 7 1 3 11
San Francisco, Calif. 118 81 21 9 3 4 11
San Jose, Calif. U U U U U U U
Santa Cruz, Calif. 25 20 2 2 1 - 3
Seattle, Wash. 118 90 18 8 2 - 5
Spokane, Wash. 44 34 6 1 2 1 7
Tacoma, Wash. 76 59 8 3 2 4 -
TOTAL 10,541**** 7,254 1,982 774 309 199 699
---------------------------------------------------------------------------------------------------------------
U: Unavailable -: no reported cases
* Mortality data in this table are voluntarily reported from 122 cities in the United States, most of which have populations
of 100,000 or more. A death is reported by the place of its occurrence and by the week that the death certificate was
filed. Fetal deaths are not included.
** Pneumonia and influenza.
*** Because of changes in reporting methods in this Pennsylvania city, these numbers are partial counts for the current
week. Complete counts will be available in 4 to 6 weeks.
**** Total includes unknown ages.
===================================================================================================================================
Return to top. Disclaimer All MMWR HTML versions of articles are electronic conversions from ASCII text into HTML. This conversion may have resulted in character translation or format errors in the HTML version. Users should not rely on this HTML document, but are referred to the electronic PDF version and/or the original MMWR paper copy for the official text, figures, and tables. An original paper copy of this issue can be obtained from the Superintendent of Documents, U.S. Government Printing Office (GPO), Washington, DC 20402-9371; telephone: (202) 512-1800. Contact GPO for current prices. **Questions or messages regarding errors in formatting should be addressed to mmwrq@cdc.gov.Page converted: 10/05/98 |
|||||||||
This page last reviewed 5/2/01
|