 |
|
|
|
|
|
|
| ||||||||||
|
|
|
|
|
|
|
||||
| ||||||||||
|
|
|
|
|
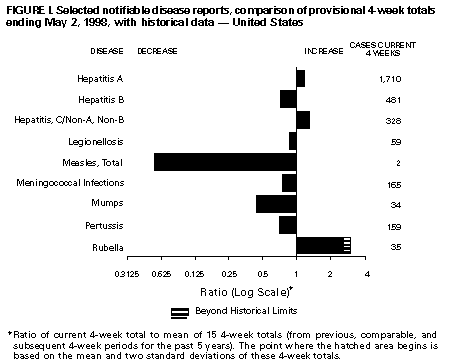
Persons using assistive technology might not be able to fully access information in this file. For assistance, please send e-mail to: mmwrq@cdc.gov. Type 508 Accommodation and the title of the report in the subject line of e-mail. Notifiable Diseases/Deaths in Selected Cities Weekly InformationFigure_I Selected notifiable disease reports, comparison of provisional 4-week totals ending May 2, 1998, with historical data -- United States Table_I Summary -- provisional cases of selected notifiable diseases, United States, cumulative, week ending May 2, 1998 (17th Week) Table_II Provisional cases of selected notifiable diseases, United States, weeks ending May 2, 1998 and April 26, 1997 (17th Week) Table_III Provisional cases of selected notifiable diseases preventable by vaccination, United States, weeks ending May 2, 1998 and April 26, 1997 (17th Week) Table_IV Deaths in 122 U.S. cities, week ending
May 2, 1998 (17th Week)
TABLE I. Summary -- provisional cases of specified notifiable diseases, United
States, cumulative, week ending May 2, 1998 (17th Week)
==================================================================================
                                             Cum. 1998
------------------------------------------------------
Anthrax                                              -
Brucellosis                                          7
Cholera                                              -
Congenital rubella syndrome                          1
Cryptosporidiosis*                                 578
Diphtheria                                           -
Encephalitis:  California*                           -
               eastern equine*                       -
               St. Louis*                            -
               western equine*                       -
Hansen Disease                                      42
Hantavirus pulmonary syndrome*+                      2
Hemolytic uremic syndrome, post-diarrheal*           6
HIV infection, pediatric*&                          88
Plague                                               -
Poliomyelitis, paralytic@                            -
Psittacosis                                         13
Rabies, human                                        -
Rocky Mountain spotted fever (RMSF)                 21
Streptococcal disease, invasive Group A            804
Streptococcal toxic-shock syndrome*                 23
Syphilis, congenital**                              50
Tetanus                                              5
Toxic-shock syndrome                                49
Trichinosis                                          2
Typhoid fever                                       96
Yellow fever                                         -
------------------------------------------------------
-: no reported cases
 * Not notifiable in all states
 + Updated weekly from reports to the Division of Viral and Rickettsial
   Diseases, National Center for Infectious Diseases (NCID).
 & Updated monthly to the Division of HIV/AIDS Prevention -- Surveillance
   and Epidemiology, National Center for HIV, STD, and TB Prevention
   (NCHSTP), last update April 26, 1998.
 @ One suspected case(s) of polio with onset in 1998 have also been reported
   to date.
** Updated from reports to the Division of STD Prevention, NCHSTP.

==================================================================================
Return to top. Table_II Note: To print large tables and graphs users may have to change their printer settings to landscape and use a small font size.
TABLE II. (page 1) Provisional cases of selected notifiable diseases, United States, weeks ending
May 2, 1998, and April 26, 1997 (17th Week)
Escherichia
coli O157:H7
------------------- Hepatitis
AIDS* Chlamydia NETSS** PHLIS*** Gonorrhea C\NA,NB
----------------- -------------------- -------- -------- ------------------- ----------------
Cum. Cum. Cum. Cum. Cum. Cum. Cum. Cum. Cum. Cum.
Reporting Area 1998 1997 1998 1997 1998 1998 1998 1997 1998 1997
------------------------------------------------------------------------------------------------------------------------------
UNITED STATES 16,097 19,000 165,660 150,148 261 125 97,984 91,257 1,431 888
NEW ENGLAND 489 587 6,185 5,696 31 16 1,614 1,959 16 25
Maine 10 18 301 315 1 - 14 14 - -
N.H. 14 8 304 253 5 2 30 47 - 2
Vt. 10 16 123 132 - - 8 16 - 1
Mass. 211 217 2,822 2,338 15 12 683 749 16 20
R.I. 40 45 816 688 3 1 112 175 - 2
Conn. 204 283 1,819 1,970 7 1 767 958 - -
MID. ATLANTIC 4,607 6,392 20,695 18,300 21 6 11,553 11,568 117 92
Upstate N.Y. 545 1,115 N N 16 - 1,833 1,971 101 71
N.Y. City 2,631 3,137 11,613 9,934 - 4 5,083 4,666 - -
N.J. 823 1,351 2,549 3,402 5 2 1,754 2,354 - -
Pa. 608 789 6,533 4,964 N - 2,883 2,577 16 21
E.N. CENTRAL 1,299 1,345 31,018 23,554 46 14 20,537 13,962 151 217
Ohio 242 267 7,078 7,294 16 3 4,360 4,513 5 5
Ind. 275 283 2,706 2,812 6 3 1,769 1,945 3 5
Ill. 495 378 11,673 3,688 13 - 8,204 1,857 7 31
Mich. 218 346 7,213 6,275 11 4 5,346 4,207 136 162
Wis. 69 71 2,348 3,485 N 4 858 1,440 - 14
W.N. CENTRAL 288 396 9,677 10,268 30 24 4,575 4,509 96 22
Minn. 50 54 1,521 2,456 12 12 526 845 - -
Iowa 14 51 1,389 1,558 2 - 408 402 9 11
Mo. 139 208 3,907 3,750 6 11 2,670 2,463 84 3
N. Dak. 4 3 290 303 1 1 29 22 - 2
S. Dak. 7 2 555 361 - - 93 37 - -
Nebr. 32 28 872 668 4 - 327 251 1 1
Kans. 42 50 1,143 1,172 5 - 522 489 2 5
S. ATLANTIC 4,121 4,482 34,550 27,856 25 10 28,139 27,019 51 70
Del. 44 69 841 612 - 1 453 351 - -
Md. 488 562 2,693 2,245 9 4 2,943 4,143 3 6
D.C. 343 305 N N - - 1,132 1,367 - -
Va. 284 327 3,084 3,829 N 5 2,128 2,788 1 7
W. Va. 36 27 830 1,041 N - 226 320 3 3
N.C. 273 279 7,366 5,670 7 - 6,292 5,397 7 20
S.C. 283 236 6,184 3,964 1 - 3,995 3,465 - 16
Ga. 501 534 8,027 2,527 2 - 6,666 3,586 8 -
Fla. 1,869 2,143 5,525 7,968 6 - 4,304 5,602 29 18
E.S. CENTRAL 591 560 11,853 10,970 19 6 11,285 11,018 42 116
Ky. 87 49 2,002 2,147 5 - 1,134 1,447 7 5
Tenn. 184 246 3,798 4,048 10 6 3,210 3,439 32 66
Ala. 183 153 3,322 2,654 4 - 4,168 3,601 3 5
Miss. 137 112 2,731 2,121 - - 2,773 2,531 - 40
W.S. CENTRAL 1,953 2,038 21,007 19,377 12 2 12,355 12,576 431 77
Ark. 71 83 1,148 876 1 1 1,094 1,493 - 1
La. 333 403 3,801 2,304 - - 3,195 2,092 1 56
Okla. 106 116 3,316 2,456 1 1 1,822 1,569 - 4
Tex. 1,443 1,436 12,742 13,741 10 - 6,244 7,422 430 16
MOUNTAIN 526 555 6,197 8,226 23 15 2,296 2,513 265 105
Mont. 13 16 352 300 1 - 20 14 4 4
Idaho 12 17 624 504 2 - 51 34 79 15
Wyo. 2 11 222 168 1 - 11 20 115 38
Colo. 91 170 - 1,424 3 2 792 666 10 14
N. Mex. 76 35 1,117 1,227 5 4 201 436 28 19
Ariz. 200 123 3,113 3,166 N 5 1,078 1,017 1 10
Utah 45 39 516 473 7 1 51 54 16 2
Nev. 87 144 253 964 4 3 92 272 12 3
PACIFIC 2,223 2,645 24,478 25,901 54 32 5,630 6,133 262 164
Wash. 165 238 3,628 2,993 14 11 613 665 8 8
Oreg. 64 97 1,858 1,520 15 15 261 236 2 2
Calif. 1,947 2,268 17,732 20,381 25 3 4,531 4,931 217 101
Alaska 11 18 624 471 - - 96 152 1 -
Hawaii 36 24 636 536 N 3 129 149 34 53
Guam - 2 8 143 N - 2 18 - -
P.R. 666 419 U U - U 130 201 - 29
V.I. 15 16 N N N U - - - -
Amer. Samoa - - - - N U - - - -
C.N.M.I. - - N N N U 7 11 - 2
------------------------------------------------------------------------------------------------------------------------------
N: Not notifiable U: Unavailable -: no reported cases C.N.M.I.: Commonwealth of North Mariana Islands
* Updated monthly to the Division of HIV/AIDS Prevention, -- Surveillance and Epidemiology, National Center for HIV, STD,
and TB Prevention, last update April 26, 1998.
** National Electronic Telecommunications System for Surveillance.
*** Public Health Laboratory Information System.
=======================================================================================================================================================
TABLE II. (page 2) Provisional cases of selected notifiable diseases, United States, weeks ending
May 2, 1998, and April 26, 1997 (17th Week)
Lyme Syphilis Rabies,
Legionellosis Disease Malaria (Primary & Secondary) Tuberculosis Animal
---------------- ---------------- ---------------- --------------------- ----------------- -------
Cum. Cum. Cum. Cum. Cum. Cum. Cum. Cum. Cum. Cum. Cum.
Reporting Area 1998 1997 1998 1997 1998 1997 1998 1997 1998 * 1997 1998
-------------------------------------------------------------------------------------------------------------------------------------------
UNITED STATES 333 272 1,110 986 334 411 2,235 2,880 1,831 4,937 2,222
NEW ENGLAND 19 21 211 180 16 15 25 53 81 120 435
Maine 1 1 - 3 1 - 1 - U 11 72
N.H. 2 3 5 4 2 2 1 - 2 1 33
Vt. 1 3 2 2 - 1 1 - 1 - 24
Mass. 5 9 61 36 11 11 19 27 64 61 131
R.I. 4 1 24 32 2 1 - - 14 7 30
Conn. 6 4 119 103 - - 3 26 U 40 145
MID. ATLANTIC 69 45 697 654 90 111 78 137 162 881 499
Upstate N.Y. 23 11 401 78 26 19 4 15 U 107 344
N.Y. City 8 2 - 49 41 64 18 25 U 490 U
N.J. 3 5 53 159 14 18 18 67 162 188 64
Pa. 35 27 243 368 9 10 38 30 U 96 91
E.N. CENTRAL 111 112 23 12 24 40 333 248 136 476 15
Ohio 52 54 22 5 2 3 54 85 5 104 15
Ind. 16 15 1 4 1 4 54 54 U 41 -
Ill. 12 5 - 1 6 17 155 19 131 220 -
Mich. 23 28 - 2 14 13 52 35 U 77 -
Wis. 8 10 U U 1 3 18 55 U 34 -
W.N. CENTRAL 25 19 10 9 20 9 53 69 59 148 198
Minn. 3 1 3 7 8 4 - 18 U 42 30
Iowa 2 2 6 - 2 2 - 3 U 15 41
Mo. 9 2 - 1 7 2 43 32 52 56 12
N. Dak. - 1 - - 1 - - - U 2 42
S. Dak. - 1 - - - - - - 4 2 33
Nebr. 8 8 - 1 - 1 4 - 3 4 -
Kans. 3 4 1 - 2 - 6 16 U 27 40
S. ATLANTIC 45 34 116 94 82 78 949 1,149 315 859 740
Del. 6 5 - 18 1 2 9 8 - 9 17
Md. 9 10 92 63 29 25 213 332 80 87 178
D.C. 3 1 4 4 4 5 30 42 37 24 -
Va. 4 4 4 - 9 19 66 97 53 111 214
W. Va. N N 4 - - - - 3 19 17 32
N.C. 4 5 1 2 7 5 269 234 126 112 136
S.C. 4 2 - 1 3 5 116 128 U 87 44
Ga. - - 2 1 13 11 171 206 U 144 45
Fla. 15 7 9 5 16 6 75 99 U 268 74
E.S. CENTRAL 7 9 14 18 9 12 365 619 - 382 88
Ky. 4 - 2 1 1 3 41 56 U 56 14
Tenn. 3 3 7 4 5 3 183 253 U 131 55
Ala. - 2 5 2 3 3 80 158 U 124 19
Miss. - 4 - 11 - 3 61 152 U 71 -
W.S. CENTRAL 4 1 3 2 9 6 247 431 38 725 65
Ark. - - 2 - - 1 46 55 38 63 1
La. - - - 1 3 3 98 137 - 39 -
Okla. 1 1 - - 1 2 14 41 U 55 64
Tex. 3 - 1 1 5 - 89 198 U 568 -
MOUNTAIN 20 16 1 2 16 23 69 55 89 137 48
Mont. 1 1 - - - 2 - - 2 2 16
Idaho - 1 - - 1 - - - 3 4 -
Wyo. 1 1 - - - 1 - - 1 1 29
Colo. 4 4 - - 6 10 4 2 U 27 -
N. Mex. 2 - - - 6 4 - - 7 6 -
Ariz. 3 4 - 1 2 3 60 45 57 65 3
Utah 8 4 - - 1 - 3 2 19 4 -
Nev. 1 1 1 1 - 3 2 6 U 28 -
PACIFIC 33 15 35 15 68 117 116 119 951 1,209 134
Wash. 3 3 1 - 6 4 6 5 U 99 -
Oreg. - - 3 7 7 7 2 3 U 42 -
Calif. 30 11 31 8 54 104 108 110 886 963 121
Alaska - - - - - 2 - - 12 31 13
Hawaii - 1 - - 1 - - 1 53 74 -
Guam - - - - - - - 3 - 13 -
P.R. - - - - - 3 74 71 - - 23
V.I. - - - - - - - - - - -
Amer. Samoa - - - - - - - - - - -
C.N.M.I. - - - - - - 1 4 8 - -
-------------------------------------------------------------------------------------------------------------------------------------------
N: Not notifiable U: Unavailable -: no reported cases
* Additional information about areas displaying 'U' for cumulative Tuberculosis cases can be found in Notices to Readers, MMWR Vol. 47, No. 2, p. 39.
=======================================================================================================================================================
Return to top. Table_III Note: To print large tables and graphs users may have to change their printer settings to landscape and use a small font size.
TABLE III. (page 1) Provisional cases of selected notifiable diseases preventable by vaccination, United
States, weeks ending May 2, 1998, and April 26, 1997 (17th Week)
Hepatitis (Viral), by type Measles (Rubeola)
H. influenzae, --------------------------------------- ------------------------------------------------------------
invasive A B Indigenous Imported** Total
---------------- ----------------- ----------------- --------------- --------------- ---------------
Cum. Cum. Cum. Cum. Cum. Cum. Cum. Cum. Cum. Cum.
Reporting Area 1998* 1997 1998 1997 1998 1997 1998 1998 1998 1998 1998 1997
-----------------------------------------------------------------------------------------------------------------------------------------------------
UNITED STATES 372 394 6,600 8,678 2,362 2,851 - 3 - 10 13 33
NEW ENGLAND 20 22 94 215 25 62 - - - 1 1 -
Maine 2 2 10 22 - 3 - - - - - -
N.H. 1 3 6 10 5 5 - - - - - -
Vt. 2 - 7 5 - 1 - - - - - -
Mass. 13 15 21 113 11 32 - - - 1 1 -
R.I. 2 1 7 15 9 6 - - - - - -
Conn. - 1 43 50 - 15 - - - - - -
MID. ATLANTIC 51 49 405 789 347 443 - - - 1 1 11
Upstate N.Y. 18 2 118 88 104 70 - - - - - 4
N.Y. City 10 18 110 380 86 184 - - - - - 5
N.J. 21 18 84 127 60 86 - - - - - 1
Pa. 2 11 93 194 97 103 - - - 1 1 1
E.N. CENTRAL 53 62 805 1,110 240 559 - - - 2 2 6
Ohio 27 31 122 153 26 33 - - - - - -
Ind. 9 5 66 100 20 38 U - U 1 1 -
Ill. 16 17 123 282 38 110 - - - - - 5
Mich. - 9 445 502 150 175 - - - 1 1 1
Wis. 1 - 49 73 6 203 - - - - - -
W.N. CENTRAL 29 22 611 620 110 185 - - - - - 2
Minn. 17 13 28 47 11 9 - - - - - 1
Iowa 1 2 292 78 16 11 - - - - - -
Mo. 7 3 232 356 66 143 - - - - - 1
N. Dak. - - 2 6 2 1 - - - - - -
S. Dak. - 2 3 6 1 - - - - - - -
Nebr. - 1 13 22 4 7 - - - - - -
Kans. 4 1 41 105 10 14 - - - - - -
S. ATLANTIC 84 73 594 455 347 360 - 1 - 5 6 2
Del. - - 1 10 - 2 - - - 1 1 -
Md. 21 28 125 110 45 62 - - - 1 1 1
D.C. - - 23 13 6 18 - - - - - 1
Va. 11 5 91 58 32 38 - - - 2 2 -
W. Va. 2 2 - 5 2 6 - - - - - -
N.C. 10 12 33 65 77 73 - - - - - -
S.C. 1 3 12 38 - 36 - - - - - -
Ga. 18 16 116 43 59 38 - - - 1 1 -
Fla. 21 7 193 113 126 87 - 1 - - 1 -
E.S. CENTRAL 20 22 123 224 147 206 - - - - - 1
Ky. 3 4 5 28 11 12 - - - - - -
Tenn. 12 12 86 129 111 129 - - - - - -
Ala. 5 6 32 37 25 28 - - - - - 1
Miss. - - - 30 - 37 U - U - - -
W.S. CENTRAL 23 18 1,051 1,254 334 173 - - - - - 2
Ark. - 1 17 86 21 19 - - - - - -
La. 11 2 12 70 8 40 - - - - - -
Okla. 11 13 180 560 16 9 - - - - - -
Tex. 1 2 842 538 289 105 - - - - - 2
MOUNTAIN 55 41 1,124 1,377 282 292 - - - - - -
Mont. - - 16 39 3 3 - - - - - -
Idaho - - 85 62 13 8 - - - - - -
Wyo. - 1 21 15 7 8 - - - - - -
Colo. 11 5 87 163 35 58 - - - - - -
N. Mex. 3 2 70 96 111 101 - - - - - -
Ariz. 31 12 712 620 68 60 - - - - - -
Utah 4 3 70 267 23 36 - - - - - -
Nev. 6 18 63 115 22 18 - - - - - -
PACIFIC 37 85 1,793 2,634 530 571 - 2 - 1 3 9
Wash. 1 1 338 186 42 18 - - - - - -
Oreg. 23 16 134 132 44 40 - - - - - -
Calif. 10 65 1,299 2,246 437 499 - 2 - 1 3 6
Alaska 1 1 3 15 2 10 - - - - - -
Hawaii 2 2 19 55 5 4 - - - - - 3
Guam - - - - - 1 U - U - - -
P.R. 2 - 12 115 208 405 - - - - - -
V.I. - - - - - - U - U - - -
Amer. Samoa - - - - - - U - U - - -
C.N.M.I. - 4 - 1 7 19 U - U - - 1
-----------------------------------------------------------------------------------------------------------------------------------------------------
N: Not notifiable U: Unavailable -: no reported cases
* Of 89 cases among children aged <5 years, serotype was reported for 46 and of those, 23 were type b.
** For imported measles, cases include only those resulting from importation from other countries.
=======================================================================================================================================================
TABLE III. (page 2) Provisional cases of selected notifiable diseases preventable by vaccination, United
States, weeks ending May 2, 1998, and April 26, 1997 (17th Week)
Meningococcal
Disease Mumps Pertussis Rubella
----------------- -------------------------- --------------------------- ---------------------------
Cum. Cum. Cum. Cum. Cum. Cum. Cum. Cum.
Reporting Area 1998 1997 1998 1998 1997 1998 1998 1997 1998 1998 1997
------------------------------------------------------------------------------------------------------------------------------------------
UNITED STATES 1,026 1,403 4 153 204 40 1,204 1,770 2 161 21
NEW ENGLAND 54 87 - - 7 - 207 430 - 24 -
Maine 4 8 - - - - 5 6 - - -
N.H. 1 9 - - - - 19 48 - - -
Vt. 1 2 - - - - 22 145 - - -
Mass. 26 50 - - 2 - 156 214 - 2 -
R.I. 3 4 - - 4 - - 12 - - -
Conn. 19 14 - - 1 - 5 5 - 22 -
MID. ATLANTIC 111 137 - 6 27 3 148 149 - 79 8
Upstate N.Y. 28 30 - 3 4 3 91 56 - 79 1
N.Y. City 12 23 - - 1 - - 37 - - 7
N.J. 32 27 - - 4 - - 9 - - -
Pa. 39 57 - 3 18 - 57 47 - - -
E.N. CENTRAL 141 205 - 22 29 8 137 188 - - 3
Ohio 58 75 - 11 8 4 53 55 - - -
Ind. 25 22 U 2 4 U 40 19 U - -
Ill. 29 68 - 1 9 3 10 25 - - -
Mich. 14 19 - 8 7 1 17 26 - - -
Wis. 15 21 - - 1 - 17 63 - - 3
W.N. CENTRAL 91 106 - 16 7 3 90 97 - 1 -
Minn. 16 14 - 9 3 3 58 59 - - -
Iowa 13 22 - 5 3 - 16 7 - - -
Mo. 37 53 - 1 - - 9 14 - 1 -
N. Dak. - - - 1 - - - 2 - - -
S. Dak. 5 3 - - - - 4 1 - - -
Nebr. 4 4 - - 1 - 3 2 - - -
Kans. 16 10 - - - - - 12 - - -
S. ATLANTIC 188 241 3 28 26 4 95 159 1 5 1
Del. 1 4 - - - - - - - - -
Md. 16 26 - - 4 - 18 65 - - -
D.C. - 5 - - - - 1 2 - - -
Va. 18 22 - 4 2 - 6 17 - - 1
W. Va. 4 9 - - - - 1 3 - - -
N.C. 24 40 - 6 6 - 40 34 - 3 -
S.C. 31 33 - 3 4 1 10 8 - 1 -
Ga. 40 44 1 1 2 1 1 2 - - -
Fla. 54 58 2 14 8 2 18 28 1 1 -
E.S. CENTRAL 74 96 - - 11 1 33 37 - - -
Ky. 12 24 - - - - 15 10 - - -
Tenn. 32 30 - - 3 1 8 12 - - -
Ala. 30 27 - - 4 - 10 9 - - -
Miss. - 15 U - 4 U - 6 U - -
W.S. CENTRAL 75 114 - 22 24 6 62 35 - 37 1
Ark. 14 21 - - - 1 8 2 - - -
La. 22 28 - 1 6 - - 7 - - -
Okla. 21 13 - - - - 6 5 - - -
Tex. 18 52 - 21 18 5 48 21 - 37 1
MOUNTAIN 67 85 1 14 10 10 276 421 - 5 -
Mont. 2 4 - - - - 1 2 - - -
Idaho 3 5 1 1 2 5 129 288 - - -
Wyo. 3 - - 1 1 - 7 3 - - -
Colo. 16 26 - 2 2 - 43 102 - - -
N. Mex. 12 15 N N N 5 54 12 - 1 -
Ariz. 22 16 - 4 - - 22 9 - 1 -
Utah 6 10 - 1 2 - 13 1 - 2 -
Nev. 3 9 - 5 3 - 7 4 - 1 -
PACIFIC 225 332 - 45 63 5 156 254 1 10 8
Wash. 26 36 - 4 5 5 86 117 1 8 -
Oreg. 44 68 N N N - 8 9 - - -
Calif. 150 225 - 28 45 - 58 122 - 1 4
Alaska 1 1 - 2 3 - - 2 - - -
Hawaii 4 2 - 11 10 - 4 4 - 1 4
Guam - 1 U - 1 U - - U - -
P.R. 1 6 - 2 4 - 2 - - - -
V.I. - - U - - U - - U - -
Amer. Samoa - - U - - U - - U - -
C.N.M.I. - - U - 1 U - - U - -
------------------------------------------------------------------------------------------------------------------------------------------
N: Not notifiable U: Unavailable -: no reported cases
=======================================================================================================================================================
Return to top. Table_IV Note: To print large tables and graphs users may have to change their printer settings to landscape and use a small font size.
TABLE IV. Deaths in 122 U.S. cities,* week ending
May 2, 1998 (17th Week)
===================================================================================================================================
All Causes, By Age (Years)
------------------------------------------------------------------------ P&I**
Reporting Area All Ages >=65 45-64 25-44 1-24 <1 Total
---------------------------------------------------------------------------------------------------------------
NEW ENGLAND 547 397 102 36 6 6 41
Boston, Mass. 154 104 39 10 1 - 19
Bridgeport, Conn. 46 36 3 7 - - 1
Cambridge, Mass. 11 11 - - - - 2
Fall River, Mass. 22 18 3 1 - - 3
Hartford, Conn. 57 42 10 3 2 - 1
Lowell, Mass. 19 14 4 1 - - 1
Lynn, Mass. 17 14 2 1 - - -
New Bedford, Mass. 29 22 2 4 1 - -
New Haven, Conn. 40 29 4 2 1 4 3
Providence, R.I. 36 23 9 4 - - 2
Somerville, Mass. 6 6 - - - - -
Springfield, Mass. 29 18 9 2 - - 2
Waterbury, Conn. 26 18 6 - 1 1 1
Worcester, Mass. 55 42 11 1 - 1 6
MID. ATLANTIC 2,157 1,477 432 169 40 39 110
Albany, N.Y. 45 30 8 4 - 3 3
Allentown, Pa. 21 20 1 - - - -
Buffalo, N.Y. 74 57 12 3 2 - 6
Camden, N.J. 29 17 3 3 3 3 2
Elizabeth, N.J. 22 19 1 2 - - -
Erie, Pa. 30 25 3 1 - 1 3
Jersey City, N.J. 42 32 8 2 - - 3
New York City, N.Y. 1,081 732 230 84 16 19 45
Newark, N.J. 37 9 16 6 3 3 2
Paterson, N.J. 38 20 11 5 1 1 -
Philadelphia, Pa. 335 219 72 30 13 1 16
Pittsburgh, Pa.*** 86 57 20 7 - 2 4
Reading, Pa. 26 23 1 2 - - 4
Rochester, N.Y. 118 89 16 8 2 3 13
Schenectady, N.Y. 24 21 2 1 - - 2
Scranton, Pa. 27 23 3 1 - - -
Syracuse, N.Y. 78 55 17 3 - 3 6
Trenton, N.J. 26 16 4 6 - - 1
Utica, N.Y. 18 13 4 1 - - -
Yonkers, N.Y. U U U U U U U
E.N. CENTRAL 2,014 1,383 375 158 49 49 111
Akron, Ohio 45 29 8 5 2 1 1
Canton, Ohio 30 25 3 2 - - 3
Chicago, Ill. 454 287 92 54 13 8 39
Cincinnati, Ohio 95 64 21 3 3 4 8
Cleveland, Ohio 139 83 31 14 5 6 -
Columbus, Ohio 186 128 37 12 1 8 21
Dayton, Ohio 130 95 23 3 5 4 4
Detroit, Mich. 196 126 44 19 4 3 4
Evansville, Ind. 49 33 12 4 - - 3
Fort Wayne, Ind. 59 45 7 3 2 2 6
Gary, Ind. 12 7 1 1 2 1 -
Grand Rapids, Mich. 51 41 6 1 1 2 2
Indianapolis, Ind. 191 134 36 15 3 3 -
Lansing, Mich. 36 27 4 2 3 - 3
Milwaukee, Wis. 129 100 22 5 - 2 5
Peoria, Ill. 44 34 6 3 - 1 5
Rockford, Ill. 49 41 6 1 1 - 1
South Bend, Ind. 46 31 9 3 1 2 2
Toledo, Ohio U U U U U U U
Youngstown, Ohio 73 53 7 8 3 2 4
W.N. CENTRAL 815 580 133 47 16 23 71
Des Moines, Iowa U U U U U U U
Duluth, Minn. 29 27 1 - - 1 4
Kansas City, Kans. 38 23 8 2 5 - -
Kansas City, Mo. 147 95 24 8 2 2 7
Lincoln, Nebr. 43 29 7 3 2 2 2
Minneapolis, Minn. 186 136 36 10 1 3 24
Omaha, Nebr. 92 67 11 6 1 7 4
St. Louis, Mo. 90 69 13 4 - 4 14
St. Paul, Minn. 79 63 10 3 3 - 12
Wichita, Kans. 111 71 23 11 2 4 4
S. ATLANTIC 1,130 722 245 107 30 23 79
Atlanta, Ga. U U U U U U U
Baltimore, Md. 190 105 43 32 4 4 17
Charlotte, N.C. 102 72 16 8 3 3 11
Jacksonville, Fla. 135 90 28 12 3 2 5
Miami, Fla. 114 72 28 8 5 1 -
Norfolk, Va. 53 31 9 8 1 4 1
Richmond, Va. 70 51 14 2 2 1 2
Savannah, Ga. 38 22 11 2 2 1 3
St. Petersburg, Fla. 98 73 16 4 2 3 11
Tampa, Fla. 157 111 32 10 3 1 22
Washington, D.C. 160 92 42 18 5 3 7
Wilmington, Del. 13 3 6 3 - - -
E.S. CENTRAL 912 577 183 89 36 25 45
Birmingham, Ala. 212 145 47 13 3 2 9
Chattanooga, Tenn. 73 54 9 5 2 3 4
Knoxville, Tenn. 85 61 19 5 - - 11
Lexington, Ky. 55 33 14 6 - 2 6
Memphis, Tenn. 176 117 29 13 10 7 6
Mobile, Ala. 109 67 29 7 2 4 -
Montgomery, Ala. 49 35 7 4 3 - 5
Nashville, Tenn. 153 65 29 36 16 7 4
W.S. CENTRAL 1,506 983 311 120 60 32 112
Austin, Tex. 71 45 15 7 2 2 4
Baton Rouge, La. 40 27 9 4 - - 1
Corpus Christi, Tex. 67 49 10 7 1 - 4
Dallas, Tex. 161 92 49 13 5 2 2
El Paso, Tex. 92 60 18 11 - 3 11
Ft. Worth, Tex. 108 82 16 8 2 - 16
Houston, Tex. 321 192 80 29 12 8 32
Little Rock, Ark. 80 54 14 4 3 5 5
New Orleans, La. 116 64 20 12 18 2 -
San Antonio, Tex. 270 189 52 14 12 3 21
Shreveport, La. 54 36 12 4 1 1 4
Tulsa, Okla. 126 93 16 7 4 6 12
MOUNTAIN 917 625 161 83 31 16 62
Albuquerque, N.M. 157 99 33 19 6 - 4
Boise, Idaho 26 21 3 1 - 1 1
Colo. Springs, Colo. 52 35 6 5 4 2 6
Denver, Colo. 105 64 20 14 5 2 8
Las Vegas, Nev. 233 155 50 20 6 2 13
Ogden, Utah 24 19 4 1 - - 4
Phoenix, Ariz. 76 54 11 7 3 - 3
Pueblo, Colo. 11 9 2 - - - -
Salt Lake City, Utah 101 73 13 8 2 5 11
Tucson, Ariz. 132 96 19 8 5 4 12
PACIFIC 1,554 1,101 281 110 36 26 132
Berkeley, Calif. 16 8 6 1 - 1 1
Fresno, Calif. 117 75 19 14 4 5 13
Glendale, Calif. 28 24 3 - - 1 3
Honolulu, Hawaii 70 56 8 5 1 - 9
Long Beach, Calif. 88 62 14 10 2 - 12
Los Angeles, Calif. 466 325 88 34 12 7 27
Pasadena, Calif. 23 15 5 2 - 1 4
Portland, Oreg. U U U U U U U
Sacramento, Calif. U U U U U U U
San Diego, Calif. 149 111 24 8 3 3 16
San Francisco, Calif. 123 86 22 13 1 1 19
San Jose, Calif. 142 112 21 4 3 2 12
Santa Cruz, Calif. 28 17 6 2 2 1 1
Seattle, Wash. 130 90 26 10 1 3 2
Spokane, Wash. 80 60 14 1 5 - 6
Tacoma, Wash. 94 60 25 6 2 1 7
TOTAL 11,552**** 7,845 2,223 919 304 239 763
---------------------------------------------------------------------------------------------------------------
U: Unavailable -: no reported cases
* Mortality data in this table are voluntarily reported from 122 cities in the United States, most of which have populations
of 100,000 or more. A death is reported by the place of its occurrence and by the week that the death certificate was
filed. Fetal deaths are not included.
** Pneumonia and influenza.
*** Because of changes in reporting methods in this Pennsylvania city, these numbers are partial counts for the current
week. Complete counts will be available in 4 to 6 weeks.
**** Total includes unknown ages.
===================================================================================================================================
Return to top. Disclaimer All MMWR HTML versions of articles are electronic conversions from ASCII text into HTML. This conversion may have resulted in character translation or format errors in the HTML version. Users should not rely on this HTML document, but are referred to the electronic PDF version and/or the original MMWR paper copy for the official text, figures, and tables. An original paper copy of this issue can be obtained from the Superintendent of Documents, U.S. Government Printing Office (GPO), Washington, DC 20402-9371; telephone: (202) 512-1800. Contact GPO for current prices. **Questions or messages regarding errors in formatting should be addressed to mmwrq@cdc.gov.Page converted: 10/05/98 |
|||||||||
This page last reviewed 5/2/01
|