 |
|
|
|
|
|
|
| ||||||||||
|
|
|
|
|
|
|
||||
| ||||||||||
|
|
|
|
|
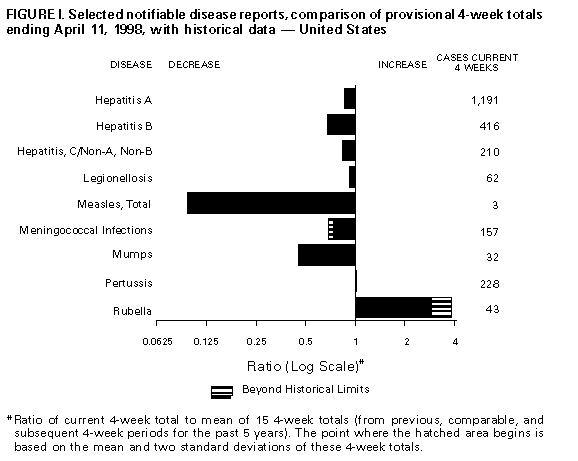
Persons using assistive technology might not be able to fully access information in this file. For assistance, please send e-mail to: mmwrq@cdc.gov. Type 508 Accommodation and the title of the report in the subject line of e-mail. Notifiable Diseases/Deaths in Selected Cities Weekly InformationFigure_I Selected notifiable disease reports, comparison of provisional 4-week totals ending April 11, 1998, with historical data -- United States Table_I Summary -- provisional cases of selected notifiable diseases, United States, cumulative, week ending April 11, 1998 (14th Week) Table_II Provisional cases of selected notifiable diseases, United States, weeks ending April 11, 1998 and April 5, 1997 (14th Week) Table_III Provisional cases of selected notifiable diseases preventable by vaccination, United States, weeks ending April 11, 1998 and April 5, 1997 (14th Week) Table_IV Deaths in 122 U.S. cities, week ending
April 11, 1998 (14th Week)
TABLE I. Summary -- provisional cases of specified notifiable diseases, United
States, cumulative, week ending April 11, 1998 (14th Week)
==================================================================================
                                             Cum. 1998
------------------------------------------------------
Anthrax                                              -
Brucellosis                                          4
Cholera                                              -
Congenital rubella syndrome                          1
Cryptosporidiosis*                                 474
Diphtheria                                           -
Encephalitis:  California*                           -
               eastern equine*                       -
               St. Louis*                            -
               western equine*                       -
Hansen Disease                                      28
Hantavirus pulmonary syndrome*+                      -
Hemolytic uremic syndrome, post-diarrheal*           4
HIV infection, pediatric*&                          72
Plague                                               -
Poliomyelitis, paralytic@                            -
Psittacosis                                         11
Rabies, human                                        -
Rocky Mountain spotted fever (RMSF)                 15
Streptococcal disease, invasive Group A            500
Streptococcal toxic-shock syndrome*                 18
Syphilis, congenital**                              10
Tetanus                                              3
Toxic-shock syndrome                                30
Trichinosis                                          1
Typhoid fever                                       75
Yellow fever                                         -
------------------------------------------------------
-: no reported cases
 * Not notifiable in all states
 + Updated weekly from reports to the Division of Viral and Rickettsial
   Diseases, National Center for Infectious Diseases (NCID).
 & Updated monthly to the Division of HIV/AIDS Prevention -- Surveillance
   and Epidemiology, National Center for HIV, STD, and TB Prevention
   (NCHSTP), last update March 29, 1998.
 @ One suspected case(s) of polio with onset in 1998 have also been reported
   to date.
** Updated from reports to the Division of STD Prevention, NCHSTP.

==================================================================================
Return to top. Table_II Note: To print large tables and graphs users may have to change their printer settings to landscape and use a small font size.
TABLE II. (page 1) Provisional cases of selected notifiable diseases, United States, weeks ending
April 11, 1998, and April 5, 1997 (14th Week)
Escherichia
coli O157:H7
------------------- Hepatitis
AIDS* Chlamydia NETSS** PHLIS*** Gonorrhea C\NA,NB
----------------- -------------------- -------- -------- ------------------- ----------------
Cum. Cum. Cum. Cum. Cum. Cum. Cum. Cum. Cum. Cum.
Reporting Area 1998 1997 1998 1997 1998 1998 1998 1997 1998 1997
------------------------------------------------------------------------------------------------------------------------------
UNITED STATES 12,103 16,345 130,526 119,480 196 82 79,081 73,891 839 734
NEW ENGLAND 320 461 4,982 4,731 23 11 1,277 1,630 10 20
Maine 8 18 249 252 1 - 13 13 - -
N.H. 13 4 253 208 5 2 27 43 - 2
Vt. 8 10 92 117 - - 2 15 - 1
Mass. 98 217 2,380 1,943 9 9 571 630 10 17
R.I. 32 43 662 573 3 - 88 145 - -
Conn. 161 169 1,346 1,638 5 - 576 784 - -
MID. ATLANTIC 3,425 5,157 16,404 15,003 14 5 9,332 9,500 106 68
Upstate N.Y. 425 845 N N 11 - 1,271 1,625 90 50
N.Y. City 1,936 2,636 8,925 8,039 - 3 4,074 3,852 - -
N.J. 580 1,109 1,971 2,794 3 2 1,527 1,914 - -
Pa. 484 567 5,508 4,170 N - 2,460 2,109 16 18
E.N. CENTRAL 995 1,213 22,002 19,224 34 9 15,446 11,304 118 182
Ohio 169 251 6,429 6,045 12 - 3,867 3,796 5 5
Ind. 261 283 2,499 2,368 6 3 1,630 1,660 3 3
Ill. 376 369 6,154 2,982 10 - 5,095 1,551 5 24
Mich. 143 248 5,392 4,855 6 2 4,294 3,091 105 140
Wis. 46 62 1,528 2,974 N 4 560 1,206 - 10
W.N. CENTRAL 215 367 8,411 8,343 24 12 3,784 3,425 83 37
Minn. 32 54 1,521 2,021 9 6 526 675 - -
Iowa 11 51 1,088 1,245 2 - 306 314 8 8
Mo. 101 194 3,213 3,059 4 5 2,023 1,750 73 21
N. Dak. 3 3 215 264 1 1 18 17 - 2
S. Dak. 7 2 442 291 - - 75 31 - -
Nebr. 26 28 789 441 3 - 314 157 - 1
Kans. 35 35 1,143 1,022 5 - 522 481 2 5
S. ATLANTIC 3,235 4,175 27,813 22,196 23 9 22,657 22,237 44 51
Del. 40 51 664 - - 1 380 286 - -
Md. 334 435 2,252 1,849 9 4 2,489 3,407 3 5
D.C. 266 244 N N - - 958 1,234 - -
Va. 231 325 2,945 2,988 N 4 1,947 2,317 1 4
W. Va. 30 21 757 902 N - 193 264 2 1
N.C. 217 218 6,164 4,804 7 - 5,160 4,393 7 17
S.C. 187 211 4,876 3,331 1 - 3,142 2,961 - 12
Ga. 371 529 5,768 2,070 2 - 4,919 2,939 8 -
Fla. 1,559 2,141 4,387 6,252 4 - 3,469 4,436 23 12
E.S. CENTRAL 444 472 10,706 8,695 15 3 10,255 8,936 28 89
Ky. 65 48 1,693 1,703 2 - 987 1,149 - 5
Tenn. 144 200 3,488 3,145 9 3 2,952 2,725 25 47
Ala. 119 129 2,794 2,148 4 - 3,543 2,988 3 5
Miss. 116 95 2,731 1,699 - - 2,773 2,074 - 32
W.S. CENTRAL 1,370 1,463 15,785 14,516 2 - 10,009 9,820 9 62
Ark. 52 58 979 648 1 - 1,087 1,151 - 1
La. 212 239 3,144 1,798 - - 2,702 1,781 - 44
Okla. 71 86 2,425 2,061 1 - 1,352 1,351 - 2
Tex. 1,035 1,080 9,237 10,009 - - 4,868 5,537 9 15
MOUNTAIN 389 461 5,010 6,461 15 9 1,884 2,058 225 85
Mont. 10 12 256 212 1 - 15 13 4 3
Idaho 8 8 486 417 2 - 42 33 68 14
Wyo. 1 9 197 121 - - 11 16 101 29
Colo. 65 128 - 906 2 1 699 548 10 13
N. Mex. 55 35 1,095 1,051 5 3 192 346 20 14
Ariz. 128 122 2,427 2,577 N 2 833 832 - 7
Utah 35 35 409 399 3 1 44 47 11 2
Nev. 87 112 140 778 2 2 48 223 11 3
PACIFIC 1,710 2,576 19,413 20,311 46 24 4,437 4,981 216 140
Wash. 137 175 2,975 2,503 11 11 504 585 5 7
Oreg. 40 97 1,543 1,291 10 8 228 183 2 1
Calif. 1,499 2,269 13,961 15,741 25 3 3,540 3,964 174 86
Alaska 11 18 553 364 - - 84 131 1 -
Hawaii 23 17 381 412 N 2 81 118 34 46
Guam - 2 8 123 N - 2 15 - -
P.R. 460 419 U U 1 U 85 165 1 20
V.I. 13 16 N N N U - - - -
Amer. Samoa - - - - N U - - - -
C.N.M.I. - - N N N U 7 10 - 2
------------------------------------------------------------------------------------------------------------------------------
N: Not notifiable U: Unavailable -: no reported cases C.N.M.I.: Commonwealth of North Mariana Islands
* Updated monthly to the Division of HIV/AIDS Prevention, -- Surveillance and Epidemiology, National Center for HIV, STD,
and TB Prevention, last update March 29, 1998.
** National Electronic Telecommunications System for Surveillance.
*** Public Health Laboratory Information System.
=======================================================================================================================================================
TABLE II. (page 2) Provisional cases of selected notifiable diseases, United States, weeks ending
April 11, 1998, and April 5, 1997 (14th Week)
Lyme Syphilis Rabies,
Legionellosis Disease Malaria (Primary & Secondary) Tuberculosis Animal
---------------- ---------------- ---------------- --------------------- ----------------- -------
Cum. Cum. Cum. Cum. Cum. Cum. Cum. Cum. Cum. Cum. Cum.
Reporting Area 1998 1997 1998 1997 1998 1997 1998 1997 1998 * 1997 1998
-------------------------------------------------------------------------------------------------------------------------------------------
UNITED STATES 252 227 884 832 262 327 1,805 2,338 1,419 3,854 1,840
NEW ENGLAND 11 18 140 176 11 12 20 40 58 93 349
Maine 1 1 - 1 1 - 1 - U 10 58
N.H. 2 2 5 4 1 1 - - 2 1 32
Vt. 1 3 2 2 - 1 - - 1 - 15
Mass. 3 7 40 30 9 9 17 18 43 46 98
R.I. 4 1 16 24 - 1 - - 12 7 27
Conn. - 4 77 115 - - 2 22 U 29 119
MID. ATLANTIC 56 37 561 539 71 78 60 106 118 652 420
Upstate N.Y. 16 7 328 55 23 11 3 14 U 73 283
N.Y. City 6 1 - 40 32 46 9 18 U 356 U
N.J. 2 5 3 126 8 15 14 53 118 142 55
Pa. 32 24 230 318 8 6 34 21 U 81 82
E.N. CENTRAL 85 96 22 10 16 31 255 203 74 409 14
Ohio 43 47 21 5 1 2 52 69 5 90 14
Ind. 15 12 1 4 1 4 49 47 U 37 -
Ill. 5 4 - 1 5 12 104 18 69 200 -
Mich. 17 24 - - 8 11 38 22 U 56 -
Wis. 5 9 U U 1 2 12 47 U 26 -
W.N. CENTRAL 18 17 6 2 15 8 44 54 52 108 147
Minn. 1 - 1 - 8 3 - 13 U 34 29
Iowa 1 1 4 - 2 2 - 2 U 10 33
Mo. 8 7 - 1 3 3 34 26 47 40 9
N. Dak. - 1 - - - - - - U 2 39
S. Dak. - 1 - - - - - - 4 2 14
Nebr. 6 5 - 1 - - 4 - - - -
Kans. 2 2 1 - 2 - 6 13 U 20 23
S. ATLANTIC 44 23 112 74 68 69 746 926 260 612 646
Del. 6 3 - 13 1 2 7 7 - 8 17
Md. 8 10 94 51 23 23 174 270 65 57 144
D.C. 3 1 4 4 3 5 26 32 27 21 -
Va. 3 1 3 - 7 16 52 81 53 86 182
W. Va. N N 2 - - - - 2 17 13 25
N.C. 4 3 1 2 7 5 218 194 98 89 136
S.C. 4 2 - 1 - 3 85 106 U 64 34
Ga. - - 2 1 12 9 122 167 U 112 43
Fla. 16 3 6 2 15 6 62 67 U 162 65
E.S. CENTRAL 4 8 10 17 7 7 335 524 - 288 68
Ky. 1 - - 1 - 1 38 43 U 42 12
Tenn. 3 3 5 3 4 2 163 212 U 108 37
Ala. - 2 5 2 3 1 73 134 U 89 19
Miss. - 3 - 11 - 3 61 135 U 49 -
W.S. CENTRAL - 1 - 2 3 5 193 353 22 567 52
Ark. - - - - - 1 38 43 22 45 1
La. - - - 1 3 3 87 119 - 22 -
Okla. - 1 - - - 1 13 32 U 44 51
Tex. - - - 1 - - 55 159 U 456 -
MOUNTAIN 15 15 1 - 15 17 57 40 68 110 41
Mont. 1 1 - - - 1 - - 2 2 15
Idaho - 1 - - 1 - - - 2 1 -
Wyo. 1 1 - - - 1 - - 1 1 25
Colo. 4 4 - - 5 9 4 - U 20 -
N. Mex. 1 - - - 6 2 - - 7 5 -
Ariz. 1 3 - - 2 1 50 33 39 49 1
Utah 6 4 - - 1 - 2 1 17 4 -
Nev. 1 1 1 - - 3 1 6 U 28 -
PACIFIC 19 12 32 12 56 100 95 92 767 1,015 103
Wash. 1 2 1 - 1 2 4 5 U 75 -
Oreg. - - 1 5 6 7 2 1 U 31 -
Calif. 18 9 30 7 49 90 89 85 715 826 93
Alaska - - - - - 1 - - 11 26 10
Hawaii - 1 - - - - - 1 41 57 -
Guam - - - - - - - 2 - 13 -
P.R. - - - - - 3 75 59 - - 20
V.I. - - - - - - - - - - -
Amer. Samoa - - - - - - - - - - -
C.N.M.I. - - - - - - 1 2 8 - -
-------------------------------------------------------------------------------------------------------------------------------------------
N: Not notifiable U: Unavailable -: no reported cases
* Additional information about areas displaying 'U' for cumulative Tuberculosis cases can be found in Notices to Readers, MMWR Vol. 47, No. 2, p. 39.
=======================================================================================================================================================
Return to top. Table_III Note: To print large tables and graphs users may have to change their printer settings to landscape and use a small font size.
TABLE III. (page 1) Provisional cases of selected notifiable diseases preventable by vaccination, United
States, weeks ending April 11, 1998, and April 5, 1997 (14th Week)
Hepatitis (Viral), by type Measles (Rubeola)
H. influenzae, --------------------------------------- ------------------------------------------------------------
invasive A B Indigenous Imported** Total
---------------- ----------------- ----------------- --------------- --------------- ---------------
Cum. Cum. Cum. Cum. Cum. Cum. Cum. Cum. Cum. Cum.
Reporting Area 1998* 1997 1998 1997 1998 1997 1998 1998 1998 1998 1998 1997
-----------------------------------------------------------------------------------------------------------------------------------------------------
UNITED STATES 286 322 4,566 7,147 1,686 2,301 - 1 - 7 8 21
NEW ENGLAND 15 19 85 170 13 52 - - - 1 1 -
Maine 2 2 10 12 - 3 - - - - - -
N.H. 1 2 6 8 4 4 - - - - - -
Vt. 2 - 6 4 - 1 - - - - - -
Mass. 10 14 17 94 6 29 - - - 1 1 -
R.I. - 1 6 11 3 4 - - - - - -
Conn. - - 40 41 - 11 - - - - - -
MID. ATLANTIC 39 43 250 643 226 356 - - - 1 1 9
Upstate N.Y. 16 1 94 50 82 54 - - - - - 3
N.Y. City 7 18 67 336 51 152 U - U - - 4
N.J. 15 14 2 102 - 72 - - - - - 1
Pa. 1 10 87 155 93 78 - - - 1 1 1
E.N. CENTRAL 44 49 650 931 199 469 - - - 1 1 4
Ohio 22 24 105 131 22 28 - - - - - -
Ind. 5 4 66 82 20 29 - - - - - -
Ill. 16 15 92 252 29 94 - - - - - 3
Mich. - 6 361 404 124 146 - - - 1 1 1
Wis. 1 - 26 62 4 172 - - - - - -
W.N. CENTRAL 14 9 510 501 101 152 - - - - - 1
Minn. 5 2 20 27 7 3 - - - - - -
Iowa 1 2 237 70 14 7 - - - - - -
Mo. 4 2 199 290 65 126 - - - - - 1
N. Dak. - - 2 5 1 - - - - - - -
S. Dak. - 2 2 6 1 - - - - - - -
Nebr. - - 11 17 2 7 - - - - - -
Kans. 4 1 39 86 11 9 U - U - - -
S. ATLANTIC 73 63 493 393 277 259 - 1 - 4 5 -
Del. - - - 10 - 1 - - - - - -
Md. 17 24 107 99 38 45 - - - 1 1 -
D.C. - - 15 11 3 18 - - - - - -
Va. 9 4 78 47 28 27 - - - 2 2 -
W. Va. 2 2 - 5 1 6 - - - - - -
N.C. 8 10 28 56 69 63 - - - - - -
S.C. 1 3 8 31 - 20 - - - - - -
Ga. 17 15 111 39 59 14 - - - 1 1 -
Fla. 19 5 146 95 79 65 - 1 - - 1 -
E.S. CENTRAL 15 16 107 168 126 164 - - - - - 1
Ky. - 3 - 25 - 10 - - - - - -
Tenn. 10 10 76 80 101 104 - - - - - -
Ala. 5 3 31 35 25 21 - - - - - 1
Miss. - - - 28 - 29 - - - - - -
W.S. CENTRAL 16 15 257 1,053 90 149 - - - - - -
Ark. - 1 14 62 19 17 - - - - - -
La. 7 1 8 54 8 34 U - U - - -
Okla. 8 11 126 460 14 9 - - - - - -
Tex. 1 2 109 477 49 89 - - - - - -
MOUNTAIN 48 38 913 1,127 225 231 - - - - - -
Mont. - - 9 34 2 1 - - - - - -
Idaho - - 60 53 9 7 - - - - - -
Wyo. - 1 16 14 5 6 - - - - - -
Colo. 10 5 72 136 30 47 - - - - - -
N. Mex. - 2 50 71 89 79 - - - - - -
Ariz. 30 12 602 492 55 46 - - - - - -
Utah 4 3 55 238 19 30 - - - - - -
Nev. 4 15 49 89 16 15 U - U - - -
PACIFIC 22 70 1,301 2,161 429 469 - - - - - 6
Wash. 1 1 193 151 35 16 - - - - - -
Oreg. 19 13 103 118 35 35 - - - - - -
Calif. - 53 995 1,835 354 406 - - - - - 3
Alaska 1 1 2 12 2 8 - - - - - -
Hawaii 1 2 8 45 3 4 U - U - - 3
Guam - - - - - 1 U - U - - -
P.R. - - 9 106 156 366 - - - - - -
V.I. - - - - - - U - U - - -
Amer. Samoa - - - - - - U - U - - -
C.N.M.I. - 4 - 1 7 16 U - U - - 1
-----------------------------------------------------------------------------------------------------------------------------------------------------
N: Not notifiable U: Unavailable -: no reported cases
* Of 64 cases among children aged <5 years, serotype was reported for 26 and of those, 14 were type b.
** For imported measles, cases include only those resulting from importation from other countries.
=======================================================================================================================================================
TABLE III. (page 2) Provisional cases of selected notifiable diseases preventable by vaccination, United
States, weeks ending April 11, 1998, and April 5, 1997 (14th Week)
Meningococcal
Disease Mumps Pertussis Rubella
----------------- -------------------------- --------------------------- ---------------------------
Cum. Cum. Cum. Cum. Cum. Cum. Cum. Cum.
Reporting Area 1998 1997 1998 1998 1997 1998 1998 1997 1998 1998 1997
------------------------------------------------------------------------------------------------------------------------------------------
UNITED STATES 855 1,183 11 118 155 37 938 1,364 4 121 13
NEW ENGLAND 51 71 - - 6 4 168 376 - 21 -
Maine 4 8 - - - 1 5 6 - - -
N.H. 1 6 - - - 2 18 40 - - -
Vt. 1 2 - - - - 22 127 - - -
Mass. 24 43 - - 1 1 118 187 - 2 -
R.I. 3 2 - - 4 - - 11 - - -
Conn. 18 10 - - 1 - 5 5 - 19 -
MID. ATLANTIC 92 115 - 5 19 2 137 124 2 66 5
Upstate N.Y. 24 24 - 2 4 2 80 53 2 66 1
N.Y. City 8 20 U - 1 U - 28 U - 4
N.J. 24 22 - - 3 - - 7 - - -
Pa. 36 49 - 3 11 - 57 36 - - -
E.N. CENTRAL 126 161 1 18 23 4 102 158 - - 3
Ohio 53 59 1 10 7 2 38 53 - - -
Ind. 23 17 - - 4 - 34 11 - - -
Ill. 25 51 - - 7 2 7 18 - - -
Mich. 12 14 - 8 4 - 13 24 - - -
Wis. 13 20 - - 1 - 10 52 - - 3
W.N. CENTRAL 71 87 5 15 7 9 76 74 - 1 -
Minn. 6 2 4 8 3 9 50 45 - - -
Iowa 11 21 1 5 3 - 13 7 - - -
Mo. 31 47 - 1 - - 9 9 - 1 -
N. Dak. - - - 1 - - - 1 - - -
S. Dak. 5 3 - - - - 2 1 - - -
Nebr. 3 4 - - 1 - 2 2 - - -
Kans. 15 10 U - - U - 9 U - -
S. ATLANTIC 161 204 2 20 19 2 83 120 1 3 -
Del. 1 4 - - - - - - - - -
Md. 16 25 - 2 2 1 16 56 1 1 -
D.C. - 5 - - - - - 2 - - -
Va. 15 14 1 4 1 - 6 17 - - -
W. Va. 4 6 - - - - 1 3 - - -
N.C. 22 39 - 6 5 - 38 25 - 1 -
S.C. 20 31 - 3 1 1 7 4 - 1 -
Ga. 37 34 - - 2 - - 2 - - -
Fla. 46 46 1 5 8 - 15 11 - - -
E.S. CENTRAL 56 86 - - 11 1 16 32 - - -
Ky. - 20 - - - - 1 9 - - -
Tenn. 29 27 - - 3 1 6 10 - - -
Ala. 27 27 - - 4 - 9 7 - - -
Miss. - 12 - - 4 - - 6 - - -
W.S. CENTRAL 44 105 1 21 16 4 46 23 1 24 -
Ark. 10 19 - - - - 5 2 - - -
La. 16 21 U - 5 U - 6 U - -
Okla. 18 13 - - - - 6 - - - -
Tex. - 52 1 21 11 4 35 15 1 24 -
MOUNTAIN 60 77 1 9 7 6 221 247 - 5 -
Mont. 2 4 - - - - 1 2 - - -
Idaho 2 5 - - 2 3 113 140 - - -
Wyo. 3 - - 1 - - - 3 - - -
Colo. 14 21 - 1 2 1 30 77 - - -
N. Mex. 12 13 N N N - 47 12 - 1 -
Ariz. 21 16 - 2 - 1 18 9 - 1 -
Utah 5 9 1 1 1 1 9 1 - 2 -
Nev. 1 9 U 4 2 U 3 3 U 1 -
PACIFIC 194 277 1 30 47 5 89 210 - 1 5
Wash. 24 27 - 4 3 5 78 98 - - -
Oreg. 41 61 N N N - 8 5 - - -
Calif. 126 186 1 16 32 - - 101 - - 1
Alaska 1 1 - 2 2 - - 2 - - -
Hawaii 2 2 U 8 10 U 3 4 U 1 4
Guam - 1 U - 1 U - - U - -
P.R. 1 6 - 2 4 - 2 - - - -
V.I. - - U - - U - - U - -
Amer. Samoa - - U - - U - - U - -
C.N.M.I. - - U - - U - - U - -
------------------------------------------------------------------------------------------------------------------------------------------
N: Not notifiable U: Unavailable -: no reported cases
=======================================================================================================================================================
Return to top. Table_IV Note: To print large tables and graphs users may have to change their printer settings to landscape and use a small font size.
TABLE IV. Deaths in 122 U.S. cities,* week ending
April 11, 1998 (14th Week)
===================================================================================================================================
All Causes, By Age (Years)
------------------------------------------------------------------------ P&I**
Reporting Area All Ages >=65 45-64 25-44 1-24 <1 Total
---------------------------------------------------------------------------------------------------------------
NEW ENGLAND 482 378 65 20 4 14 37
Boston, Mass. 122 85 22 5 2 7 15
Bridgeport, Conn. 53 40 11 1 1 - 2
Cambridge, Mass. 11 8 2 1 - - 2
Fall River, Mass. 20 20 - - - - -
Hartford, Conn. 51 45 4 1 - 1 2
Lowell, Mass. 26 21 3 1 - 1 2
Lynn, Mass. 13 12 1 - - - 1
New Bedford, Mass. 25 22 2 1 - - -
New Haven, Conn. 41 31 4 1 1 4 3
Providence, R.I. U U U U U U U
Somerville, Mass. 2 1 1 - - - -
Springfield, Mass. 48 33 8 6 - 1 5
Waterbury, Conn. 20 18 2 - - - 1
Worcester, Mass. 50 42 5 3 - - 4
MID. ATLANTIC 2,240 1,587 430 153 24 36 111
Albany, N.Y. 38 31 3 2 1 1 2
Allentown, Pa. 27 23 3 1 - - -
Buffalo, N.Y. 62 49 9 2 1 1 1
Camden, N.J. 27 15 7 2 1 2 1
Elizabeth, N.J. 20 15 5 - - - -
Erie, Pa. 41 35 5 1 - - 5
Jersey City, N.J. 25 14 8 2 - 1 -
New York City, N.Y. 1,147 791 243 81 12 20 42
Newark, N.J. 69 45 11 2 - 1 2
Paterson, N.J. 10 4 2 4 - - -
Philadelphia, Pa. 400 276 89 30 3 2 24
Pittsburgh, Pa.*** 45 33 8 2 - 2 3
Reading, Pa. 22 20 2 - - - 1
Rochester, N.Y. 112 91 10 7 3 1 8
Schenectady, N.Y. 29 20 5 4 - - 4
Scranton, Pa. 32 25 4 2 1 - -
Syracuse, N.Y. 90 67 11 5 2 5 11
Trenton, N.J. 27 19 4 4 - - 7
Utica, N.Y. 17 14 1 2 - - -
Yonkers, N.Y. U U U U U U U
E.N. CENTRAL 2,165 1,465 399 176 50 59 131
Akron, Ohio 49 32 11 4 - 2 -
Canton, Ohio 37 27 7 3 - - 5
Chicago, Ill. 513 319 92 54 23 23 52
Cincinnati, Ohio 101 75 20 3 1 2 1
Cleveland, Ohio 119 74 26 12 2 5 4
Columbus, Ohio 185 129 37 14 3 2 18
Dayton, Ohio 123 96 21 5 - 1 6
Detroit, Mich. 201 113 50 26 5 7 7
Evansville, Ind. 44 38 5 1 - - 1
Fort Wayne, Ind. 66 42 13 7 1 3 -
Gary, Ind. 18 13 2 3 - - 1
Grand Rapids, Mich. 84 64 9 1 3 7 9
Indianapolis, Ind. 225 147 43 24 7 4 -
Lansing, Mich. 24 19 3 2 - - 3
Milwaukee, Wis. 90 63 18 6 2 1 8
Peoria, Ill. 20 16 3 - 1 - 1
Rockford, Ill. 45 30 9 4 1 1 2
South Bend, Ind. 38 33 3 1 - 1 4
Toledo, Ohio 109 89 16 3 1 - 7
Youngstown, Ohio 74 46 11 3 - - 2
W.N. CENTRAL 901 630 167 57 18 20 61
Des Moines, Iowa 104 77 17 6 1 3 9
Duluth, Minn. 29 22 2 4 1 - 3
Kansas City, Kans. 32 19 6 3 3 1 1
Kansas City, Mo. 109 56 28 11 3 2 2
Lincoln, Nebr. 34 26 8 - - - 4
Minneapolis, Minn. 206 147 37 11 4 7 17
Omaha, Nebr. 126 92 24 6 2 2 9
St. Louis, Mo. 101 72 19 7 1 2 5
St. Paul, Minn. 83 62 16 4 - 1 10
Wichita, Kans. 77 57 10 5 3 2 1
S. ATLANTIC 1,304 835 285 127 34 22 60
Atlanta, Ga. U U U U U U U
Baltimore, Md. 205 113 57 24 6 5 11
Charlotte, N.C. 66 43 15 6 1 1 1
Jacksonville, Fla. 136 93 28 11 1 2 -
Miami, Fla. 104 60 25 17 1 1 -
Norfolk, Va. 61 38 12 5 2 4 6
Richmond, Va. 77 55 13 7 2 - 2
Savannah, Ga. 45 35 3 5 1 1 5
St. Petersburg, Fla. 61 48 6 3 2 2 3
Tampa, Fla. 188 123 37 20 5 3 14
Washington, D.C. 353 222 86 29 13 3 18
Wilmington, Del. 8 5 3 - - - -
E.S. CENTRAL 818 562 164 54 21 15 50
Birmingham, Ala. 181 118 35 13 7 6 10
Chattanooga, Tenn. 52 33 12 4 1 2 3
Knoxville, Tenn. 70 48 12 5 3 2 8
Lexington, Ky. 57 36 16 2 2 1 2
Memphis, Tenn. 193 137 40 13 1 2 19
Mobile, Ala. 111 87 9 11 3 1 2
Montgomery, Ala. 31 25 4 1 - 1 4
Nashville, Tenn. 123 78 36 5 4 - 2
W.S. CENTRAL 1,446 962 280 123 41 40 88
Austin, Tex. 86 56 13 10 2 5 6
Baton Rouge, La. 22 16 2 2 1 1 -
Corpus Christi, Tex. 43 21 11 6 3 2 1
Dallas, Tex. 209 143 42 17 4 3 3
El Paso, Tex. 84 58 18 7 1 - 6
Ft. Worth, Tex. 113 74 16 14 4 5 10
Houston, Tex. 378 246 76 31 13 12 26
Little Rock, Ark. 82 49 20 6 2 5 2
New Orleans, La. 74 47 20 6 1 - -
San Antonio, Tex. 210 148 40 16 4 2 24
Shreveport, La. 58 43 9 2 3 1 5
Tulsa, Okla. 87 61 13 6 3 4 5
MOUNTAIN 883 619 160 58 19 26 54
Albuquerque, N.M. 86 62 11 7 4 2 1
Boise, Idaho 32 20 8 1 - 3 2
Colo. Springs, Colo. 56 37 10 4 2 3 4
Denver, Colo. U U U U U U U
Las Vegas, Nev. 209 147 45 12 4 1 8
Ogden, Utah 26 18 6 1 1 - 4
Phoenix, Ariz. 202 128 38 20 5 10 13
Pueblo, Colo. 29 22 4 2 1 - 2
Salt Lake City, Utah 99 71 21 3 - 4 10
Tucson, Ariz. 144 114 17 8 2 3 10
PACIFIC 1,451 994 283 106 31 36 131
Berkeley, Calif. 9 6 1 1 - 1 -
Fresno, Calif. 139 101 16 12 3 7 8
Glendale, Calif. 18 17 1 - - - 2
Honolulu, Hawaii 65 45 15 3 1 1 4
Long Beach, Calif. 77 56 17 2 1 1 14
Los Angeles, Calif. 296 196 70 19 5 6 28
Pasadena, Calif. 23 18 3 2 - - 3
Portland, Oreg. 105 80 14 5 6 - 5
Sacramento, Calif. U U U U U U U
San Diego, Calif. 116 81 21 7 3 3 12
San Francisco, Calif. 116 67 30 15 2 2 16
San Jose, Calif. 221 158 40 16 4 3 22
Santa Cruz, Calif. 22 16 3 2 1 - 3
Seattle, Wash. 140 79 33 19 3 6 6
Spokane, Wash. 40 28 7 1 2 2 8
Tacoma, Wash. 64 46 12 2 - 4 -
TOTAL 11,690**** 8,032 2,233 874 242 268 723
---------------------------------------------------------------------------------------------------------------
U: Unavailable -: no reported cases
* Mortality data in this table are voluntarily reported from 122 cities in the United States, most of which have populations
of 100,000 or more. A death is reported by the place of its occurrence and by the week that the death certificate was
filed. Fetal deaths are not included.
** Pneumonia and influenza.
*** Because of changes in reporting methods in this Pennsylvania city, these numbers are partial counts for the current
week. Complete counts will be available in 4 to 6 weeks.
**** Total includes unknown ages.
===================================================================================================================================
Return to top. Disclaimer All MMWR HTML versions of articles are electronic conversions from ASCII text into HTML. This conversion may have resulted in character translation or format errors in the HTML version. Users should not rely on this HTML document, but are referred to the electronic PDF version and/or the original MMWR paper copy for the official text, figures, and tables. An original paper copy of this issue can be obtained from the Superintendent of Documents, U.S. Government Printing Office (GPO), Washington, DC 20402-9371; telephone: (202) 512-1800. Contact GPO for current prices. **Questions or messages regarding errors in formatting should be addressed to mmwrq@cdc.gov.Page converted: 10/05/98 |
|||||||||
This page last reviewed 5/2/01
|