 |
|
|
|
|
|
|
| ||||||||||
|
|
|
|
|
|
|
||||
| ||||||||||
|
|
|
|
|
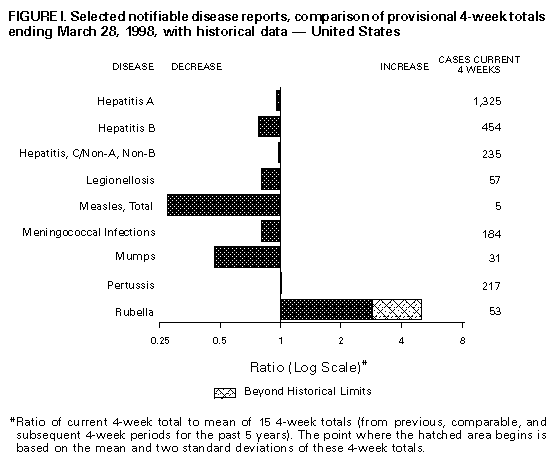
Persons using assistive technology might not be able to fully access information in this file. For assistance, please send e-mail to: mmwrq@cdc.gov. Type 508 Accommodation and the title of the report in the subject line of e-mail. Notifiable Diseases/Deaths in Selected Cities Weekly InformationFigure_I Selected notifiable disease reports, comparison of provisional 4-week totals ending March 28, 1998, with historical data -- United States Table_I Summary -- provisional cases of selected notifiable diseases, United States, cumulative, week ending March 28, 1998 (12th Week) Table_II Provisional cases of selected notifiable diseases, United States, weeks ending March 28, 1998 and March 22, 1997 (12th Week) Table_III Provisional cases of selected notifiable diseases preventable by vaccination, United States, weeks ending March 28, 1998 and March 22, 1997 (12th Week) Table_IV Deaths in 122 U.S. cities, week ending
March 28, 1998 (12th Week)
TABLE I. Summary -- provisional cases of specified notifiable diseases, United
States, cumulative, week ending March 28, 1998 (12th Week)
==================================================================================
                                             Cum. 1998
------------------------------------------------------
Anthrax                                              -
Brucellosis                                          3
Cholera                                              -
Congenital rubella syndrome                          -
Cryptosporidiosis*                                 416
Diphtheria                                           -
Encephalitis:  California*                           -
               eastern equine*                       -
               St. Louis*                            -
               western equine*                       -
Hansen Disease                                      25
Hantavirus pulmonary syndrome*+                      -
Hemolytic uremic syndrome, post-diarrheal*           4
HIV infection, pediatric*&                          64
Plague                                               -
Poliomyelitis, paralytic@                            -
Psittacosis                                         10
Rabies, human                                        -
Rocky Mountain spotted fever (RMSF)                 13
Streptococcal disease, invasive Group A            449
Streptococcal toxic-shock syndrome*                 16
Syphilis, congenital**                              10
Tetanus                                              3
Toxic-shock syndrome                                27
Trichinosis                                          1
Typhoid fever                                       61
Yellow fever                                         -
------------------------------------------------------
-: no reported cases
 * Not notifiable in all states
 + Updated weekly from reports to the Division of Viral and Rickettsial
   Diseases, National Center for Infectious Diseases (NCID).
 & Updated monthly to the Division of HIV/AIDS Prevention -- Surveillance
   and Epidemiology, National Center for HIV, STD, and TB Prevention
   (NCHSTP), last update March 28, 1998.
 @ One suspected case(s) of polio with onset in 1998 have also been reported
   to date.
** Updated from reports to the Division of STD Prevention, NCHSTP.

==================================================================================
Return to top. Table_II Note: To print large tables and graphs users may have to change their printer settings to landscape and use a small font size.
TABLE II. (page 1) Provisional cases of selected notifiable diseases, United States, weeks ending
March 28, 1998, and March 22, 1997 (12th Week)
Escherichia
coli O157:H7
------------------- Hepatitis
AIDS* Chlamydia NETSS** PHLIS*** Gonorrhea C\NA,NB
----------------- -------------------- -------- -------- ------------------- ----------------
Cum. Cum. Cum. Cum. Cum. Cum. Cum. Cum. Cum. Cum.
Reporting Area 1998 1997 1998 1997 1998 1998 1998 1997 1998 1997
------------------------------------------------------------------------------------------------------------------------------
UNITED STATES 10,971 11,590 107,668 100,694 177 59 66,930 63,321 711 631
NEW ENGLAND 316 259 4,279 4,135 24 10 1,172 1,406 8 16
Maine 4 16 216 204 1 - 13 8 - -
N.H. 13 2 212 189 5 2 26 41 - 2
Vt. 8 10 66 98 - - 1 14 - -
Mass. 98 122 1,934 1,731 10 8 502 551 8 14
R.I. 32 29 577 487 3 - 74 127 - -
Conn. 161 80 1,274 1,426 5 - 556 665 - -
MID. ATLANTIC 3,365 3,616 13,487 12,887 13 1 7,934 8,071 82 59
Upstate N.Y. 425 541 N N 10 - 1,005 1,208 75 42
N.Y. City 1,936 1,785 7,594 6,921 - 1 3,534 3,373 - -
N.J. 521 856 1,725 2,432 3 - 1,398 1,679 - -
Pa. 483 434 4,168 3,534 N - 1,997 1,811 7 17
E.N. CENTRAL 791 727 19,575 16,375 29 7 14,025 10,024 103 159
Ohio 149 167 5,614 5,111 9 - 3,438 3,308 5 5
Ind. 83 87 2,337 2,028 6 3 1,531 1,409 2 1
Ill. 374 250 4,945 2,557 10 - 4,262 1,360 5 22
Mich. 142 178 5,392 4,113 4 - 4,294 2,903 91 131
Wis. 43 45 1,287 2,566 N 4 500 1,044 - -
W.N. CENTRAL 202 264 7,188 7,203 20 8 3,039 2,968 81 34
Minn. 32 38 1,341 1,709 6 4 471 554 - -
Iowa 9 45 874 1,174 2 - 239 295 7 7
Mo. 101 140 2,702 2,556 4 3 1,527 1,502 72 21
N. Dak. 3 2 163 219 1 1 15 15 - 2
S. Dak. 7 2 392 234 - - 68 29 - -
Nebr. 15 20 573 303 3 - 197 98 - -
Kans. 35 17 1,143 1,008 4 - 522 475 2 4
S. ATLANTIC 3,013 3,064 22,877 19,193 22 8 19,067 19,581 39 45
Del. 40 38 563 - - 1 334 248 - -
Md. 333 316 1,740 1,537 9 4 1,981 2,915 4 5
D.C. 196 192 N N - - 813 1,038 - -
Va. 175 246 2,686 2,693 N 3 1,789 2,059 1 4
W. Va. 19 17 634 761 N - 169 236 2 1
N.C. 217 153 5,097 4,163 6 - 4,397 3,752 7 17
S.C. 164 156 4,026 2,940 1 - 2,607 2,761 - 12
Ga. 369 373 4,420 1,696 2 - 4,005 2,764 8 -
Fla. 1,500 1,573 3,711 5,403 4 - 2,972 3,808 17 6
E.S. CENTRAL 384 360 7,781 7,579 12 3 7,470 7,828 24 70
Ky. 63 32 1,449 1,470 2 - 850 1,006 - 2
Tenn. 143 177 3,015 2,793 7 3 2,607 2,414 21 34
Ala. 118 89 2,384 1,827 3 - 2,967 2,593 3 4
Miss. 60 62 933 1,489 - - 1,046 1,815 - 30
W.S. CENTRAL 1,369 994 15,064 10,060 2 - 9,559 7,197 9 52
Ark. 52 57 831 606 1 - 1,075 1,025 - 1
La. 212 205 2,813 1,475 - - 2,442 1,481 - 37
Okla. 71 47 2,183 1,532 1 - 1,174 1,068 - 1
Tex. 1,034 685 9,237 6,447 - - 4,868 3,623 9 13
MOUNTAIN 354 384 4,262 5,359 15 8 1,615 1,758 181 73
Mont. 10 12 211 158 1 - 11 11 4 3
Idaho 8 4 431 369 2 - 36 25 55 13
Wyo. 1 9 180 110 - - 10 14 81 24
Colo. 65 127 - 693 2 1 603 471 8 12
N. Mex. 55 26 951 960 4 3 176 318 14 12
Ariz. 128 71 2,043 2,110 N 2 696 700 - 5
Utah 35 23 306 308 4 - 35 36 9 1
Nev. 52 112 140 651 2 2 48 183 10 3
PACIFIC 1,177 1,922 13,155 17,903 40 14 3,049 4,488 184 123
Wash. 78 173 2,518 2,128 10 3 438 502 5 5
Oreg. 40 74 677 1,102 9 7 115 159 2 1
Calif. 1,036 1,649 9,121 14,014 21 3 2,345 3,612 142 74
Alaska - 16 458 306 - - 70 118 1 -
Hawaii 23 10 381 353 N 1 81 97 34 43
Guam - - 8 94 N - 2 10 - -
P.R. 272 264 U U 1 U 81 142 1 17
V.I. 13 11 N N N U - - - -
Amer. Samoa - - - - N U - - - -
C.N.M.I. - - N N N U 7 8 - 2
------------------------------------------------------------------------------------------------------------------------------
N: Not notifiable U: Unavailable -: no reported cases C.N.M.I.: Commonwealth of North Mariana Islands
* Updated monthly to the Division of HIV/AIDS Prevention, -- Surveillance and Epidemiology, National Center for HIV, STD,
and TB Prevention, last update March 28, 1998.
** National Electronic Telecommunications System for Surveillance.
*** Public Health Laboratory Information System.
=======================================================================================================================================================
TABLE II. (page 2) Provisional cases of selected notifiable diseases, United States, weeks ending
March 28, 1998, and March 22, 1997 (12th Week)
Lyme Syphilis Rabies,
Legionellosis Disease Malaria (Primary & Secondary) Tuberculosis Animal
---------------- ---------------- ---------------- --------------------- ----------------- -------
Cum. Cum. Cum. Cum. Cum. Cum. Cum. Cum. Cum. Cum. Cum.
Reporting Area 1998 1997 1998 1997 1998 1997 1998 1997 1998 * 1997 1998
-------------------------------------------------------------------------------------------------------------------------------------------
UNITED STATES 217 197 731 702 211 291 1,485 2,001 1,192 3,124 1,425
NEW ENGLAND 11 15 128 143 8 9 17 35 53 72 271
Maine 1 1 - - 1 - 1 - U 5 36
N.H. 2 2 5 4 - 1 - - 2 1 30
Vt. - 2 1 2 - - - - 1 - 13
Mass. 4 6 31 26 7 7 14 16 41 35 73
R.I. 4 1 14 18 - 1 - - 9 5 22
Conn. - 3 77 93 - - 2 19 U 26 97
MID. ATLANTIC 44 33 439 462 64 72 53 86 96 512 321
Upstate N.Y. 13 7 219 42 19 9 3 12 U 58 207
N.Y. City 6 1 - 28 30 43 9 16 U 269 U
N.J. 1 5 3 116 8 15 14 41 96 111 46
Pa. 24 20 217 276 7 5 27 17 U 74 68
E.N. CENTRAL 71 81 21 6 13 25 222 180 78 378 12
Ohio 33 41 20 2 1 1 46 61 5 84 11
Ind. 15 9 1 3 1 2 45 41 U 29 -
Ill. 5 4 - 1 5 11 84 17 73 192 -
Mich. 14 22 - - 6 9 38 22 U 50 -
Wis. 4 5 U U - 2 9 39 U 23 1
W.N. CENTRAL 16 15 6 1 8 7 40 47 44 92 119
Minn. 1 - 1 - 4 3 - 13 U 28 26
Iowa - 1 4 - 2 1 - 1 U 10 24
Mo. 8 5 - - 1 3 30 22 40 33 7
N. Dak. - 1 - - - - - - U 2 27
S. Dak. - 1 - - - - - - 4 2 14
Nebr. 6 5 - 1 - - 4 - - - -
Kans. 1 2 1 - 1 - 6 11 U 17 21
S. ATLANTIC 41 20 97 66 58 58 611 815 211 437 557
Del. 6 2 - 11 1 2 6 4 - 8 -
Md. 8 10 86 46 21 19 121 234 56 41 128
D.C. 2 1 4 4 3 4 21 31 25 17 -
Va. 3 1 1 - 5 13 49 68 30 40 151
W. Va. N N - - - - - - 17 9 19
N.C. 4 3 - 2 6 4 192 177 83 63 136
S.C. 4 1 - 1 - 3 73 96 U 52 23
Ga. - - 2 1 12 9 96 146 U 81 43
Fla. 14 2 4 1 10 4 53 59 U 126 57
E.S. CENTRAL 2 8 10 14 5 7 268 450 - 247 54
Ky. - - - 1 - 1 34 31 U 34 11
Tenn. 2 3 5 2 4 2 148 188 U 87 29
Ala. - 2 5 - 1 1 62 114 U 84 14
Miss. - 3 - 11 - 3 24 117 U 42 -
W.S. CENTRAL - 1 - 1 3 5 178 276 16 452 43
Ark. - - - - - 1 30 36 16 23 1
La. - - - - 3 3 82 110 - 19 -
Okla. - 1 - - - 1 11 28 U 37 42
Tex. - - - 1 - - 55 102 U 373 -
MOUNTAIN 15 14 1 - 12 14 46 37 60 87 30
Mont. 1 - - - - 1 - - 2 2 8
Idaho - 1 - - 1 - - - 1 1 -
Wyo. 1 1 - - - 1 - - 1 1 21
Colo. 4 4 - - 4 7 4 - U 18 -
N. Mex. 1 - - - 4 2 - - 7 2 -
Ariz. 1 3 - - 2 - 39 31 38 40 1
Utah 6 4 - - 1 - 2 1 11 1 -
Nev. 1 1 1 - - 3 1 5 U 22 -
PACIFIC 17 10 29 9 40 94 50 75 634 847 18
Wash. 1 2 - - - 1 4 3 U 59 -
Oreg. - - 1 3 6 5 2 1 U 23 -
Calif. 16 7 28 6 34 88 44 70 591 696 11
Alaska - - - - - - - - 10 23 7
Hawaii - 1 - - - - - 1 33 46 -
Guam - - - - - - - 2 - 13 -
P.R. - - - - - 2 73 53 - - 17
V.I. - - - - - - - - - - -
Amer. Samoa - - - - - - - - - - -
C.N.M.I. - - - - - - 1 2 8 - -
-------------------------------------------------------------------------------------------------------------------------------------------
N: Not notifiable U: Unavailable -: no reported cases
* Additional information about areas displaying 'U' (e.g., Tuberculosis) can be found in Notices to Readers, MMWR Vol. 47, No. 2, p. 39.
=======================================================================================================================================================
Return to top. Table_III Note: To print large tables and graphs users may have to change their printer settings to landscape and use a small font size.
TABLE III. (page 1) Provisional cases of selected notifiable diseases preventable by vaccination, United
States, weeks ending March 28, 1998, and March 22, 1997 (12th Week)
Hepatitis (Viral), by type Measles (Rubeola)
H. influenzae, --------------------------------------- ------------------------------------------------------------
invasive A B Indigenous Imported** Total
---------------- ----------------- ----------------- --------------- --------------- ---------------
Cum. Cum. Cum. Cum. Cum. Cum. Cum. Cum. Cum. Cum.
Reporting Area 1998* 1997 1998 1997 1998 1997 1998 1998 1998 1998 1998 1997
-----------------------------------------------------------------------------------------------------------------------------------------------------
UNITED STATES 247 284 3,879 6,134 1,461 1,815 - 1 - 6 7 17
NEW ENGLAND 14 16 73 141 13 44 - - - 1 1 -
Maine 2 2 9 8 - 3 - - - - - -
N.H. 1 2 5 8 4 2 - - - - - -
Vt. 2 - 4 4 - 1 - - - - - -
Mass. 9 11 14 77 6 25 - - - 1 1 -
R.I. - 1 5 9 3 4 - - - - - -
Conn. - - 36 35 - 9 - - - - - -
MID. ATLANTIC 34 37 199 556 193 315 - - - - - 5
Upstate N.Y. 14 1 79 40 68 45 - - - - - 3
N.Y. City 6 18 60 293 50 134 - - - - - 1
N.J. 14 11 2 86 - 62 - - - - - 1
Pa. - 7 58 137 75 74 - - - - - -
E.N. CENTRAL 39 45 563 770 183 287 - - - 1 1 4
Ohio 19 21 94 116 20 24 - - - - - -
Ind. 5 4 65 58 18 25 - - - - - -
Ill. 14 14 74 220 23 84 - - - - - 3
Mich. - 5 308 328 118 136 - - - 1 1 1
Wis. 1 1 22 48 4 18 - - - - - -
W.N. CENTRAL 9 9 424 430 97 137 - - - - - 1
Minn. 2 2 15 24 6 3 - - - - - -
Iowa 1 2 192 52 14 7 - - - - - -
Mo. 2 2 169 250 64 116 - - - - - 1
N. Dak. - - 2 4 1 - - - - - - -
S. Dak. - 2 2 5 1 - - - - - - -
Nebr. - - 8 19 2 4 - - - - - -
Kans. 4 1 36 76 9 7 - - - - - -
S. ATLANTIC 69 55 440 350 237 200 - 1 - 4 5 -
Del. - - - 8 - 1 - - - - - -
Md. 15 22 93 95 34 41 - - - 1 1 -
D.C. - - 13 11 3 17 - - - - - -
Va. 9 2 60 39 25 16 - - - 2 2 -
W. Va. 2 2 - 3 1 4 - - - - - -
N.C. 8 7 24 54 49 47 - - - - - -
S.C. 1 3 8 27 - 17 - - - - - -
Ga. 17 15 111 38 59 13 - - - 1 1 -
Fla. 17 4 131 75 66 44 - 1 - - 1 -
E.S. CENTRAL 10 15 94 141 115 141 - - - - - 1
Ky. - 2 - 22 - 7 - - - - - -
Tenn. 10 10 66 67 94 96 - - - - - -
Ala. - 3 28 30 21 17 - - - - - 1
Miss. - - - 22 - 21 U - U - - -
W.S. CENTRAL 15 10 233 921 81 112 - - - - - -
Ark. - 1 11 44 17 15 - - - - - -
La. 7 1 8 49 8 23 - - - - - -
Okla. 7 7 105 393 7 6 - - - - - -
Tex. 1 1 109 435 49 68 - - - - - -
MOUNTAIN 39 34 770 963 187 201 - - - - - -
Mont. - - 7 31 2 1 - - - - - -
Idaho - - 47 45 7 7 - - - - - -
Wyo. - - 14 11 4 5 - - - - - -
Colo. 7 5 63 117 23 44 - - - - - -
N. Mex. - 2 44 66 77 66 - - - - - -
Ariz. 24 12 507 402 43 39 - - - - - -
Utah 4 3 46 212 16 27 - - - - - -
Nev. 4 12 42 79 15 12 - - - - - -
PACIFIC 18 63 1,083 1,862 355 378 - - - - - 6
Wash. 1 - 150 113 30 11 - - - - - -
Oreg. 15 12 86 105 26 31 - - - - - -
Calif. - 48 838 1,595 294 326 - - - - - 3
Alaska 1 1 1 9 2 6 - - - - - -
Hawaii 1 2 8 40 3 4 - - - - - 3
Guam - - - - - 1 U - U - - -
P.R. - - 9 82 136 230 - - - - - -
V.I. - - - - - - - - - - - -
Amer. Samoa - - - - - - U - U - - -
C.N.M.I. - 4 - 1 7 14 U - U - - 1
-----------------------------------------------------------------------------------------------------------------------------------------------------
N: Not notifiable U: Unavailable -: no reported cases
* Of 54 cases among children aged <5 years, serotype was reported for 22 and of those, 12 were type b.
** For imported measles, cases include only those resulting from importation from other countries.
=======================================================================================================================================================
TABLE III. (page 2) Provisional cases of selected notifiable diseases preventable by vaccination, United
States, weeks ending March 28, 1998, and March 22, 1997 (12th Week)
Meningococcal
Disease Mumps Pertussis Rubella
----------------- -------------------------- --------------------------- ---------------------------
Cum. Cum. Cum. Cum. Cum. Cum. Cum. Cum.
Reporting Area 1998 1997 1998 1998 1997 1998 1998 1997 1998 1998 1997
------------------------------------------------------------------------------------------------------------------------------------------
UNITED STATES 701 999 6 92 126 50 779 1,070 9 86 9
NEW ENGLAND 46 59 - - 6 5 160 324 - 10 -
Maine 4 6 - - - - 4 6 - - -
N.H. 1 5 - - - - 15 35 - - -
Vt. 1 2 - - - 1 22 110 - - -
Mass. 21 38 - - 1 4 116 163 - 1 -
R.I. 3 2 - - 4 - - 9 - - -
Conn. 16 6 - - 1 - 3 1 - 9 -
MID. ATLANTIC 48 88 - 2 16 9 68 81 1 52 3
Upstate N.Y. 20 19 - 2 3 9 68 39 1 52 1
N.Y. City 8 17 - - 1 - - 16 - - 2
N.J. 20 19 - - 2 - - 6 - - -
Pa. - 33 - - 10 - - 20 - - -
E.N. CENTRAL 118 126 - 12 15 20 95 115 - - 3
Ohio 50 48 - 7 3 - 34 47 - - -
Ind. 23 12 - - 3 20 34 8 - - -
Ill. 20 39 - - 5 - 5 18 - - -
Mich. 12 10 - 5 3 - 12 22 - - -
Wis. 13 17 - - 1 - 10 20 - - 3
W.N. CENTRAL 57 76 1 9 5 3 65 57 - - -
Minn. 3 2 - 4 3 - 39 31 - - -
Iowa 9 17 1 3 2 - 13 7 - - -
Mo. 26 41 - 1 - 1 9 7 - - -
N. Dak. - - - 1 - - - 1 - - -
S. Dak. 5 3 - - - 2 2 1 - - -
Nebr. 1 3 - - - - 2 2 - - -
Kans. 13 10 - - - - - 8 - - -
S. ATLANTIC 141 185 1 17 16 6 70 97 - 2 -
Del. 1 3 - - - - - - - - -
Md. 14 23 - 2 1 - 14 54 - - -
D.C. - 5 - - - - - 2 - - -
Va. 14 11 - 2 1 - - 14 - - -
W. Va. 3 6 - - - 1 1 3 - - -
N.C. 19 36 1 6 5 4 34 13 - 1 -
S.C. 15 31 - 3 1 1 6 4 - 1 -
Ga. 36 28 - - 2 - - 2 - - -
Fla. 39 42 - 4 6 - 15 5 - - -
E.S. CENTRAL 25 76 - - 10 - 13 29 - - -
Ky. - 17 - - - - - 9 - - -
Tenn. 25 26 - - 3 - 4 8 - - -
Ala. - 25 - - 4 - 9 7 - - -
Miss. - 8 U - 3 U - 5 U - -
W.S. CENTRAL 40 76 1 18 13 1 33 18 7 16 -
Ark. 7 17 - - - - 4 2 - - -
La. 16 21 - - 4 - - 3 - - -
Okla. 17 11 - - - - 6 - - - -
Tex. - 27 1 18 9 1 23 13 7 16 -
MOUNTAIN 51 67 2 7 6 3 200 186 - 5 -
Mont. 2 4 - - - - 1 2 - - -
Idaho 2 4 - - 1 - 103 101 - - -
Wyo. 3 - - 1 - - - 3 - - -
Colo. 12 15 - 1 2 1 28 61 - - -
N. Mex. 8 13 N N N 1 46 10 - 1 -
Ariz. 18 15 - 1 - - 13 8 - 1 -
Utah 5 8 - - 1 1 6 - - 2 -
Nev. 1 8 2 4 2 - 3 1 - 1 -
PACIFIC 175 246 1 27 39 3 75 163 1 1 3
Wash. 23 25 - 4 3 3 64 62 - - -
Oreg. 36 56 N N N - 8 5 - - -
Calif. 113 162 1 14 28 - - 90 - - 1
Alaska 1 1 - 2 2 - - 2 - - -
Hawaii 2 2 - 7 6 - 3 4 1 1 2
Guam - 1 U - 1 U - - U - -
P.R. 1 6 - 2 4 - 2 - - - -
V.I. - - - - - - - - - - -
Amer. Samoa - - U - - U - - U - -
C.N.M.I. - - U - - U - - U - -
------------------------------------------------------------------------------------------------------------------------------------------
N: Not notifiable U: Unavailable -: no reported cases
=======================================================================================================================================================
Return to top. Table_IV Note: To print large tables and graphs users may have to change their printer settings to landscape and use a small font size.
TABLE IV. Deaths in 122 U.S. cities,* week ending
March 28, 1998 (12th Week)
===================================================================================================================================
All Causes, By Age (Years)
------------------------------------------------------------------------ P&I**
Reporting Area All Ages >=65 45-64 25-44 1-24 <1 Total
---------------------------------------------------------------------------------------------------------------
NEW ENGLAND 569 409 110 31 7 12 51
Boston, Mass. 143 81 38 16 3 5 17
Bridgeport, Conn. 36 34 1 - - 1 -
Cambridge, Mass. 17 15 1 1 - - 2
Fall River, Mass. 21 17 4 - - - -
Hartford, Conn. 67 44 15 3 2 3 3
Lowell, Mass. 24 20 2 2 - - 3
Lynn, Mass. 12 11 1 - - - -
New Bedford, Mass. 27 20 6 - - 1 -
New Haven, Conn. 37 28 6 1 1 1 3
Providence, R.I. 46 30 13 2 1 - 4
Somerville, Mass. 7 5 2 - - - 1
Springfield, Mass. 37 27 6 3 - 1 6
Waterbury, Conn. 43 35 7 1 - - 4
Worcester, Mass. 52 42 8 2 - - 8
MID. ATLANTIC 2,408 1,725 435 163 42 42 146
Albany, N.Y. 48 33 9 5 1 - -
Allentown, Pa. 18 16 2 - - - -
Buffalo, N.Y. 70 54 10 3 3 - 3
Camden, N.J. 26 18 3 3 1 1 1
Elizabeth, N.J. 17 14 2 - 1 - -
Erie, Pa. 52 43 7 1 - 1 5
Jersey City, N.J. 58 46 8 3 - 1 2
New York City, N.Y. 1,145 794 227 85 16 23 56
Newark, N.J. U U U U U U U
Paterson, N.J. 20 12 3 2 - 3 -
Philadelphia, Pa. 500 346 97 32 14 10 36
Pittsburgh, Pa.*** 48 36 8 4 - - 6
Reading, Pa. 27 22 5 - - - 3
Rochester, N.Y. 135 98 27 7 1 2 13
Schenectady, N.Y. 19 14 1 4 - - 1
Scranton, Pa. 37 29 3 5 - - 2
Syracuse, N.Y. 116 94 16 3 2 1 11
Trenton, N.J. 29 20 6 3 - - 1
Utica, N.Y. 17 17 - - - - 1
Yonkers, N.Y. 26 19 1 3 3 - 5
E.N. CENTRAL 2,096 1,462 379 140 53 62 138
Akron, Ohio 51 34 11 3 1 2 -
Canton, Ohio 47 36 10 1 - - 3
Chicago, Ill. 406 268 83 35 12 8 35
Cincinnati, Ohio 116 73 22 13 5 3 14
Cleveland, Ohio 151 98 31 9 5 8 4
Columbus, Ohio 136 90 27 9 4 6 9
Dayton, Ohio 115 93 18 3 1 - 10
Detroit, Mich. 220 147 33 23 6 11 7
Evansville, Ind. 42 26 11 5 - - -
Fort Wayne, Ind. 71 53 8 8 - 2 1
Gary, Ind. 14 8 6 - - - -
Grand Rapids, Mich. 65 45 13 2 1 4 2
Indianapolis, Ind. 166 110 33 13 4 6 13
Lansing, Mich. 56 49 7 - - - 5
Milwaukee, Wis. 129 91 23 7 4 4 14
Peoria, Ill. 42 31 7 2 2 - 7
Rockford, Ill. 49 36 6 5 1 1 4
South Bend, Ind. 58 49 5 - 2 2 8
Toledo, Ohio 89 70 12 - 3 4 1
Youngstown, Ohio 73 55 13 2 2 1 1
W.N. CENTRAL 768 569 120 47 6 21 57
Des Moines, Iowa U U U U U U U
Duluth, Minn. 21 19 1 1 - - 2
Kansas City, Kans. 30 22 4 1 2 1 -
Kansas City, Mo. 121 85 18 11 1 1 8
Lincoln, Nebr. 32 23 6 1 - 2 1
Minneapolis, Minn. 196 161 24 7 - 4 17
Omaha, Nebr. 111 75 21 9 2 4 13
St. Louis, Mo. 98 69 20 7 - 2 8
St. Paul, Minn. 92 71 12 7 - 2 8
Wichita, Kans. 67 44 14 3 1 5 -
S. ATLANTIC 996 665 191 94 27 19 68
Atlanta, Ga. U U U U U U U
Baltimore, Md. 175 106 42 18 5 4 16
Charlotte, N.C. 102 67 15 14 4 2 9
Jacksonville, Fla. 156 110 32 12 - 2 11
Miami, Fla. 111 65 22 17 7 - -
Norfolk, Va. 58 38 9 9 1 1 4
Richmond, Va. 72 51 13 5 1 2 2
Savannah, Ga. 50 34 12 3 - 1 6
St. Petersburg, Fla. 80 55 14 5 4 2 2
Tampa, Fla. 183 130 32 11 5 5 18
Washington, D.C. U U U U U U U
Wilmington, Del. 9 9 - - - - -
E.S. CENTRAL 958 676 185 63 13 17 77
Birmingham, Ala. 173 122 32 10 1 4 12
Chattanooga, Tenn. 67 41 17 8 1 - 5
Knoxville, Tenn. 96 69 21 3 2 1 21
Lexington, Ky. 104 75 20 6 3 - 6
Memphis, Tenn. 199 147 38 8 2 4 30
Mobile, Ala. 135 89 30 11 3 2 1
Montgomery, Ala. 63 52 5 4 - 2 1
Nashville, Tenn. 121 81 22 13 1 4 1
W.S. CENTRAL 1,771 1,169 308 154 85 55 131
Austin, Tex. 98 61 22 10 3 2 6
Baton Rouge, La. 54 39 10 5 - - -
Corpus Christi, Tex. 48 39 5 1 - 3 4
Dallas, Tex. 198 127 42 15 7 7 7
El Paso, Tex. 80 62 12 3 2 1 5
Ft. Worth, Tex. 133 90 24 11 4 4 17
Houston, Tex. 509 314 100 57 24 14 40
Little Rock, Ark. 71 53 11 3 3 1 7
New Orleans, La. 145 58 11 26 34 16 -
San Antonio, Tex. 208 149 38 12 6 3 15
Shreveport, La. 87 68 14 3 - 2 10
Tulsa, Okla. 140 109 19 8 2 2 20
MOUNTAIN 1,010 721 171 73 25 17 78
Albuquerque, N.M. 93 72 10 8 1 2 5
Boise, Idaho 42 34 4 2 1 1 2
Colo. Springs, Colo. 47 32 12 3 - - 1
Denver, Colo. 109 79 15 9 4 2 12
Las Vegas, Nev. 192 137 38 12 3 2 13
Ogden, Utah 26 22 3 - 1 - 3
Phoenix, Ariz. 200 130 39 16 6 6 13
Pueblo, Colo. 24 19 4 1 - - 4
Salt Lake City, Utah 108 65 18 14 7 4 9
Tucson, Ariz. 169 131 28 8 2 - 16
PACIFIC 938 681 165 56 22 13 99
Berkeley, Calif. 11 8 1 1 - 1 1
Fresno, Calif. 92 65 16 7 3 1 6
Glendale, Calif. U U U U U U U
Honolulu, Hawaii 54 44 6 4 - - 3
Long Beach, Calif. 82 66 11 3 1 1 5
Los Angeles, Calif. U U U U U U U
Pasadena, Calif. 36 28 7 - 1 - 7
Portland, Oreg. 139 96 31 9 1 1 16
Sacramento, Calif. 170 121 33 11 4 1 24
San Diego, Calif. 26 15 5 2 2 2 1
San Francisco, Calif. U U U U U U U
San Jose, Calif. 177 123 35 13 5 1 16
Santa Cruz, Calif. 22 16 4 1 1 - 3
Seattle, Wash. U U U U U U U
Spokane, Wash. 58 44 9 2 1 2 6
Tacoma, Wash. 71 55 7 3 3 3 11
TOTAL 11,514**** 8,077 2,064 821 280 258 845
---------------------------------------------------------------------------------------------------------------
U: Unavailable -: no reported cases
* Mortality data in this table are voluntarily reported from 122 cities in the United States, most of which have populations
of 100,000 or more. A death is reported by the place of its occurrence and by the week that the death certificate was
filed. Fetal deaths are not included.
** Pneumonia and influenza.
*** Because of changes in reporting methods in this Pennsylvania city, these numbers are partial counts for the current
week. Complete counts will be available in 4 to 6 weeks.
**** Total includes unknown ages.
===================================================================================================================================
Return to top. Disclaimer All MMWR HTML versions of articles are electronic conversions from ASCII text into HTML. This conversion may have resulted in character translation or format errors in the HTML version. Users should not rely on this HTML document, but are referred to the electronic PDF version and/or the original MMWR paper copy for the official text, figures, and tables. An original paper copy of this issue can be obtained from the Superintendent of Documents, U.S. Government Printing Office (GPO), Washington, DC 20402-9371; telephone: (202) 512-1800. Contact GPO for current prices. **Questions or messages regarding errors in formatting should be addressed to mmwrq@cdc.gov.Page converted: 10/05/98 |
|||||||||
This page last reviewed 5/2/01
|