 |
|
|
|
|
|
|
| ||||||||||
|
|
|
|
|
|
|
||||
| ||||||||||
|
|
|
|
|
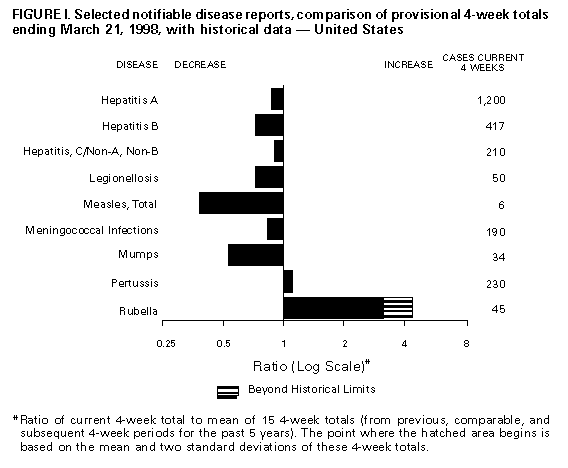
Persons using assistive technology might not be able to fully access information in this file. For assistance, please send e-mail to: mmwrq@cdc.gov. Type 508 Accommodation and the title of the report in the subject line of e-mail. Notifiable Diseases/Deaths in Selected Cities Weekly InformationFigure_I Selected notifiable disease reports, comparison of provisional 4-week totals ending March 21, 1998, with historical data -- United States Table_I Summary -- provisional cases of selected notifiable diseases, United States, cumulative, week ending March 21, 1998 (11th Week) Table_II Provisional cases of selected notifiable diseases, United States, weeks ending March 21, 1998 and March 15, 1997 (11th Week) Table_III Provisional cases of selected notifiable diseases preventable by vaccination, United States, weeks ending March 21, 1998 and March 15, 1997 (11th Week) Table_IV Deaths in 122 U.S. cities, week ending
March 21, 1998 (11th Week)
TABLE I. Summary -- provisional cases of specified notifiable diseases, United
States, cumulative, week ending March 21, 1998 (11th Week)
==================================================================================
                                             Cum. 1998
------------------------------------------------------
Anthrax                                              -
Brucellosis                                          3
Cholera                                              -
Congenital rubella syndrome                          -
Cryptosporidiosis*                                 352
Diphtheria                                           -
Encephalitis:  California*                           -
               eastern equine*                       -
               St. Louis*                            -
               western equine*                       -
Hansen Disease                                      24
Hantavirus pulmonary syndrome*+                      -
Hemolytic uremic syndrome, post-diarrheal*           3
HIV infection, pediatric*&                          39
Plague                                               -
Poliomyelitis, paralytic@                            -
Psittacosis                                          7
Rabies, human                                        -
Rocky Mountain spotted fever (RMSF)                 12
Streptococcal disease, invasive Group A            410
Streptococcal toxic-shock syndrome*                 15
Syphilis, congenital**                              10
Tetanus                                              2
Toxic-shock syndrome                                24
Trichinosis                                          1
Typhoid fever                                       51
Yellow fever                                         -
------------------------------------------------------
-: no reported cases
 * Not notifiable in all states
 + Updated weekly from reports to the Division of Viral and Rickettsial
   Diseases, National Center for Infectious Diseases (NCID).
 & Updated monthly to the Division of HIV/AIDS Prevention -- Surveillance
   and Epidemiology, National Center for HIV, STD, and TB Prevention
   (NCHSTP), last update February 22, 1998.
 @ One suspected case(s) of polio with onset in 1998 have also been reported
   to date.
** Updated from reports to the Division of STD Prevention, NCHSTP.

==================================================================================
Return to top. Table_II Note: To print large tables and graphs users may have to change their printer settings to landscape and use a small font size.
TABLE II. (page 1) Provisional cases of selected notifiable diseases, United States, weeks ending
March 21, 1998, and March 15, 1997 (11th Week)
Escherichia
coli O157:H7
------------------- Hepatitis
AIDS* Chlamydia NETSS** PHLIS*** Gonorrhea C\NA,NB
----------------- -------------------- -------- -------- ------------------- ----------------
Cum. Cum. Cum. Cum. Cum. Cum. Cum. Cum. Cum. Cum.
Reporting Area 1998 1997 1998 1997 1998 1998 1998 1997 1998 1997
------------------------------------------------------------------------------------------------------------------------------
UNITED STATES 7,421 11,596 91,091 91,927 158 57 57,916 58,999 603 573
NEW ENGLAND 202 259 3,928 3,725 21 10 1,095 1,293 8 13
Maine 4 16 195 180 - - 9 8 - -
N.H. 11 2 178 171 5 2 24 40 - 2
Vt. 8 10 66 91 - - 1 13 - -
Mass. 73 122 1,803 1,551 10 8 465 494 8 11
R.I. 21 29 526 443 3 - 71 120 - -
Conn. 85 80 1,160 1,289 3 - 525 618 - -
MID. ATLANTIC 2,112 3,617 13,323 11,667 10 1 7,727 7,419 71 50
Upstate N.Y. 299 541 N N 10 - 870 1,200 64 34
N.Y. City 1,160 1,785 7,594 6,332 - 1 3,534 3,095 - -
N.J. 287 856 1,561 2,216 - - 1,326 1,536 - -
Pa. 366 435 4,168 3,119 N - 1,997 1,588 7 16
E.N. CENTRAL 512 727 18,030 14,614 26 7 12,866 9,194 92 149
Ohio 93 167 5,232 4,618 8 - 3,231 3,043 5 5
Ind. 81 87 1,970 1,848 5 3 1,293 1,307 2 1
Ill. 249 250 4,798 2,370 9 - 3,953 1,243 5 22
Mich. 57 178 5,044 3,414 4 - 3,997 2,627 80 121
Wis. 32 45 986 2,364 N 4 392 974 - -
W.N. CENTRAL 152 264 6,517 6,628 13 8 2,807 2,793 76 31
Minn. 22 38 1,134 1,572 4 4 404 508 - -
Iowa 9 45 763 1,046 1 - 206 264 6 6
Mo. 76 140 2,418 2,365 2 3 1,406 1,451 68 19
N. Dak. 3 2 163 203 1 1 15 15 - 2
S. Dak. 5 2 338 211 - - 59 28 - -
Nebr. 15 20 558 289 3 - 195 95 - -
Kans. 22 17 1,143 942 2 - 522 432 2 4
S. ATLANTIC 1,890 3,065 21,450 17,056 22 7 17,740 17,635 37 43
Del. 36 38 512 - - - 309 228 - -
Md. 239 316 1,600 1,318 9 4 1,618 2,686 2 5
D.C. 192 192 N N - - 746 938 - -
Va. 114 246 2,478 2,354 N 3 1,495 1,899 1 4
W. Va. 19 17 630 711 N - 169 224 2 1
N.C. 107 153 4,597 3,656 6 - 4,058 3,255 7 16
S.C. 129 156 3,711 2,648 1 - 2,508 2,522 - 12
Ga. 229 374 4,420 1,455 2 - 4,005 2,348 8 -
Fla. 825 1,573 3,502 4,914 4 - 2,832 3,535 17 5
E.S. CENTRAL 291 360 7,280 6,811 11 3 7,074 7,173 24 65
Ky. 39 32 1,294 1,365 2 - 788 921 - 2
Tenn. 107 177 2,818 2,443 6 3 2,437 2,165 21 30
Ala. 86 89 2,235 1,691 3 - 2,803 2,432 3 4
Miss. 59 62 933 1,312 - - 1,046 1,655 - 29
W.S. CENTRAL 896 994 5,352 10,138 2 - 4,499 7,753 8 47
Ark. 33 57 717 1,074 1 - 1,184 1,857 - 1
La. 153 205 2,611 1,326 - - 2,257 1,326 - 33
Okla. 52 47 2,024 1,291 1 - 1,058 947 - -
Tex. 658 685 - 6,447 - - - 3,623 8 13
MOUNTAIN 205 383 3,632 4,794 14 7 1,403 1,621 151 62
Mont. 9 12 175 137 - - 8 10 4 3
Idaho 5 4 352 317 2 - 30 23 38 13
Wyo. - 9 167 100 - - 10 12 72 20
Colo. 39 127 - 564 2 1 556 436 8 7
N. Mex. 38 26 869 877 4 2 164 300 12 10
Ariz. 60 71 1,710 1,914 N 2 562 640 - 5
Utah 26 23 219 292 4 - 25 36 8 1
Nev. 28 111 140 593 2 2 48 164 9 3
PACIFIC 1,161 1,927 11,579 16,494 39 14 2,705 4,118 136 113
Wash. 77 174 2,301 1,935 10 3 405 463 2 5
Oreg. 31 74 534 1,010 9 7 101 147 2 1
Calif. 1,038 1,653 8,009 12,956 20 3 2,067 3,307 97 70
Alaska - 16 399 283 - - 61 115 1 -
Hawaii 15 10 336 310 N 1 71 86 34 37
Guam - - 8 86 N - 2 9 - -
P.R. 273 264 U U 1 U 81 129 1 13
V.I. 8 11 N N N U - - - -
Amer. Samoa - - - - N U - - - -
C.N.M.I. - - N N N U 7 8 - 2
------------------------------------------------------------------------------------------------------------------------------
N: Not notifiable U: Unavailable -: no reported cases C.N.M.I.: Commonwealth of North Mariana Islands
* Updated monthly to the Division of HIV/AIDS Prevention, -- Surveillance and Epidemiology, National Center for HIV, STD,
and TB Prevention, last update February 22, 1998.
** National Electronic Telecommunications System for Surveillance.
*** Public Health Laboratory Information System.
=======================================================================================================================================================
TABLE II. (page 2) Provisional cases of selected notifiable diseases, United States, weeks ending
March 21, 1998, and March 15, 1997 (11th Week)
Lyme Syphilis Rabies,
Legionellosis Disease Malaria (Primary & Secondary) Tuberculosis Animal
---------------- ---------------- ---------------- --------------------- ----------------- -------
Cum. Cum. Cum. Cum. Cum. Cum. Cum. Cum. Cum. Cum. Cum.
Reporting Area 1998 1997 1998 1997 1998 1997 1998 1997 1998 * 1997 1998
-------------------------------------------------------------------------------------------------------------------------------------------
UNITED STATES 196 187 683 646 187 267 1,332 1,874 1,026 2,791 1,285
NEW ENGLAND 10 14 111 134 8 9 16 32 49 69 235
Maine 1 1 - - 1 - - - U 5 32
N.H. 1 2 4 4 - 1 - - 2 1 23
Vt. - 2 - 2 - - - - 1 - 10
Mass. 4 6 25 25 7 7 14 16 38 34 68
R.I. 4 - 14 15 - 1 - - 8 5 20
Conn. - 3 68 88 - - 2 16 U 24 82
MID. ATLANTIC 41 32 423 423 53 67 48 80 75 432 316
Upstate N.Y. 11 6 210 34 18 8 2 12 U 48 207
N.Y. City 6 1 - 24 28 40 9 15 U 224 U
N.J. - 5 - 105 - 15 10 37 75 92 41
Pa. 24 20 213 260 7 4 27 16 U 68 68
E.N. CENTRAL 63 78 20 5 13 25 198 166 50 352 8
Ohio 27 39 19 1 1 1 42 56 5 84 8
Ind. 13 9 1 3 1 2 39 36 U 28 -
Ill. 5 4 - 1 5 11 70 16 45 187 -
Mich. 14 21 - - 6 9 38 22 U 33 -
Wis. 4 5 U U - 2 9 36 U 20 -
W.N. CENTRAL 13 15 4 1 4 5 36 42 43 81 99
Minn. - - - - 1 1 - 11 U 24 19
Iowa - 1 4 - 1 1 - 1 U 10 23
Mo. 7 5 - - 1 3 26 19 38 30 6
N. Dak. - 1 - - - - - - U 2 22
S. Dak. - 1 - - - - - - 4 2 14
Nebr. 5 5 - 1 - - 4 - - - -
Kans. 1 2 - - 1 - 6 11 U 13 15
S. ATLANTIC 38 20 91 62 55 55 579 744 201 397 505
Del. 4 2 - 11 1 2 6 4 - 7 -
Md. 7 10 83 42 21 19 121 209 53 32 119
D.C. 2 1 3 4 3 4 19 30 23 16 -
Va. 4 1 - - 5 13 44 54 30 40 137
W. Va. N N - - - - - - 16 9 12
N.C. 4 3 - 2 6 3 170 166 79 54 128
S.C. 3 1 - 1 - 3 73 96 U 40 23
Ga. - - 2 1 10 9 96 133 U 75 36
Fla. 14 2 3 1 9 2 50 52 U 124 50
E.S. CENTRAL 2 7 10 14 4 6 257 407 - 210 47
Ky. - - - 1 - 1 32 27 U 31 11
Tenn. 2 2 5 2 3 1 141 171 U 67 22
Ala. - 2 5 - 1 1 60 98 U 79 14
Miss. - 3 - 11 - 3 24 111 U 33 -
W.S. CENTRAL - 1 - 1 3 3 116 298 16 410 37
Ark. - - - - - 1 29 62 16 23 1
La. - - - - 3 2 77 106 - 19 -
Okla. - 1 - - - - 10 28 U 34 36
Tex. - - - 1 - - - 102 U 334 -
MOUNTAIN 14 12 1 - 12 14 40 34 48 79 21
Mont. 1 - - - - 1 - - 2 2 7
Idaho - - - - 1 - - - 1 - -
Wyo. - 1 - - - 1 - - 1 1 14
Colo. 4 3 - - 4 7 3 - U 17 -
N. Mex. 1 - - - 4 2 - - 7 2 -
Ariz. 1 3 - - 2 - 34 29 26 37 -
Utah 6 4 - - 1 - 2 1 11 1 -
Nev. 1 1 1 - - 3 1 4 U 19 -
PACIFIC 15 8 23 6 35 83 42 71 544 761 17
Wash. - 1 - - - - 4 3 U 55 -
Oreg. - - - 2 6 5 1 1 U 23 -
Calif. 15 6 23 4 29 78 37 66 517 620 11
Alaska - - - - - - - - 8 22 6
Hawaii - 1 - - - - - 1 19 41 -
Guam - - - - - - - 2 - 13 -
P.R. - - - - - 2 63 48 - - 15
V.I. - - - - - - - - - - -
Amer. Samoa - - - - - - - - - - -
C.N.M.I. - - - - - - 1 2 8 - -
-------------------------------------------------------------------------------------------------------------------------------------------
N: Not notifiable U: Unavailable -: no reported cases
* Additional information about areas displaying 'U' (e.g., Tuberculosis) can be found in Notices to Readers, MMWR Vol. 47, No. 2, p. 39.
=======================================================================================================================================================
Return to top. Table_III Note: To print large tables and graphs users may have to change their printer settings to landscape and use a small font size.
TABLE III. (page 1) Provisional cases of selected notifiable diseases preventable by vaccination, United
States, weeks ending March 21, 1998, and March 15, 1997 (11th Week)
Hepatitis (Viral), by type Measles (Rubeola)
H. influenzae, --------------------------------------- ------------------------------------------------------------
invasive A B Indigenous Imported** Total
---------------- ----------------- ----------------- --------------- --------------- ---------------
Cum. Cum. Cum. Cum. Cum. Cum. Cum. Cum. Cum. Cum.
Reporting Area 1998* 1997 1998 1997 1998 1997 1998 1998 1998 1998 1998 1997
-----------------------------------------------------------------------------------------------------------------------------------------------------
UNITED STATES 217 258 3,470 5,408 1,313 1,656 1 1 1 6 7 15
NEW ENGLAND 13 14 69 121 10 39 - - - 1 1 -
Maine 2 2 9 3 - 3 - - - - - -
N.H. 1 2 4 6 3 2 - - - - - -
Vt. 1 - 4 4 - 1 - - - - - -
Mass. 9 9 12 69 4 23 - - - 1 1 -
R.I. - 1 5 4 3 2 - - - - - -
Conn. - - 35 35 - 8 - - - - - -
MID. ATLANTIC 29 35 179 477 180 292 - - - - - 5
Upstate N.Y. 12 1 73 27 63 35 - - - - - 3
N.Y. City 5 17 46 262 42 130 - - - - - 1
N.J. 12 11 2 74 - 58 - - - - - 1
Pa. - 6 58 114 75 69 - - - - - -
E.N. CENTRAL 32 42 506 598 165 270 - - - 1 1 4
Ohio 18 20 85 106 19 20 - - - - - -
Ind. 2 4 56 58 14 25 U - U - - -
Ill. 11 12 59 207 15 80 - - - - - 3
Mich. - 5 288 183 113 128 - - - 1 1 1
Wis. 1 1 18 44 4 17 - - - - - -
W.N. CENTRAL 6 8 364 367 84 121 - - - - - -
Minn. - 2 9 6 5 2 - - - - - -
Iowa 1 2 152 49 12 6 - - - - - -
Mo. 1 2 163 230 57 102 - - - - - -
N. Dak. - - 1 4 1 - - - - - - -
S. Dak. - 1 1 5 1 - - - - - - -
Nebr. - - 8 14 2 4 - - - - - -
Kans. 4 1 30 59 6 7 - - - - - -
S. ATLANTIC 66 52 377 324 204 180 1 1 1 4 5 -
Del. - - - 7 - 1 - - - - - -
Md. 15 20 81 89 31 38 - - - 1 1 -
D.C. - - 12 10 3 13 - - - - - -
Va. 6 2 50 39 16 16 - - - 2 2 -
W. Va. 2 2 - 3 1 4 - - - - - -
N.C. 8 7 20 51 49 46 - - - - - -
S.C. 1 3 8 21 - 11 - - - - - -
Ga. 17 15 96 38 47 13 - - 1 1 1 -
Fla. 17 3 110 66 57 38 1 1 - - 1 -
E.S. CENTRAL 10 11 92 132 107 129 - - - - - 1
Ky. - 1 - 22 - 7 - - - - - -
Tenn. 10 10 64 59 86 86 - - - - - -
Ala. - - 28 30 21 15 - - - - - 1
Miss. - - - 21 - 21 U - U - - -
W.S. CENTRAL 12 10 205 812 66 98 - - - - - -
Ark. - 1 11 44 17 14 - - - - - -
La. 5 1 4 44 4 16 - - - - - -
Okla. 6 7 92 360 7 4 - - - - - -
Tex. 1 1 98 364 38 64 - - - - - -
MOUNTAIN 33 28 701 846 168 174 - - - - - -
Mont. - - 7 30 2 1 - - - - - -
Idaho - - 44 38 5 6 - - - - - -
Wyo. - - 12 9 3 5 - - - - - -
Colo. 6 5 56 109 21 43 - - - - - -
N. Mex. - 1 41 61 65 58 - - - - - -
Ariz. 21 9 457 342 41 32 - - - - - -
Utah 3 3 42 188 16 17 - - - - - -
Nev. 3 10 42 69 15 12 - - - - - -
PACIFIC 16 58 977 1,731 329 353 - - - - - 5
Wash. 1 - 134 106 28 11 - - - - - -
Oreg. 13 11 71 101 23 27 - - - - - -
Calif. - 44 764 1,478 273 306 - - - - - 2
Alaska 1 1 1 8 2 5 - - - - - -
Hawaii 1 2 7 38 3 4 U - U - - 3
Guam - - - - - 1 U - U - - -
P.R. - - 6 76 103 216 - - - - - -
V.I. - - - - - - U - U - - -
Amer. Samoa - - - - - - U - U - - -
C.N.M.I. - 3 - 1 7 13 U - U - - 1
-----------------------------------------------------------------------------------------------------------------------------------------------------
N: Not notifiable U: Unavailable -: no reported cases
* Of 45 cases among children aged <5 years, serotype was reported for 15 and of those, 8 were type b.
** For imported measles, cases include only those resulting from importation from other countries.
=======================================================================================================================================================
TABLE III. (page 2) Provisional cases of selected notifiable diseases preventable by vaccination, United
States, weeks ending March 21, 1998, and March 15, 1997 (11th Week)
Meningococcal
Disease Mumps Pertussis Rubella
----------------- -------------------------- --------------------------- ---------------------------
Cum. Cum. Cum. Cum. Cum. Cum. Cum. Cum.
Reporting Area 1998 1997 1998 1998 1997 1998 1998 1997 1998 1998 1997
------------------------------------------------------------------------------------------------------------------------------------------
UNITED STATES 650 918 9 84 119 58 689 992 15 72 7
NEW ENGLAND 43 55 - - 6 2 138 306 - 9 -
Maine 3 5 - - - - 4 6 - - -
N.H. 1 5 - - - 1 15 34 - - -
Vt. 1 2 - - - - 21 101 - - -
Mass. 19 36 - - 1 1 95 155 - - -
R.I. 3 1 - - 4 - - 9 - - -
Conn. 16 6 - - 1 - 3 1 - 9 -
MID. ATLANTIC 46 80 - 2 15 5 59 76 12 51 3
Upstate N.Y. 19 17 - 2 2 5 59 35 12 51 1
N.Y. City 8 16 - - 1 - - 15 - - 2
N.J. 19 16 - - 2 - - 6 - - -
Pa. - 31 - - 10 - - 20 - - -
E.N. CENTRAL 107 115 2 12 15 4 69 108 - - 3
Ohio 47 43 - 7 3 1 34 45 - - -
Ind. 19 12 U - 3 U 8 8 U - -
Ill. 18 36 - - 5 2 5 16 - - -
Mich. 12 9 2 5 3 1 12 19 - - -
Wis. 11 15 - - 1 - 10 20 - - 3
W.N. CENTRAL 48 73 - 8 5 12 61 49 - - -
Minn. - 2 - 4 3 11 39 31 - - -
Iowa 9 16 - 2 2 1 12 6 - - -
Mo. 23 40 - 1 - - 8 - - - -
N. Dak. - - - 1 - - - 1 - - -
S. Dak. 4 3 - - - - - 1 - - -
Nebr. 1 3 - - - - 2 2 - - -
Kans. 11 9 - - - - - 8 - - -
S. ATLANTIC 135 172 1 16 15 6 60 86 - 2 -
Del. 1 3 - - - - - - - - -
Md. 14 19 - 2 1 - 10 47 - - -
D.C. - 4 - - - - - 2 - - -
Va. 12 10 - 2 1 - - 13 - - -
W. Va. 3 5 - - - - - 3 - - -
N.C. 19 36 - 5 5 - 30 11 - 1 -
S.C. 14 31 - 3 1 - 5 4 - 1 -
Ga. 36 26 - - 2 - - 2 - - -
Fla. 36 38 1 4 5 6 15 4 - - -
E.S. CENTRAL 23 70 - - 9 - 13 26 - - -
Ky. - 16 - - - - - 9 - - -
Tenn. 23 26 - - 3 - 4 5 - - -
Ala. - 21 - - 3 - 9 7 - - -
Miss. - 7 U - 3 U - 5 U - -
W.S. CENTRAL 36 67 2 16 11 13 28 17 3 5 -
Ark. 7 15 - - - - 4 2 - - -
La. 12 15 - - 2 - - 2 - - -
Okla. 17 10 - - - 6 6 - - - -
Tex. - 27 2 16 9 7 18 13 3 5 -
MOUNTAIN 47 61 1 5 6 9 191 172 - 5 -
Mont. 2 4 - - - - 1 2 - - -
Idaho 2 4 - - 1 - 103 99 - - -
Wyo. 3 - - 1 - - - 3 - - -
Colo. 11 14 1 1 2 5 25 52 - - -
N. Mex. 7 12 N N N 4 45 8 - 1 -
Ariz. 17 12 - 1 - - 9 7 - 1 -
Utah 4 7 - - 1 - 5 - - 2 -
Nev. 1 8 - 2 2 - 3 1 - 1 -
PACIFIC 165 225 3 25 37 7 70 152 - - 1
Wash. 21 21 2 4 3 7 61 58 - - -
Oreg. 35 54 N N N - 8 5 - - -
Calif. 106 147 1 13 27 - - 83 - - 1
Alaska 1 1 - 2 2 - - 2 - - -
Hawaii 2 2 U 6 5 U 1 4 U - -
Guam - 1 U - 1 U - - U - -
P.R. - 5 1 2 4 - 2 - - - -
V.I. - - U - - U - - U - -
Amer. Samoa - - U - - U - - U - -
C.N.M.I. - - U - - U - - U - -
------------------------------------------------------------------------------------------------------------------------------------------
N: Not notifiable U: Unavailable -: no reported cases
=======================================================================================================================================================
Return to top. Table_IV Note: To print large tables and graphs users may have to change their printer settings to landscape and use a small font size.
TABLE IV. Deaths in 122 U.S. cities,* week ending
March 21, 1998 (11th Week)
===================================================================================================================================
All Causes, By Age (Years)
------------------------------------------------------------------------ P&I**
Reporting Area All Ages >=65 45-64 25-44 1-24 <1 Total
---------------------------------------------------------------------------------------------------------------
NEW ENGLAND 561 401 99 30 15 16 44
Boston, Mass. 170 113 28 12 5 12 17
Bridgeport, Conn. U U U U U U U
Cambridge, Mass. 14 13 1 - - - 1
Fall River, Mass. 37 30 5 2 - - -
Hartford, Conn. 51 32 13 5 1 - 2
Lowell, Mass. 19 16 3 - - - 3
Lynn, Mass. 8 5 2 - 1 - 1
New Bedford, Mass. 33 26 5 2 - - 1
New Haven, Conn. 44 29 9 3 1 2 2
Providence, R.I. 57 44 7 2 2 2 4
Somerville, Mass. 5 2 3 - - - -
Springfield, Mass. 44 29 9 3 3 - 4
Waterbury, Conn. 26 21 4 - 1 - -
Worcester, Mass. 53 41 10 1 1 - 9
MID. ATLANTIC 2,346 1,705 397 157 41 46 137
Albany, N.Y. 43 37 6 - - - 2
Allentown, Pa. 17 14 3 - - - 2
Buffalo, N.Y. U U U U U U U
Camden, N.J. 34 23 4 2 - 5 7
Elizabeth, N.J. 16 14 - 2 - - -
Erie, Pa. 59 53 4 1 - 1 3
Jersey City, N.J. 40 24 9 3 1 3 1
New York City, N.Y. 1,206 844 241 88 16 17 53
Newark, N.J. 60 33 8 12 5 2 3
Paterson, N.J. 44 31 5 5 1 2 -
Philadelphia, Pa. 300 223 50 15 7 5 25
Pittsburgh, Pa.*** 97 63 17 10 2 5 4
Reading, Pa. 25 19 2 3 - 1 2
Rochester, N.Y. 138 110 18 4 2 4 13
Schenectady, N.Y. 24 21 3 - - - 2
Scranton, Pa. 33 30 2 1 - - 1
Syracuse, N.Y. 100 84 12 2 2 - 13
Trenton, N.J. 88 66 8 8 5 1 5
Utica, N.Y. 22 16 5 1 - - 1
Yonkers, N.Y. U U U U U U U
E.N. CENTRAL 2,289 1,615 416 155 46 56 138
Akron, Ohio 56 41 10 3 - 2 -
Canton, Ohio 29 24 2 2 - 1 3
Chicago, Ill. 462 294 98 45 12 12 36
Cincinnati, Ohio 101 75 20 4 1 1 6
Cleveland, Ohio 147 100 32 10 1 4 7
Columbus, Ohio 269 194 47 16 4 8 23
Dayton, Ohio 151 118 23 6 4 - 11
Detroit, Mich. 241 154 55 16 7 9 4
Evansville, Ind. 42 31 7 4 - - 1
Fort Wayne, Ind. 68 56 8 3 1 - 8
Gary, Ind. 23 12 7 1 1 2 1
Grand Rapids, Mich. 54 46 7 - - 1 6
Indianapolis, Ind. 192 125 34 23 3 7 -
Lansing, Mich. 69 48 9 7 3 2 7
Milwaukee, Wis. 102 69 22 6 2 3 6
Peoria, Ill. 42 36 5 - 1 - 4
Rockford, Ill. 46 36 5 3 1 1 3
South Bend, Ind. 46 36 9 - 1 - 3
Toledo, Ohio 91 71 12 6 1 1 7
Youngstown, Ohio 58 49 4 - 3 2 2
W.N. CENTRAL 853 619 140 46 15 16 81
Des Moines, Iowa U U U U U U U
Duluth, Minn. 34 27 7 - - - 5
Kansas City, Kans. 39 23 8 6 2 - 1
Kansas City, Mo. 119 74 22 4 1 1 9
Lincoln, Nebr. 52 41 7 3 - 1 4
Minneapolis, Minn. 235 189 23 12 4 7 20
Omaha, Nebr. 117 80 25 6 3 3 21
St. Louis, Mo. 94 69 16 7 2 - 12
St. Paul, Minn. 87 61 17 7 - 2 6
Wichita, Kans. 76 55 15 1 3 2 3
S. ATLANTIC 1,099 737 218 91 22 27 65
Atlanta, Ga. U U U U U U U
Baltimore, Md. 220 129 54 26 8 3 23
Charlotte, N.C. 85 60 17 4 1 3 8
Jacksonville, Fla. 127 93 17 11 2 3 5
Miami, Fla. 108 82 17 7 1 1 -
Norfolk, Va. 52 39 10 3 - - 3
Richmond, Va. 76 48 19 5 4 - 5
Savannah, Ga. 59 43 10 4 - 2 -
St. Petersburg, Fla. 65 55 8 - - 2 4
Tampa, Fla. 182 132 32 10 4 4 15
Washington, D.C. 97 46 22 15 2 9 2
Wilmington, Del. 28 10 12 6 - - -
E.S. CENTRAL 945 662 186 65 18 12 78
Birmingham, Ala. 184 137 35 7 2 1 22
Chattanooga, Tenn. 86 62 18 4 1 1 5
Knoxville, Tenn. 89 63 17 7 2 - 10
Lexington, Ky. 109 76 20 9 2 2 12
Memphis, Tenn. 185 130 31 17 5 2 22
Mobile, Ala. 107 73 20 8 1 5 1
Montgomery, Ala. 49 33 10 4 2 - 4
Nashville, Tenn. 136 88 35 9 3 1 2
W.S. CENTRAL 1,613 1,049 340 130 49 45 96
Austin, Tex. 79 51 12 5 4 7 5
Baton Rouge, La. 48 25 13 7 3 - 2
Corpus Christi, Tex. 75 56 10 5 1 3 7
Dallas, Tex. 202 129 42 19 8 4 6
El Paso, Tex. 95 66 20 4 4 1 10
Ft. Worth, Tex. 137 97 21 13 2 4 4
Houston, Tex. 392 224 111 33 13 11 29
Little Rock, Ark. 97 69 17 7 1 3 4
New Orleans, La. 127 78 29 13 5 2 -
San Antonio, Tex. 205 139 43 15 2 6 12
Shreveport, La. 57 43 8 2 - 4 6
Tulsa, Okla. 99 72 14 7 6 - 11
MOUNTAIN 954 669 157 73 25 23 79
Albuquerque, N.M. 121 84 17 14 4 2 4
Boise, Idaho 44 34 6 1 1 2 7
Colo. Springs, Colo. 50 37 6 6 1 - 3
Denver, Colo. 129 93 21 7 2 6 17
Las Vegas, Nev. 180 116 40 14 7 3 10
Ogden, Utah 36 32 3 1 - - 8
Phoenix, Ariz. 87 49 16 8 3 5 6
Pueblo, Colo. 27 21 4 2 - - 2
Salt Lake City, Utah 111 78 17 7 5 4 8
Tucson, Ariz. 169 125 27 13 2 1 14
PACIFIC 1,950 1,452 318 106 38 36 190
Berkeley, Calif. 16 11 4 - - 1 -
Fresno, Calif. 103 76 13 9 3 2 6
Glendale, Calif. 31 28 1 1 1 - 3
Honolulu, Hawaii 82 55 13 7 2 5 8
Long Beach, Calif. 92 66 14 7 3 2 19
Los Angeles, Calif. 589 451 94 30 7 7 63
Pasadena, Calif. 26 16 7 3 - - 3
Portland, Oreg. 133 95 22 11 2 3 6
Sacramento, Calif. 199 143 39 10 5 2 27
San Diego, Calif. 145 109 24 6 2 4 15
San Francisco, Calif. U U U U U U U
San Jose, Calif. 207 154 34 8 7 4 14
Santa Cruz, Calif. 28 23 4 1 - - 3
Seattle, Wash. 127 91 23 6 4 3 5
Spokane, Wash. 57 42 7 6 2 - 6
Tacoma, Wash. 115 92 19 1 - 3 12
TOTAL 12,610**** 8,909 2,271 853 269 277 908
---------------------------------------------------------------------------------------------------------------
U: Unavailable -: no reported cases
* Mortality data in this table are voluntarily reported from 122 cities in the United States, most of which have populations
of 100,000 or more. A death is reported by the place of its occurrence and by the week that the death certificate was
filed. Fetal deaths are not included.
** Pneumonia and influenza.
*** Because of changes in reporting methods in this Pennsylvania city, these numbers are partial counts for the current
week. Complete counts will be available in 4 to 6 weeks.
**** Total includes unknown ages.
===================================================================================================================================
Return to top. Disclaimer All MMWR HTML versions of articles are electronic conversions from ASCII text into HTML. This conversion may have resulted in character translation or format errors in the HTML version. Users should not rely on this HTML document, but are referred to the electronic PDF version and/or the original MMWR paper copy for the official text, figures, and tables. An original paper copy of this issue can be obtained from the Superintendent of Documents, U.S. Government Printing Office (GPO), Washington, DC 20402-9371; telephone: (202) 512-1800. Contact GPO for current prices. **Questions or messages regarding errors in formatting should be addressed to mmwrq@cdc.gov.Page converted: 10/05/98 |
|||||||||
This page last reviewed 5/2/01
|