 |
|
|
|
|
|
|
| ||||||||||
|
|
|
|
|
|
|
||||
| ||||||||||
|
|
|
|
|
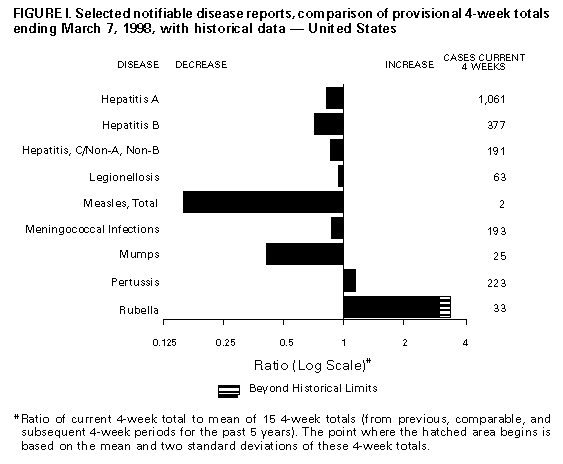
Persons using assistive technology might not be able to fully access information in this file. For assistance, please send e-mail to: mmwrq@cdc.gov. Type 508 Accommodation and the title of the report in the subject line of e-mail. Notifiable Diseases/Deaths in Selected Cities Weekly InformationFigure_I Selected notifiable disease reports, comparison of provisional 4-week totals ending March 7, 1998, with historical data -- United States Table_I Summary -- provisional cases of selected notifiable diseases, United States, cumulative, week ending March 7, 1998 (9th Week) Table_II Provisional cases of selected notifiable diseases, United States, weeks ending March 7, 1998 and March 1, 1997 (9th Week) Table_III Provisional cases of selected notifiable diseases preventable by vaccination, United States, weeks ending March 7, 1998 and March 1, 1997 (9th Week) Table_IV Deaths in 122 U.S. cities, week ending
March 7, 1998 (9th Week)
TABLE I. Summary -- provisional cases of specified notifiable diseases, United
States, cumulative, week ending March 7, 1998 (9th Week)
==================================================================================
                                             Cum. 1998
------------------------------------------------------
Anthrax                                              -
Brucellosis                                          3
Cholera                                              -
Congenital rubella syndrome                          -
Cryptosporidiosis*                                 246
Diphtheria                                           -
Encephalitis:  California*                           2
               eastern equine*                       -
               St. Louis*                            -
               western equine*                       -
Hansen Disease                                      17
Hantavirus pulmonary syndrome*+                      -
Hemolytic uremic syndrome, post-diarrheal*           1
HIV infection, pediatric*&                          39
Plague                                               -
Poliomyelitis, paralytic@                            -
Psittacosis                                          7
Rabies, human                                        -
Rocky Mountain spotted fever (RMSF)                 10
Streptococcal disease, invasive Group A            300
Streptococcal toxic-shock syndrome*                 13
Syphilis, congenital**                               -
Tetanus                                              2
Toxic-shock syndrome                                17
Trichinosis                                          1
Typhoid fever                                       39
Yellow fever                                         -
------------------------------------------------------
-: no reported cases
 * Not notifiable in all states
 + Updated weekly from reports to the Division of Viral and Rickettsial
   Diseases, National Center for Infectious Diseases (NCID).
 & Updated monthly to the Division of HIV/AIDS Prevention -- Surveillance
   and Epidemiology, National Center for HIV, STD, and TB Prevention
   (NCHSTP), last update February 28, 1998.
 @ One suspected case(s) of polio with onset in 1998 have also been reported
   to date.
** Updated from reports to the Division of STD Prevention, NCHSTP.

==================================================================================
Return to top. Table_II Note: To print large tables and graphs users may have to change their printer settings to landscape and use a small font size.
TABLE II. (page 1) Provisional cases of selected notifiable diseases, United States, weeks ending
March 7, 1998, and March 1, 1997 (9th Week)
Escherichia
coli O157:H7
------------------- Hepatitis
AIDS* Chlamydia NETSS** PHLIS*** Gonorrhea C\NA,NB
----------------- -------------------- -------- -------- ------------------- ----------------
Cum. Cum. Cum. Cum. Cum. Cum. Cum. Cum. Cum. Cum.
Reporting Area 1998 1997 1998 1997 1998 1998 1998 1997 1998 1997
------------------------------------------------------------------------------------------------------------------------------
UNITED STATES 7,421 10,995 70,446 72,903 118 43 45,621 47,608 446 448
NEW ENGLAND 202 259 3,224 2,941 18 8 907 1,046 4 8
Maine 4 16 160 141 - - 8 8 - -
N.H. 11 2 140 145 5 2 18 40 - -
Vt. 8 10 55 71 - - 1 10 - -
Mass. 73 122 1,518 1,234 9 6 385 402 4 8
R.I. 21 29 430 337 1 - 59 95 - -
Conn. 85 80 921 1,013 3 - 436 491 - -
MID. ATLANTIC 2,112 3,537 8,843 9,345 4 1 5,228 6,072 51 31
Upstate N.Y. 299 541 N N 4 - 523 1,089 49 21
N.Y. City 1,160 1,785 5,342 5,092 - 1 2,496 2,426 - -
N.J. 287 776 496 1,742 - - 644 1,253 - -
Pa. 366 435 3,005 2,511 N - 1,565 1,304 2 10
E.N. CENTRAL 512 727 13,543 11,457 22 6 9,926 7,230 76 114
Ohio 93 167 4,231 3,670 8 - 2,631 2,410 4 5
Ind. 81 87 1,261 1,474 5 3 889 1,101 1 1
Ill. 249 250 3,679 1,880 8 - 3,130 935 3 18
Mich. 57 178 3,713 2,501 1 - 3,018 1,974 68 90
Wis. 32 45 659 1,932 N 3 258 810 - -
W.N. CENTRAL 152 264 5,016 5,045 9 6 2,010 2,230 69 21
Minn. 22 38 868 1,258 3 2 315 430 - -
Iowa 9 45 650 752 1 - 182 183 3 1
Mo. 76 140 1,624 1,692 1 3 791 1,157 66 15
N. Dak. 3 2 1 164 - 1 1 11 - 1
S. Dak. 5 2 306 174 - - 52 24 - -
Nebr. 15 20 523 252 2 - 190 80 - -
Kans. 22 17 1,044 753 2 - 479 345 - 4
S. ATLANTIC 1,890 2,791 16,968 13,581 18 6 14,256 14,282 25 34
Del. 36 38 400 - - - 265 190 - -
Md. 239 316 1,311 957 9 4 1,397 2,110 3 5
D.C. 192 192 N N - - 596 836 - -
Va. 114 245 2,083 1,893 N 2 1,272 1,544 1 3
W. Va. 19 17 524 600 N - 151 187 - 1
N.C. 107 153 3,606 3,035 4 - 3,140 2,729 5 11
S.C. 129 156 2,983 2,074 1 - 2,037 2,047 - 11
Ga. 229 374 3,262 1,186 2 - 3,050 1,825 6 -
Fla. 825 1,300 2,799 3,836 2 - 2,348 2,814 10 3
E.S. CENTRAL 291 318 6,026 5,454 5 2 6,004 5,890 13 48
Ky. 39 32 1,063 1,070 1 - 673 764 - -
Tenn. 107 135 2,332 1,937 2 2 2,046 1,722 11 20
Ala. 86 89 1,698 1,355 2 - 2,239 1,963 2 3
Miss. 59 62 933 1,092 - - 1,046 1,441 - 25
W.S. CENTRAL 896 942 4,184 8,853 1 - 3,812 6,258 - 37
Ark. 33 41 676 453 - - 1,167 770 - -
La. 153 169 2,133 1,016 - - 1,872 1,105 - 28
Okla. 52 47 1,375 937 1 - 773 760 - -
Tex. 658 685 - 6,447 - - - 3,623 - 9
MOUNTAIN 205 314 3,352 3,689 10 5 1,256 1,341 117 56
Mont. 9 8 158 109 - - 8 8 4 3
Idaho 5 4 316 249 2 - 25 19 31 12
Wyo. - 5 143 86 - - 9 9 52 19
Colo. 39 96 - 246 2 1 479 343 7 7
N. Mex. 38 26 735 675 2 2 140 252 9 7
Ariz. 60 71 1,645 1,623 N 2 522 546 - 5
Utah 26 23 215 225 3 - 25 28 8 1
Nev. 28 81 140 476 1 - 48 136 6 2
PACIFIC 1,161 1,843 9,290 12,538 31 9 2,222 3,259 91 99
Wash. 77 92 1,863 1,564 9 3 323 395 2 3
Oreg. 31 74 456 827 5 2 78 117 1 1
Calif. 1,038 1,651 6,388 9,685 17 3 1,709 2,581 54 59
Alaska - 16 293 233 - - 52 91 - -
Hawaii 15 10 290 229 N 1 60 75 34 36
Guam - - 8 60 N - 2 8 - -
P.R. 273 264 U U 1 U 59 103 2 10
V.I. 8 11 N N N U - - - -
Amer. Samoa - - - - N U - - - -
C.N.M.I. - - N N N U 7 4 - 2
------------------------------------------------------------------------------------------------------------------------------
N: Not notifiable U: Unavailable -: no reported cases C.N.M.I.: Commonwealth of North Mariana Islands
* Updated monthly to the Division of HIV/AIDS Prevention, -- Surveillance and Epidemiology, National Center for HIV, STD,
and TB Prevention, last update February 28, 1998.
** National Electronic Telecommunications System for Surveillance.
*** Public Health Laboratory Information System.
=======================================================================================================================================================
TABLE II. (page 2) Provisional cases of selected notifiable diseases, United States, weeks ending
March 7, 1998, and March 1, 1997 (9th Week)
Lyme Syphilis Rabies,
Legionellosis Disease Malaria (Primary & Secondary) Tuberculosis Animal
---------------- ---------------- ---------------- --------------------- ----------------- -------
Cum. Cum. Cum. Cum. Cum. Cum. Cum. Cum. Cum. Cum. Cum.
Reporting Area 1998 1997 1998 1997 1998 1997 1998 1997 1998 * 1997 1998
-------------------------------------------------------------------------------------------------------------------------------------------
UNITED STATES 147 146 425 544 138 210 1,079 1,545 770 2,101 1,004
NEW ENGLAND 6 10 55 115 5 7 12 22 31 40 184
Maine - - - - - - - - U 5 27
N.H. 1 2 1 4 - 1 - - - 1 14
Vt. - 2 - 2 - - - - - - 3
Mass. 2 3 18 19 5 5 11 13 23 15 56
R.I. 3 - 9 11 - 1 - - 8 4 15
Conn. - 3 27 79 - - 1 9 U 15 69
MID. ATLANTIC 28 26 252 353 41 47 41 67 47 304 258
Upstate N.Y. 10 5 120 28 17 5 2 12 U 30 168
N.Y. City 1 - - 21 20 26 7 12 U 173 U
N.J. - 5 - 87 - 14 10 31 47 64 35
Pa. 17 16 132 217 4 2 22 12 U 37 55
E.N. CENTRAL 42 59 16 3 9 19 174 132 42 285 7
Ohio 20 31 15 - 1 1 35 44 5 61 7
Ind. 4 5 1 2 1 2 38 29 U 23 -
Ill. 3 1 - 1 1 8 56 16 37 171 -
Mich. 12 19 - - 6 7 38 14 U 18 -
Wis. 3 3 U U - 1 7 29 U 12 -
W.N. CENTRAL 10 10 2 1 2 3 20 33 28 57 69
Minn. - - - - - - - 7 U 18 12
Iowa - - 2 - 1 1 - 1 U 8 21
Mo. 8 6 - - 1 2 10 14 28 20 4
N. Dak. - - - - - - - - U 2 17
S. Dak. - - - - - - - - - 1 6
Nebr. 2 3 - 1 - - 4 - - - -
Kans. - 1 - - - - 6 11 U 8 9
S. ATLANTIC 33 16 77 53 43 45 458 607 167 274 399
Del. 4 1 - 9 1 2 5 3 - 7 -
Md. 6 9 69 35 17 16 99 179 39 27 95
D.C. 2 1 4 4 3 3 14 25 19 13 -
Va. 4 - - - 4 9 39 41 30 40 101
W. Va. N N - - - - - - 12 7 9
N.C. 3 3 - 2 4 2 128 122 67 40 103
S.C. 3 - - 1 - 3 47 79 U 16 15
Ga. - - 2 1 9 8 83 113 U 50 36
Fla. 11 2 2 1 5 2 43 45 U 74 40
E.S. CENTRAL 2 7 6 14 4 5 211 342 - 156 31
Ky. - - - 1 - 1 24 23 U 25 4
Tenn. 2 2 5 2 3 1 114 141 U 48 15
Ala. - 2 1 - 1 1 49 87 U 61 12
Miss. - 3 - 11 - 2 24 91 U 22 -
W.S. CENTRAL - 1 - - 2 3 100 255 5 324 28
Ark. - - - - - 1 24 34 5 20 1
La. - - - - 2 2 66 95 - 13 -
Okla. - 1 - - - - 10 24 U 26 27
Tex. - - - - - - - 102 U 265 -
MOUNTAIN 11 10 1 - 10 11 40 32 37 51 13
Mont. 1 - - - - 1 - - 2 - 4
Idaho - - - - 1 - - - - - -
Wyo. - - - - - 1 - - 1 1 9
Colo. 4 3 - - 3 6 3 - U 10 -
N. Mex. 1 - - - 3 - - - 7 - -
Ariz. - 3 - - 2 - 34 27 21 23 -
Utah 4 3 - - 1 - 2 1 6 1 -
Nev. 1 1 1 - - 3 1 4 U 16 -
PACIFIC 15 7 16 5 22 70 23 55 413 610 15
Wash. - 1 - - - - 4 3 U 42 -
Oreg. - - - 2 5 3 1 1 U 20 -
Calif. 15 5 16 3 17 67 18 51 391 499 11
Alaska - - - - - - - - 5 17 4
Hawaii - 1 - - - - - - 17 32 -
Guam - - - - - - - 2 - 11 -
P.R. - - - - - 2 50 42 - - 12
V.I. - - - - - - - - - - -
Amer. Samoa - - - - - - - - - - -
C.N.M.I. - - - - - - 1 - 8 - -
-------------------------------------------------------------------------------------------------------------------------------------------
N: Not notifiable U: Unavailable -: no reported cases
* Additional information about areas displaying 'U' (e.g., Tuberculosis) can be found in Notices to Readers, MMWR Vol. 47, No. 2, p. 39.
=======================================================================================================================================================
Return to top. Table_III Note: To print large tables and graphs users may have to change their printer settings to landscape and use a small font size.
TABLE III. (page 1) Provisional cases of selected notifiable diseases preventable by vaccination, United
States, weeks ending March 7, 1998, and March 1, 1997 (9th Week)
Hepatitis (Viral), by type Measles (Rubeola)
H. influenzae, --------------------------------------- ------------------------------------------------------------
invasive A B Indigenous Imported** Total
---------------- ----------------- ----------------- --------------- --------------- ---------------
Cum. Cum. Cum. Cum. Cum. Cum. Cum. Cum. Cum. Cum.
Reporting Area 1998* 1997 1998 1997 1998 1997 1998 1998 1998 1998 1998 1997
-----------------------------------------------------------------------------------------------------------------------------------------------------
UNITED STATES 158 192 2,580 4,247 985 1,272 - 1 1 4 5 13
NEW ENGLAND 9 13 58 94 6 33 - - - 1 1 -
Maine - 2 8 3 - 1 - - - - - -
N.H. 1 2 2 5 2 2 - - - - - -
Vt. - - 3 4 - 1 - - - - - -
Mass. 8 8 8 47 2 21 - - - 1 1 -
R.I. - 1 5 3 2 2 - - - - - -
Conn. - - 32 32 - 6 - - - - - -
MID. ATLANTIC 21 28 119 369 133 227 - - - 1 1 5
Upstate N.Y. 11 1 59 15 51 29 - - - 1 1 3
N.Y. City 3 13 29 202 34 95 - - - - - 1
N.J. 7 10 2 61 - 48 - - - - - 1
Pa. - 4 29 91 48 55 - - - - - -
E.N. CENTRAL 18 33 393 470 122 218 - - - 1 1 2
Ohio 15 18 71 90 13 16 - - - - - -
Ind. 2 3 48 40 10 24 - - - - - -
Ill. - 8 34 162 8 63 - - - - - 1
Mich. - 3 226 140 87 102 - - - 1 1 1
Wis. 1 1 14 38 4 13 - - - - - -
W.N. CENTRAL - 5 280 291 66 97 - - - - - -
Minn. - 2 5 1 2 - - - - - - -
Iowa - 1 114 38 10 6 - - - - - -
Mo. - 2 145 185 49 80 - - - - - -
N. Dak. - - 1 2 - - - - - - - -
S. Dak. - - 1 5 1 - - - - - - -
Nebr. - - 3 12 2 4 - - - - - -
Kans. - - 11 48 2 7 - - - - - -
S. ATLANTIC 49 31 298 268 175 121 - 1 1 1 2 -
Del. - - - 7 - 1 - - - - - -
Md. 13 11 61 80 25 31 - - 1 1 1 -
D.C. - - 10 7 2 7 - - - - - -
Va. 4 2 32 30 13 15 - - - - - -
W. Va. 1 2 - 3 - 3 - - - - - -
N.C. 3 7 14 45 49 26 - - - - - -
S.C. - 3 7 16 - 8 - - - - - -
Ga. 13 3 81 28 41 6 - - - - - -
Fla. 15 3 93 52 45 24 - 1 - - 1 -
E.S. CENTRAL 7 14 79 110 72 99 - - - - - 1
Ky. - 1 - 18 - 5 - - - - - -
Tenn. 7 8 55 47 59 63 - - - - - -
Ala. - 5 24 26 13 14 - - - - - 1
Miss. - - - 19 - 17 - - - - - -
W.S. CENTRAL 9 7 104 513 24 53 - - - - - -
Ark. - - 8 38 14 9 - - - - - -
La. 4 1 4 21 3 6 - - - - - -
Okla. 4 5 85 265 7 2 - - - - - -
Tex. 1 1 7 189 - 36 - - - - - -
MOUNTAIN 31 15 558 733 138 143 - - - - - -
Mont. - - 6 23 1 1 - - - - - -
Idaho - - 40 35 4 3 - - - - - -
Wyo. - - 12 4 2 4 - - - - - -
Colo. 5 1 50 92 13 35 - - - - - -
N. Mex. - 1 37 55 50 47 - - - - - -
Ariz. 19 4 347 299 37 29 - - - - - -
Utah 2 2 37 167 16 14 - - - - - -
Nev. 5 7 29 58 15 10 - - - - - -
PACIFIC 14 46 691 1,399 249 281 - - - - - 5
Wash. 1 - 80 80 16 8 - - - - - -
Oreg. 11 7 55 83 18 22 - - - - - -
Calif. - 37 549 1,195 210 243 - - - - - 2
Alaska 1 - 1 8 2 4 - - - - - -
Hawaii 1 2 6 33 3 4 - - - - - 3
Guam - - - - - 1 U - U - - -
P.R. - - - 39 39 142 - - - - - -
V.I. - - - - - - U - U - - -
Amer. Samoa - - - - - - U - U - - -
C.N.M.I. - 2 - 1 7 7 U - U - - -
-----------------------------------------------------------------------------------------------------------------------------------------------------
N: Not notifiable U: Unavailable -: no reported cases
* Of 33 cases among children aged <5 years, serotype was reported for 12 and of those, 6 were type b.
** For imported measles, cases include only those resulting from importation from other countries.
=======================================================================================================================================================
TABLE III. (page 2) Provisional cases of selected notifiable diseases preventable by vaccination, United
States, weeks ending March 7, 1998, and March 1, 1997 (9th Week)
Meningococcal
Disease Mumps Pertussis Rubella
----------------- -------------------------- --------------------------- ---------------------------
Cum. Cum. Cum. Cum. Cum. Cum. Cum. Cum.
Reporting Area 1998 1997 1998 1998 1997 1998 1998 1997 1998 1998 1997
------------------------------------------------------------------------------------------------------------------------------------------
UNITED STATES 521 749 6 61 79 64 566 793 27 55 6
NEW ENGLAND 35 46 - - 3 7 119 255 - 9 -
Maine 3 4 - - - - 4 4 - - -
N.H. 1 4 - - - - 11 31 - - -
Vt. 1 2 - - - 1 16 85 - - -
Mass. 14 29 - - 1 6 85 127 - - -
R.I. 3 1 - - 1 - - 7 - - -
Conn. 13 6 - - 1 - 3 1 - 9 -
MID. ATLANTIC 38 63 1 2 9 9 47 54 25 37 2
Upstate N.Y. 16 12 1 2 1 9 47 22 25 37 -
N.Y. City 7 15 - - 1 - - 15 - - 2
N.J. 15 10 - - 2 - - 5 - - -
Pa. - 26 - - 5 - - 12 - - -
E.N. CENTRAL 67 100 - 9 10 4 58 89 - - 3
Ohio 40 39 - 6 3 2 31 40 - - -
Ind. 8 10 - - 2 - 4 2 - - -
Ill. - 32 - - 2 1 1 12 - - -
Mich. 10 7 - 3 2 1 14 18 - - -
Wis. 9 12 - - 1 - 8 17 - - 3
W.N. CENTRAL 41 62 4 5 3 6 43 31 - - -
Minn. - 2 3 4 1 4 27 18 - - -
Iowa 8 11 1 1 2 1 9 6 - - -
Mo. 21 34 - - - 1 5 - - - -
N. Dak. - - - - - - - 1 - - -
S. Dak. 4 3 - - - - - 1 - - -
Nebr. 1 3 - - - - 2 2 - - -
Kans. 7 9 - - - - - 3 - - -
S. ATLANTIC 118 135 - 15 11 7 54 70 - 2 -
Del. 1 3 - - - - - - - - -
Md. 14 12 - 2 - 1 8 42 - - -
D.C. - 3 - - - - - 2 - - -
Va. 11 8 - 2 1 - - 7 - - -
W. Va. 3 5 - - - - - 3 - - -
N.C. 18 28 - 5 4 5 30 10 - 1 -
S.C. 10 28 - 3 1 - 5 3 - 1 -
Ga. 31 19 - - 2 - - 2 - - -
Fla. 30 29 - 3 3 1 11 1 - - -
E.S. CENTRAL 19 63 - - 7 1 13 21 - - -
Ky. - 14 - - - - - 6 - - -
Tenn. 19 22 - - 2 1 4 4 - - -
Ala. - 20 - - 2 - 9 6 - - -
Miss. - 7 - - 3 - - 5 - - -
W.S. CENTRAL 30 50 - 11 7 2 17 11 1 2 -
Ark. 5 11 - - - - 8 2 - - -
La. 10 13 - - - - - 1 - - -
Okla. 15 7 - - - - - - - - -
Tex. - 19 - 11 7 2 9 8 1 2 -
MOUNTAIN 43 44 - 4 4 10 160 149 1 5 -
Mont. 2 3 - - - - 1 - - - -
Idaho 1 3 - - - 3 93 88 - - -
Wyo. 3 - - 1 - - - 3 - - -
Colo. 11 4 - - 1 2 14 44 - - -
N. Mex. 7 10 N N N 1 39 8 - 1 -
Ariz. 16 12 - 1 - 3 6 5 1 1 -
Utah 2 6 - - 1 1 5 - - 2 -
Nev. 1 6 - 2 2 - 2 1 - 1 -
PACIFIC 130 186 1 15 25 18 55 113 - - 1
Wash. 20 17 1 1 3 18 47 35 - - -
Oreg. 30 47 N N N - 8 4 - - -
Calif. 77 121 - 8 18 - - 69 - - 1
Alaska 1 - - 2 - - - 1 - - -
Hawaii 2 1 - 4 4 - - 4 - - -
Guam - 1 U - 1 U - - U - -
P.R. - 3 - - 3 - - - - - -
V.I. - - U - - U - - U - -
Amer. Samoa - - U - - U - - U - -
C.N.M.I. - - U - - U - - U - -
------------------------------------------------------------------------------------------------------------------------------------------
N: Not notifiable U: Unavailable -: no reported cases
=======================================================================================================================================================
Return to top. Table_IV Note: To print large tables and graphs users may have to change their printer settings to landscape and use a small font size.
TABLE IV. Deaths in 122 U.S. cities,* week ending
March 7, 1998 (9th Week)
===================================================================================================================================
All Causes, By Age (Years)
------------------------------------------------------------------------ P&I**
Reporting Area All Ages >=65 45-64 25-44 1-24 <1 Total
---------------------------------------------------------------------------------------------------------------
NEW ENGLAND 659 488 107 45 7 12 60
Boston, Mass. 170 117 30 17 3 3 23
Bridgeport, Conn. 50 34 10 4 - 2 -
Cambridge, Mass. 17 14 3 - - - 1
Fall River, Mass. 37 31 4 2 - - 1
Hartford, Conn. 59 42 12 4 - 1 -
Lowell, Mass. 35 25 6 3 - 1 3
Lynn, Mass. 13 10 2 1 - - -
New Bedford, Mass. 35 32 1 2 - - 8
New Haven, Conn. 25 16 3 4 1 1 1
Providence, R.I. 70 59 5 3 1 2 4
Somerville, Mass. 2 2 - - - - -
Springfield, Mass. 37 26 9 1 1 - 4
Waterbury, Conn. 37 29 7 1 - - 4
Worcester, Mass. 72 51 15 3 1 2 11
MID. ATLANTIC 2,439 1,756 432 176 38 37 188
Albany, N.Y. 51 40 11 - - - 4
Allentown, Pa. 26 18 5 3 - - -
Buffalo, N.Y. U U U U U U U
Camden, N.J. 47 26 11 4 3 3 4
Elizabeth, N.J. U U U U U U U
Erie, Pa. 44 38 6 - - - 3
Jersey City, N.J. 38 29 6 1 - 2 2
New York City, N.Y. 1,322 907 261 118 20 16 73
Newark, N.J. 47 28 8 9 1 1 4
Paterson, N.J. 18 14 1 3 - - -
Philadelphia, Pa. 300 220 48 17 6 9 25
Pittsburgh, Pa.*** 87 66 17 2 - 2 11
Reading, Pa. 28 21 4 3 - - 5
Rochester, N.Y. 168 130 21 8 6 3 24
Schenectady, N.Y. 24 18 5 1 - - 2
Scranton, Pa. 29 26 3 - - - 2
Syracuse, N.Y. 166 136 21 6 2 1 25
Trenton, N.J. 21 17 3 1 - - 3
Utica, N.Y. 23 22 1 - - - 1
Yonkers, N.Y. U U U U U U U
E.N. CENTRAL 2,280 1,576 451 137 55 60 180
Akron, Ohio 64 48 11 2 1 2 -
Canton, Ohio 33 26 4 1 1 1 5
Chicago, Ill. 442 279 97 32 17 16 43
Cincinnati, Ohio 158 102 38 8 3 7 19
Cleveland, Ohio 137 94 28 8 3 4 2
Columbus, Ohio 185 122 42 10 3 8 18
Dayton, Ohio 145 111 23 7 1 3 13
Detroit, Mich. 252 153 69 21 3 6 10
Evansville, Ind. 43 31 5 4 3 - 2
Fort Wayne, Ind. 55 43 11 1 - - 7
Gary, Ind. U U U U U U U
Grand Rapids, Mich. 69 51 13 2 1 2 8
Indianapolis, Ind. 243 179 36 18 5 5 -
Lansing, Mich. 31 24 5 2 - - 4
Milwaukee, Wis. 166 120 30 9 4 3 21
Peoria, Ill. 37 29 4 1 3 - 8
Rockford, Ill. 58 42 13 3 - - 5
South Bend, Ind. 42 32 4 2 3 1 -
Toledo, Ohio 120 90 18 6 4 2 15
Youngstown, Ohio U U U U U U U
W.N. CENTRAL 786 566 131 38 25 12 77
Des Moines, Iowa U U U U U U U
Duluth, Minn. 24 19 3 2 - - 1
Kansas City, Kans. 43 23 14 4 1 1 1
Kansas City, Mo. 133 86 17 6 7 3 7
Lincoln, Nebr. 33 27 4 - 2 - 3
Minneapolis, Minn. 179 134 28 10 4 3 25
Omaha, Nebr. 102 74 16 4 5 3 7
St. Louis, Mo. 59 45 7 2 3 2 8
St. Paul, Minn. 108 81 19 6 2 - 19
Wichita, Kans. 105 77 23 4 1 - 6
S. ATLANTIC 1,265 829 257 118 37 22 91
Atlanta, Ga. U U U U U U U
Baltimore, Md. 213 128 48 28 4 4 25
Charlotte, N.C. 123 88 19 10 4 2 15
Jacksonville, Fla. 149 92 34 11 5 6 4
Miami, Fla. 102 64 24 9 5 - 1
Norfolk, Va. 67 39 16 3 3 6 6
Richmond, Va. 90 59 18 11 2 - 4
Savannah, Ga. 47 32 9 5 1 - 6
St. Petersburg, Fla. 68 52 6 7 3 - 3
Tampa, Fla. 217 158 44 10 3 2 19
Washington, D.C. 189 117 39 24 7 2 8
Wilmington, Del. U U U U U U U
E.S. CENTRAL 946 642 188 63 31 15 85
Birmingham, Ala. 227 158 41 14 6 1 25
Chattanooga, Tenn. 68 50 10 6 2 - 3
Knoxville, Tenn. 115 74 29 8 3 1 12
Lexington, Ky. 88 63 20 2 - 3 9
Memphis, Tenn. 169 115 34 10 8 2 17
Mobile, Ala. 49 36 8 4 1 - 1
Montgomery, Ala. 49 31 10 4 1 3 14
Nashville, Tenn. 181 115 36 15 10 5 4
W.S. CENTRAL 1,675 1,109 348 136 45 37 125
Austin, Tex. 61 38 11 8 3 1 8
Baton Rouge, La. 62 36 14 5 5 2 4
Corpus Christi, Tex. 79 59 12 4 1 3 5
Dallas, Tex. 190 125 39 19 5 2 7
El Paso, Tex. 100 67 22 4 2 5 8
Ft. Worth, Tex. 127 80 29 10 3 5 6
Houston, Tex. 422 254 113 36 13 6 29
Little Rock, Ark. 74 53 9 4 1 7 5
New Orleans, La. 103 61 24 15 2 1 -
San Antonio, Tex. 230 167 39 15 6 3 20
Shreveport, La. 83 64 11 6 2 - 14
Tulsa, Okla. 144 105 25 10 2 2 19
MOUNTAIN 982 695 169 70 28 19 88
Albuquerque, N.M. 98 75 13 6 2 2 7
Boise, Idaho 35 23 5 1 4 2 -
Colo. Springs, Colo. 54 44 5 5 - - 4
Denver, Colo. 128 79 27 11 6 5 17
Las Vegas, Nev. 234 157 46 22 5 4 11
Ogden, Utah 28 20 6 1 - 1 1
Phoenix, Ariz. 61 44 7 6 2 1 4
Pueblo, Colo. 34 30 1 3 - - 4
Salt Lake City, Utah 131 89 29 5 6 2 16
Tucson, Ariz. 179 134 30 10 3 2 24
PACIFIC 2,171 1,619 348 137 31 35 217
Berkeley, Calif. 12 11 1 - - - -
Fresno, Calif. 104 81 16 3 1 3 6
Glendale, Calif. 39 36 1 2 - - 2
Honolulu, Hawaii 90 66 15 6 - 3 9
Long Beach, Calif. 101 71 17 7 2 4 11
Los Angeles, Calif. 603 452 97 36 10 8 70
Pasadena, Calif. 26 18 5 3 - - 4
Portland, Oreg. 156 116 24 14 1 1 7
Sacramento, Calif. 188 130 37 15 3 3 31
San Diego, Calif. 180 130 30 15 1 3 12
San Francisco, Calif. 138 103 21 9 2 3 17
San Jose, Calif. 211 145 46 11 6 3 22
Santa Cruz, Calif. 32 29 1 2 - - 6
Seattle, Wash. 130 100 17 9 2 2 5
Spokane, Wash. 57 46 9 - 2 - 5
Tacoma, Wash. 104 85 11 5 1 2 10
TOTAL 13,203**** 9,280 2,431 920 297 249 1,111
---------------------------------------------------------------------------------------------------------------
U: Unavailable -: no reported cases
* Mortality data in this table are voluntarily reported from 122 cities in the United States, most of which have populations
of 100,000 or more. A death is reported by the place of its occurrence and by the week that the death certificate was
filed. Fetal deaths are not included.
** Pneumonia and influenza.
*** Because of changes in reporting methods in this Pennsylvania city, these numbers are partial counts for the current
week. Complete counts will be available in 4 to 6 weeks.
**** Total includes unknown ages.
===================================================================================================================================
Return to top. Disclaimer All MMWR HTML versions of articles are electronic conversions from ASCII text into HTML. This conversion may have resulted in character translation or format errors in the HTML version. Users should not rely on this HTML document, but are referred to the electronic PDF version and/or the original MMWR paper copy for the official text, figures, and tables. An original paper copy of this issue can be obtained from the Superintendent of Documents, U.S. Government Printing Office (GPO), Washington, DC 20402-9371; telephone: (202) 512-1800. Contact GPO for current prices. **Questions or messages regarding errors in formatting should be addressed to mmwrq@cdc.gov.Page converted: 10/05/98 |
|||||||||
This page last reviewed 5/2/01
|