 |
|
|
|
|
|
|
| ||||||||||
|
|
|
|
|
|
|
||||
| ||||||||||
|
|
|
|
|
Persons using assistive technology might not be able to fully access information in this file. For assistance, please send e-mail to: mmwrq@cdc.gov. Type 508 Accommodation and the title of the report in the subject line of e-mail. HIV/AIDS Among American Indians and Alaskan Natives -- United States, 1981-1997A total of 641,086 cases of acquired immunodeficiency syndrome (AIDS) had been reported to CDC through December 1997. Of these, 1783 (0.3%) occurred in American Indians and Alaskan Natives (AI/ANs). AI/ANs represent less than 1% of the total U.S. population (272 million persons) and are characteristically diverse, comprising many tribes -- of which 557 are federally recognized (1). Each tribe has its own traditions and culture. This report * 1) describes characteristics of AI/ANs with AIDS reported to CDC through 1997; 2) summarizes trends in AIDS incidence among AI/ANs from 1986 to 1996; and 3) for the 25 states in which surveillance was conducted during 1994-1997 for human immunodeficiency virus (HIV) and AIDS, compares the characteristics of AI/ANs who had reported HIV infection (without AIDS) with those of AI/ANs who had AIDS. These findings, which highlight the characteristics of AI/ANs for whom HIV or AIDS had been diagnosed, can assist in the development of targeted prevention strategies. Trends in AIDS incidence among AI/ANs aged greater than or equal to 13 years were evaluated using estimated incidence of AIDS-opportunistic illness (AIDS-OI) adjusted for reporting delays, unreported risk/exposure, and changes in 1993 in the AIDS case definition for persons aged greater than or equal to 13 years (2). Trends in estimated incidence of AIDS-OI were analyzed by 6-month interval of diagnosis for January 1986-December 1996 (i.e., the most recent date for which AIDS-OI incidence could be estimated reliably). Estimated AIDS-OI incidence rates per 100,000 population by sex, race/ethnicity, and year of diagnosis were calculated using Bureau of Census population estimates for 1986-1996 (3,4). For the 25 states in which HIV case surveillance was conducted during 1994-1997 (i.e., the years for which comparable data were available by sex, age, and HIV-exposure mode), characteristics of AI/ANs who had HIV (without AIDS) were compared with those who had AIDS. Characteristics of AI/ANs Who Had AIDS Of the cumulative total of 1783 AI/ANs reported with AIDS to CDC through December 1997, 1756 (98%) were aged greater than or equal to 13 years (Table_1). Compared with the total number of persons with reported cases of AIDS in the United States, a higher percentage of AI/ANs with AIDS were aged 20-29 years (23% versus 17%, respectively), and a lower percentage were aged 40-49 years (21% versus 25%). More than half (53%) of AI/ANs with AIDS resided in five states at the time of their AIDS diagnosis: California (25%), Oklahoma (11%), Washington (7%), Arizona (6%), and Alaska (4%). The five metropolitan statistical areas with the highest percentages of AI/ANs with AIDS were San Francisco, California (6%); Los Angeles-Long Beach, California (6%); Seattle-Bellevue-Everett, Washington (4%); Tulsa, Oklahoma (4%); and San Diego, California (3%). Compared with all persons who have AIDS, a lower proportion of AI/ANs resided in metropolitan areas with populations greater than 1,000,000 (56% versus 77%, respectively), and a higher proportion resided in rural areas with populations less than 50,000 (19% versus 6%, respectively). The risk/exposure group characteristics of AI/ANs were similar to those of all persons with AIDS in the United States; the most frequently reported mode of HIV exposure was men who have sex with men (MSM) for 49% of AI/ANs with AIDS and for 48% of all AIDS patients (Table_1). However, a larger percentage of AIDS cases in AI/ANs were associated with MSM who also were injecting-drug users (IDUs) (MSM/ IDUs) in comparison with AIDS cases in all patients (14% versus 6%). A smaller percentage of AIDS cases in AI/ANs were associated with only injecting-drug use in comparison with AIDS cases in all patients (20% versus 25%). Trends in AIDS-OI Incidence The estimated number of AIDS-OI cases among AI/ANs aged greater than or equal to 13 years increased steadily from 1986 (30 cases) through 1994 (200 cases), then stabilized during 1995-1996 (Figure_1). In 1996, the estimated AIDS-OI incidence rate was 10 cases per 100,000 population for AI/ANs; this rate was similar to the rate for non-Hispanic whites (11 per 100,000). The rate was seven times higher for non-Hispanic blacks (76 per 100,000) and three times higher for Hispanics (34 per 100,000) than for AI/ANs. As in other racial/ethnic groups, estimated AIDS-OI incidence rates per 100,000 population for AI/ANs increased during the surveillance period and differed substantially by sex (Figure_2). In 1996, the rate was four times higher for men (22 per 100,000) than for women (five per 100,000). Rates for men decreased slightly from 1994 to 1996 (from 25 to 22 per 100,000). Among men, the proportion of AIDS-OI cases by risk/ exposure category was stable during 1994-1996: for MSM, the range was 53%-58%; for IDUs, 16%-19%; and for MSM/IDUs, 14%-20%. Among women, the number of AIDS-OI cases each year was small, although the proportion of cases that occurred in women and were attributed to heterosexual contact increased slightly. Comparison of AI/ANs Who Had HIV Infection (Without AIDS) with AI/ANs Who Had AIDS During 1994-1997, 25 states that conducted surveillance for both HIV and AIDS reported 267 cases of HIV (without AIDS) and 327 cases of AIDS in AI/ANs aged greater than or equal to 13 years (Table_2). The percentage distribution of selected characteristics of AI/ANs who had HIV (without AIDS) was compared with the percentage of AI/ANs who had AIDS. A higher percentage of HIV (without AIDS) cases occurred in women (33% versus 21%); in adolescents (5% versus 1%); and in persons aged 20-29 years (40% versus 21%). A higher percentage of AIDS cases occurred in MSM (41% of AIDS cases versus 30% of HIV {without AIDS} cases), and a lower percentage occurred in persons whose exposure category was heterosexual contact (13% of AIDS cases versus 18% of HIV {without AIDS} cases). The risk/exposure was not reported for 20% of AI/ANs who had HIV (without AIDS) and 12% of AI/ANs who had AIDS. The percentage of patients for whom HIV infection was diagnosed in a hospital setting was similar for AI/ANs and non-AI/ANs (30% versus 29%, respectively). However, AI/ANs with HIV were less likely to have had the infection diagnosed by private physicians (13%) than non-AI/ANs (20%). Reported by: State and local health depts. Div of HIV/AIDS Prevention-Surveillance and Epidemiology, National Center for HIV, STD and TB Prevention; and an EIS Officer, CDC. Editorial NoteEditorial Note: The incidence of AIDS among AI/ANs increased through the early 1990s and leveled off during 1995-1996. Compared with all persons with AIDS in the United States, AIDS among AI/ANs was geographically clustered in selected areas in the West and in smaller cities and rural areas. AI/ANs who had AIDS were relatively younger than all persons with AIDS. The higher percentage of AI/ANs aged 13-29 years who had HIV (without AIDS) suggests that these persons were infected more recently than AI/ANs who had AIDS. These HIV and AIDS surveillance data should be used by public health officials and HIV prevention community planning groups as a basis for public health programs directed at AI/ANs to prevent HIV transmission, particularly in states that have reported the largest numbers of AI/ANs with HIV/AIDS. The AI/AN population is disproportionately affected by many of the social and behavioral factors associated with increased risk for HIV infection. The AI/AN population is relatively young (median age: 24.2 years) in comparison with the U.S. population (median age: 32.9 years). The AI/AN population is disadvantaged socioeconomically: 31.6% live below poverty level, compared with 13.1% for all races in the United States; 16.2% of AI/AN men and 13.4% of AI/AN women are unemployed, compared with 6.4% of men and 6.2% of women in the total U.S. population (5). AI/ANs also have high rates of sexually transmitted diseases. During 1984-1988, AI/ANs in the 13 states in which the AI/AN population was greater than 20,000 had more than twice the average rate of gonorrhea and syphilis cases compared with non-AI/ANs (6). AI/AN adolescents residing on reservations have high rates of drug use compared with non-AI/AN adolescents (7). These factors emphasize the multiple challenges of developing HIV-risk reduction interventions for this population. During 1995-1996, the incidence of AIDS-OI leveled among AI/ANs. This leveling may reflect 1) the overall decline in the growth rate of the AIDS epidemic in the United States, which has been attributed to a decline in the rate of new HIV infections, and 2) delays in AIDS-OI incidence among HIV-infected AI/ANs who are receiving anti-retroviral therapy and OI prophylaxis (8). AIDS-OI incidence also has leveled among other racial/ethnic minorities (i.e., non-Hispanic blacks and Hispanics) (8). To maximize opportunities to benefit from new treatment advances, timely access to HIV counseling and testing, early access to care, and treatment services are critical. These surveillance findings suggest that HIV-infected AI/ANs, who disproportionately reside in rural areas (including reservations), may have reduced access to facilities for HIV diagnosis and treatment, and medical and public health staff in these areas may have less experience with the currently recommended practices for HIV prevention and care. AI/ANs who had AIDS were more than twice as likely to be classified in the MSM/ IDU risk category compared with all persons who had AIDS in the United States. In addition, HIV surveillance data reflect more recent HIV transmission among AI/ANs who were young, who were female, and who engaged in high-risk sex or drug-use behaviors. These surveillance findings highlight the need for a variety of HIV-prevention strategies for AI/ANs and the importance of early access to HIV-testing and care services for this population. One limitation of these data was the possible underrepresentation of the impact of the HIV/AIDS epidemic among AI/ANs because of misclassification of AI/ANs to other racial/ethnic populations (i.e., previous reports have indicated high rates of misclassification of AI/ANs to non-Hispanic white or Hispanic categories {9}). Because information about tribal affiliation of AI/ANs is not collected, efforts to develop culturally appropriate prevention messages are limited. States in which the AI/AN population is large can benefit from enhanced surveillance efforts that supplement HIV/AIDS surveillance data and collect information about socioeconomic status, education, cultural affiliation, HIV-related risk behavior(s), and access to health care (10). Despite potential biases of self-selection for HIV testing and overrepresentation of groups targeted for voluntary screening, HIV surveillance data represent persons at an earlier stage in the course of HIV disease than those represented by AIDS surveillance data. HIV surveillance data can facilitate identification of priority groups in need of HIV-prevention and care services. Prevention planning groups at the community level should direct HIV-prevention efforts for AI/ANs to target specific risk behaviors, taking into account the cultural diversity and traditional beliefs of AI/ANs in both rural and urban communities. References
Single copies of this report will be available until March 6, 1999, from the CDC National AIDS Clearinghouse, P.O. Box 6003, Rockville, MD 20849-6003; telephone (800) 458-5231 or (301) 519-0459. Table_1 Note: To print large tables and graphs users may have to change their printer settings to landscape and use a small font size.
TABLE 1. Reported percentage * of American Indians and Alaskan Natives (AI/ANs) and
of all persons who had AIDS, by selected characteristics -- United States, cases
reported through December 1997
==========================================================================================================
                                % of AI/ANs with AIDS                  % of all persons with AIDS
                           --------------------------------     ----------------------------------------
                             Male      Female       Total          Male         Female          Total
Characteristic             (N=1,491)   (N=292)    (N=1,783)     (N=538,703)   (N=102,383)    (N=641,086)
--------------------------------------------------------------------------------------------------------
Age group (yrs) +
    <13                         1          4            2              1             4              1
  13-19                         1         <1            1             <1             1             <1
  20-29                        23         24           23             17            22             17
  30-39                        48         44           48             45            44             45
  40-49                        21         18           21             26            21             25
  50-59                         4          7            4              8             6              7
   >=60                         1          2            2              3             3              3

Region &
  Northeast                     8         10            8             29            44             31
  Midwest                      12         21           13              9             7             10
  South                        25         22           25             34            35             34
  West                         55         47           54             24             9             22
  U.S. territories              0          0            0              3             5              3

HIV-exposure category
  Men who have sex
    with men                   58         --           49             57            --             48
  Injecting-drug use           15         44           20             22            42             25
  Men who have sex
    with men and
    inject drugs               16         --           14              8            --              6
  Hemophilia/
    Coagulation disorder        2         <1            1              1            <1              1
  Heterosexual contact          2         36            8              4            38              9
  Receipt of blood or
    blood products              1          5            1              1             3              1
  Mother who had or
    was at risk for HIV
    infection                   1          5            1              1             4              1
  Risk not reported or
    not identified              5         11            6              7            13              8

Population of
  metropolitan
  statistical area
       >1,000,000              56         56           56             77            76             77
  500,000-999,999              12         12           12              7             8              7
   50,000-499,999              13          9           12             10            10             10
          <50,000              18         23           19              6             6              6
          Unknown               1         <1            1             <1            <1             <1
--------------------------------------------------------------------------------------------------------
* Percentages may not add to 100% because of rounding.
+ Age at time of diagnosis.
& Northeast: Connecticut, Maine, Massachusetts, New Hampshire, New Jersey, New York, Penn-
  sylvania, Rhode Island, and Vermont; Midwest: Illinois, Indiana, Iowa, Kansas, Michigan, Min-
  nesota, Missouri, Nebraska, North Dakota, Ohio, South Dakota, and Wisconsin; South:
  Alabama, Arkansas, Delaware, District of Columbia, Florida, Georgia, Kentucky, Louisiana,
  Maryland, Mississippi, North Carolina, Oklahoma, South Carolina, Tennessee, Texas, Virginia,
  and West Virginia; and West: Alaska, Arizona, California, Colorado, Hawaii, Idaho, Montana,
  Nevada, New Mexico, Oregon, Utah, Washington, and Wyoming. For all persons with AIDS,
  region was unknown for 336 males and 49 females.
==========================================================================================================
Return to top. Figure_1 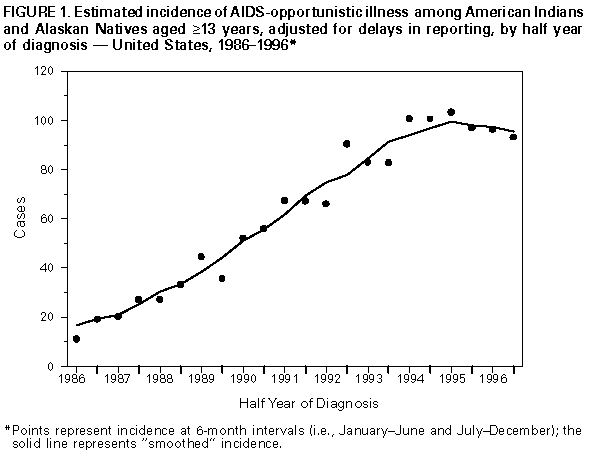 Return to top. Figure_2 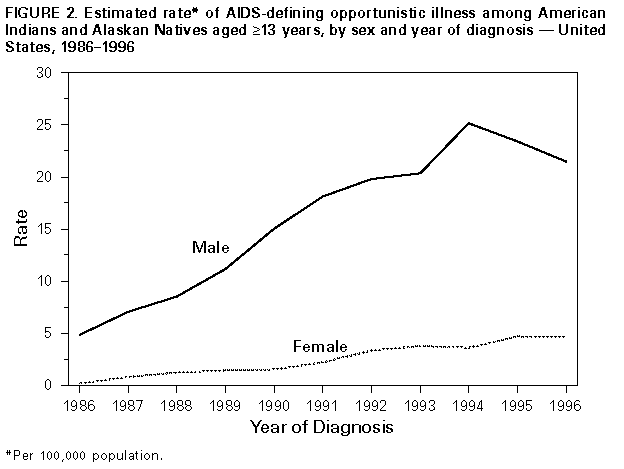 Return to top. Table_2 Note: To print large tables and graphs users may have to change their printer settings to landscape and use a small font size.
TABLE 2. Reported number and percentage of American Indians and Alaskan Natives
(AI/ANs) aged >= years who had HIV infection (without AIDS), compared with those
who had AIDS, by selected characteristics -- 25 states,* 1994-1997
===============================================================================================
                                           AI/ANs with HIV         AI/ANs with AIDS
                                          ------------------       ----------------
Characteristic                               No.       (%)         No.        (%)
-----------------------------------------------------------------------------------
Sex
  Male                                       180     ( 67.4)       259      ( 79.2)
  Female                                      87     ( 32.6)        68      ( 20.8)

Age group (yrs)
  13-19                                       14     (  5.2)         2      (  0.6)
  20-29                                      106     ( 39.7)        68      ( 20.8)
  30-39                                      102     ( 38.2)       165      ( 50.5)
  40-49                                       37     ( 13.9)        79      ( 24.2)
  50-59                                        6     (  2.2)        11      (  3.4)
   >=60                                        2     (  0.8)         2      (  0.6)

HIV-exposure category
  Men who have sex with men                   81     ( 30.3)       134      ( 41.0)
  Injecting-drug use                          52     ( 19.5)        67      ( 20.5)
  Men who have sex with men and
    inject drugs                              31     ( 11.6)        35      ( 10.7)
  Hemophilia/Coagulation disorder              0     (  0.0)         7      (  2.1)
  Heterosexual contact                        48     ( 18.0)        43      ( 13.1)
  Receipt of blood or blood products           1     (  0.4)         1      (  0.3)
  Risk not reported or not identified         54     ( 20.2)        40      ( 12.2)

Total                                        267     (100.0)       327      (100.0)
-----------------------------------------------------------------------------------
* Alabama, Arizona, Arkansas, Colorado, Idaho, Indiana, Louisiana, Michigan, Minnesota, Mis-
  sissippi, Missouri, Nevada, New Jersey, North Carolina, North Dakota, Ohio, Oklahoma, South
  Carolina, South Dakota, Tennessee, Utah, Virginia, West Virginia, Wisconsin, and Wyoming.
===============================================================================================
Return to top. Disclaimer All MMWR HTML versions of articles are electronic conversions from ASCII text into HTML. This conversion may have resulted in character translation or format errors in the HTML version. Users should not rely on this HTML document, but are referred to the electronic PDF version and/or the original MMWR paper copy for the official text, figures, and tables. An original paper copy of this issue can be obtained from the Superintendent of Documents, U.S. Government Printing Office (GPO), Washington, DC 20402-9371; telephone: (202) 512-1800. Contact GPO for current prices. **Questions or messages regarding errors in formatting should be addressed to mmwrq@cdc.gov.Page converted: 10/05/98 |
|||||||||
This page last reviewed 5/2/01
|