 |
|
|
|
|
|
|
| ||||||||||
|
|
|
|
|
|
|
||||
| ||||||||||
|
|
|
|
|
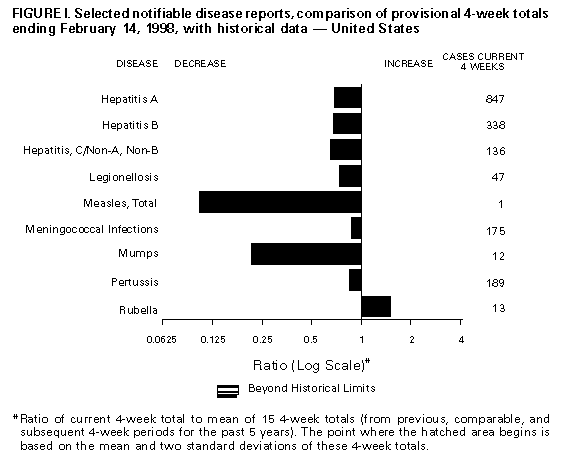
Persons using assistive technology might not be able to fully access information in this file. For assistance, please send e-mail to: mmwrq@cdc.gov. Type 508 Accommodation and the title of the report in the subject line of e-mail. Notifiable Diseases/Deaths in Selected Cities Weekly InformationFigure_I Selected notifiable disease reports, comparison of provisional 4-week totals ending February 14, 1998, with historical data -- United States Table_I Summary -- provisional cases of selected notifiable diseases, United States, cumulative, week ending February 14, 1998 (6th Week) Table_II Provisional cases of selected notifiable diseases, United States, weeks ending February 14, 1998 and February 8, 1997 (6th Week) Table_III Provisional cases of selected notifiable diseases preventable by vaccination, United States, weeks ending February 14, 1998 and February 8, 1997 (6th Week) Table_IV Deaths in 122 U.S. cities, week ending
February 14, 1998 (6th Week)
TABLE I. Summary -- provisional cases of specified notifiable diseases, United
States, cumulative, week ending February 14, 1998 (6th Week)
==================================================================================
                                             Cum. 1998
------------------------------------------------------
Anthrax                                              -
Brucellosis                                          3
Cholera                                              -
Congenital rubella syndrome                          -
Cryptosporidiosis*                                 141
Diphtheria                                           -
Encephalitis:  California*                           2
               eastern equine*                       -
               St. Louis*                            -
               western equine*                       -
Hansen Disease                                       9
Hantavirus pulmonary syndrome*+                      -
Hemolytic uremic syndrome, post-diarrheal*           1
HIV infection, pediatric*&                          22
Plague                                               -
Poliomyelitis, paralytic@                            -
Psittacosis                                          6
Rabies, human                                        -
Rocky Mountain spotted fever (RMSF)                  7
Streptococcal disease, invasive Group A            168
Streptococcal toxic-shock syndrome*                  9
Syphilis, congenital**                               -
Tetanus                                              1
Toxic-shock syndrome                                10
Trichinosis                                          1
Typhoid fever                                       29
Yellow fever                                         -
------------------------------------------------------
-: no reported cases
 * Not notifiable in all states
 + Updated weekly from reports to the Division of Viral and Rickettsial
   Diseases, National Center for Infectious Diseases (NCID).
 & Updated monthly to the Division of HIV/AIDS Prevention -- Surveillance
   and Epidemiology, National Center for HIV, STD, and TB Prevention
   (NCHSTP), last update January 15, 1998.
 @ One suspected case(s) of polio with onset in 1998 have also been reported
   to date.
** Updated from reports to the Division of STD Prevention, NCHSTP.

==================================================================================
Return to top. Table_II Note: To print large tables and graphs users may have to change their printer settings to landscape and use a small font size.
TABLE II. (page 1) Provisional cases of selected notifiable diseases, United States, weeks ending
February 14, 1998, and February 8, 1997 (6th Week)
Escherichia
coli O157:H7
------------------- Hepatitis
AIDS* Chlamydia NETSS** PHLIS*** Gonorrhea C\NA,NB
----------------- -------------------- -------- -------- ------------------- ----------------
Cum. Cum. Cum. Cum. Cum. Cum. Cum. Cum. Cum. Cum.
Reporting Area 1998 1997 1998 1997 1998 1998 1998 1997 1998 1997
------------------------------------------------------------------------------------------------------------------------------
UNITED STATES 3,171 5,933 42,645 45,337 71 21 29,229 30,842 201 283
NEW ENGLAND 64 133 2,089 1,897 8 5 593 686 1 5
Maine 2 13 117 75 - - 7 4 - -
N.H. - 1 77 95 2 2 11 29 - -
Vt. 5 7 32 42 - - 1 8 - -
Mass. 6 61 1,025 845 5 3 265 280 1 5
R.I. 12 19 290 230 1 - 43 57 - -
Conn. 39 32 548 610 - - 266 308 - -
MID. ATLANTIC 902 1,925 5,588 5,693 2 - 3,354 3,732 22 21
Upstate N.Y. 114 117 N N 2 - 190 580 20 12
N.Y. City 490 1,033 3,292 3,049 - - 1,643 1,512 - -
N.J. 135 473 117 1,180 - - 377 771 - -
Pa. 163 302 2,179 1,464 N - 1,144 869 2 9
E.N. CENTRAL 203 373 8,542 7,483 16 2 6,853 4,938 48 74
Ohio 32 92 2,801 2,524 6 - 1,765 1,708 3 4
Ind. 39 25 981 854 5 - 720 672 1 1
Ill. 102 115 2,143 1,256 5 - 1,943 625 1 10
Mich. 15 118 2,391 1,558 - - 2,304 1,366 43 59
Wis. 15 23 226 1,291 N 3 121 567 - -
W.N. CENTRAL 55 187 2,594 3,418 5 3 987 1,469 4 13
Minn. 15 17 482 815 3 4 213 292 - -
Iowa 6 36 39 606 1 - 13 158 3 1
Mo. 19 112 1,167 1,143 - 1 439 710 1 9
N. Dak. - 2 1 105 - - 1 6 - 1
S. Dak. 4 - 199 110 - - 27 15 - -
Nebr. 9 13 77 186 - - 13 63 - -
Kans. 2 7 629 453 1 - 281 225 - 2
S. ATLANTIC 793 1,543 10,437 8,743 16 1 8,991 9,527 14 21
Del. 13 20 228 - - - 175 120 - -
Md. 53 179 802 576 8 1 839 1,431 2 3
D.C. 83 117 N N - - 405 618 - -
Va. 39 131 1,382 1,173 N - 886 952 1 -
W. Va. 5 14 363 420 N - 105 129 - -
N.C. 45 59 2,030 2,236 4 - 1,764 1,926 4 8
S.C. 59 104 2,065 1,412 - - 1,472 1,500 - 9
Ga. 116 187 1,900 648 2 - 1,931 979 - -
Fla. 380 732 1,667 2,278 2 - 1,414 1,872 7 1
E.S. CENTRAL 156 134 3,937 3,675 2 1 4,167 4,138 9 26
Ky. 19 23 665 691 1 - 451 500 - -
Tenn. 52 58 1,550 1,275 - 1 1,479 1,223 8 11
Ala. 56 38 1,132 944 1 - 1,603 1,399 1 1
Miss. 29 15 590 765 - 1 634 1,016 - 14
W.S. CENTRAL 382 442 2,560 4,511 - - 2,244 3,480 - 20
Ark. 17 18 314 296 - - 589 506 - -
La. 67 85 1,392 630 - - 1,154 762 - 14
Okla. 14 32 854 557 - - 501 501 - -
Tex. 284 307 - 3,028 - - - 1,711 - 6
MOUNTAIN 88 139 1,953 2,335 6 4 838 802 60 36
Mont. 6 7 82 85 - - 4 6 3 2
Idaho 3 2 33 158 2 - - 15 14 9
Wyo. - 1 82 59 - - 6 6 34 13
Colo. 21 38 - 129 1 1 347 224 3 5
N. Mex. 9 4 496 485 2 1 92 99 2 3
Ariz. 33 28 1,035 972 N 2 361 332 - 3
Utah 13 16 215 137 1 - 25 18 3 -
Nev. 3 43 10 310 - - 3 102 1 1
PACIFIC 528 1,057 4,945 7,582 16 5 1,202 2,070 43 67
Wash. 34 45 1,189 994 - - 212 263 1 -
Oreg. 12 30 279 462 5 2 48 77 1 1
Calif. 477 961 3,108 5,818 11 4 874 1,616 17 46
Alaska - 16 167 160 - - 29 64 - -
Hawaii 5 5 202 148 N - 39 50 24 20
Guam - - 8 31 N - 2 3 - -
P.R. 88 144 U U 1 U 49 63 2 6
V.I. 1 4 N N N U - - - -
Amer. Samoa - - - - N U - - - -
C.N.M.I. - - N N N U 5 4 - 1
------------------------------------------------------------------------------------------------------------------------------
N: Not notifiable U: Unavailable -: no reported cases C.N.M.I.: Commonwealth of North Mariana Islands
* Updated monthly to the Division of HIV/AIDS Prevention, -- Surveillance and Epidemiology, National Center for HIV, STD,
and TB Prevention, last update January 15, 1998.
** National Electronic Telecommunications System for Surveillance.
*** Public Health Laboratory Information System.
=======================================================================================================================================================
TABLE II. (page 2) Provisional cases of selected notifiable diseases, United States, weeks ending
February 14, 1998, and February 8, 1997 (6th Week)
Lyme Syphilis Rabies,
Legionellosis Disease Malaria (Primary & Secondary) Tuberculosis Animal
---------------- ---------------- ---------------- --------------------- ----------------- -------
Cum. Cum. Cum. Cum. Cum. Cum. Cum. Cum. Cum. Cum. Cum.
Reporting Area 1998 1997 1998 1997 1998 1997 1998 1997 1998 * 1997 1998
-------------------------------------------------------------------------------------------------------------------------------------------
UNITED STATES 83 104 197 337 81 134 668 1,041 443 1,112 637
NEW ENGLAND 6 7 15 72 1 3 10 12 16 21 118
Maine - - - - - - - - U 2 15
N.H. 1 2 - 3 - 1 - - - - 11
Vt. - 1 - 2 - - - - - - 3
Mass. 2 3 13 8 1 1 10 5 12 6 38
R.I. 3 - 2 7 - 1 - - 4 3 12
Conn. - 1 - 52 - - - 7 U 10 39
MID. ATLANTIC 13 17 107 221 19 23 18 47 27 116 182
Upstate N.Y. 6 4 28 16 8 1 1 8 U 10 111
N.Y. City - - - 14 8 10 4 10 U 65 U
N.J. - 2 - 72 - 10 - 21 27 23 27
Pa. 7 11 79 119 3 2 13 8 U 18 44
E.N. CENTRAL 24 47 14 1 5 13 86 98 31 145 3
Ohio 16 27 14 - 1 1 29 30 5 41 3
Ind. 2 3 - - 1 2 8 22 U 13 -
Ill. - 1 - 1 - 5 30 14 26 89 -
Mich. 6 15 - - 3 5 15 14 U - -
Wis. - 1 U U - - 4 18 U 2 -
W.N. CENTRAL 6 6 1 - 1 1 10 27 11 25 51
Minn. - - - - - - - 7 U 13 9
Iowa - - 1 - 1 1 - 1 U 4 18
Mo. 4 3 - - - - 7 14 11 6 1
N. Dak. - - - - - - - - U 1 17
S. Dak. - - - - - - - - - 1 -
Nebr. 2 2 - - - - - - - - -
Kans. - 1 - - - - 3 5 U - 6
S. ATLANTIC 17 9 49 28 28 27 294 402 84 98 223
Del. 1 1 - 2 1 1 - 3 - 2 -
Md. 4 6 45 22 13 7 57 121 17 13 64
D.C. 2 1 2 3 3 2 7 14 13 6 -
Va. 2 - - - 2 8 32 27 5 16 54
W. Va. N N - - - - - - 9 6 7
N.C. 3 - - 1 3 1 77 83 40 24 39
S.C. 1 - - - - 3 38 51 U 2 9
Ga. - - 2 - 4 3 57 75 U 23 23
Fla. 4 1 - - 2 2 26 28 U 6 27
E.S. CENTRAL 1 4 6 10 2 5 132 229 - 84 17
Ky. - - - 1 - 1 13 13 U 14 1
Tenn. 1 1 5 2 1 1 71 89 U 29 8
Ala. - 1 1 - 1 1 35 64 U 32 8
Miss. - 2 - 7 - 2 13 63 U 9 -
W.S. CENTRAL - - - - 2 - 74 164 - 156 22
Ark. - - - - - - 21 25 - 11 1
La. - - - - 2 - 46 62 - - -
Okla. - - - - - - 7 20 U 14 21
Tex. - - - - - - - 57 U 131 -
MOUNTAIN 7 9 - - 7 9 26 24 22 18 8
Mont. - - - - - 1 - - - - 3
Idaho - - - - - - - - - - -
Wyo. - - - - - - - - - 1 5
Colo. 2 3 - - 3 5 2 - U 3 -
N. Mex. 1 - - - 3 - - - 6 - -
Ariz. - 3 - - - - 22 21 14 10 -
Utah 4 2 - - 1 - 2 - 2 1 -
Nev. - 1 - - - 3 - 3 U 3 -
PACIFIC 9 5 5 5 16 53 18 38 252 449 13
Wash. - 1 - - - - 1 - U 28 -
Oreg. - - - 2 3 2 1 1 U 14 -
Calif. 9 3 5 3 13 51 16 37 239 371 11
Alaska - - - - - - - - 4 11 2
Hawaii - 1 - - - - - - 9 25 -
Guam - - - - - - - - - 5 -
P.R. - - - - - 2 26 28 - - 5
V.I. - - - - - - - - - - -
Amer. Samoa - - - - - - - - - - -
C.N.M.I. - - - - - - 1 - 4 - -
-------------------------------------------------------------------------------------------------------------------------------------------
N: Not notifiable U: Unavailable -: no reported cases
* Additional information about areas displaying 'U' (e.g., Tuberculosis) can be found in Notices to Readers, MMWR Vol. 47, No. 2, p. 39.
=======================================================================================================================================================
Return to top. Table_III Note: To print large tables and graphs users may have to change their printer settings to landscape and use a small font size.
TABLE III. (page 1) Provisional cases of selected notifiable diseases preventable by vaccination, United
States, weeks ending February 14, 1998, and February 8, 1997 (6th Week)
Hepatitis (Viral), by type Measles (Rubeola)
H. influenzae, --------------------------------------- ------------------------------------------------------------
invasive A B Indigenous Imported** Total
---------------- ----------------- ----------------- --------------- --------------- ---------------
Cum. Cum. Cum. Cum. Cum. Cum. Cum. Cum. Cum. Cum.
Reporting Area 1998* 1997 1998 1997 1998 1997 1998 1998 1998 1998 1998 1997
-----------------------------------------------------------------------------------------------------------------------------------------------------
UNITED STATES 107 116 1,523 2,637 562 784 - - - 2 2 11
NEW ENGLAND 8 11 33 61 4 21 - - - 1 1 -
Maine - 2 7 2 - 1 - - - - - -
N.H. 1 2 1 1 2 1 - - - - - -
Vt. - - 1 3 - 1 - - - - - -
Mass. 7 6 4 28 - 13 - - - 1 1 -
R.I. - 1 4 2 2 1 - - - - - -
Conn. - - 16 25 - 4 - - - - - -
MID. ATLANTIC 12 18 62 246 67 130 - - - 1 1 4
Upstate N.Y. 4 1 32 11 25 13 - - - 1 1 2
N.Y. City 1 6 16 120 17 56 - - - - - 1
N.J. 7 8 2 49 - 28 - - - - - 1
Pa. - 3 12 66 25 33 - - - - - -
E.N. CENTRAL 12 17 245 316 82 148 - - - - - 1
Ohio 9 11 55 66 10 12 - - - - - -
Ind. 2 - 32 29 5 18 - - - - - -
Ill. - 5 3 113 1 48 - - - - - -
Mich. - 1 147 76 65 64 - - - - - 1
Wis. 1 - 8 32 1 6 - - - - - -
W.N. CENTRAL 2 4 170 179 28 55 - - - - - -
Minn. - 2 5 1 2 - - - - - - -
Iowa 1 - 73 28 5 3 - - - - - -
Mo. 1 2 86 108 18 45 - - - - - -
N. Dak. - - - - - - - - - - - -
S. Dak. - - 1 5 1 - - - - - - -
Nebr. - - 3 7 - 2 - - - - - -
Kans. - - 2 30 2 5 U - U - - -
S. ATLANTIC 30 21 145 161 77 73 - - - - - -
Del. - - - 6 - 1 - - - - - -
Md. 8 7 41 53 12 23 - - - - - -
D.C. - - 5 3 1 6 - - - - - -
Va. 3 1 19 18 5 9 - - - - - -
W. Va. 1 1 - 1 - 2 - - - - - -
N.C. 1 5 10 22 28 16 - - - - - -
S.C. - 2 5 10 - 7 - - - - - -
Ga. 7 2 26 23 12 - - - - - - -
Fla. 10 3 39 25 19 9 - - - - - -
E.S. CENTRAL 4 11 30 80 43 64 - - - - - 1
Ky. - - - 15 - 2 - - - - - -
Tenn. 4 6 17 37 32 47 - - - - - -
Ala. - 5 13 11 11 5 - - - - - 1
Miss. - - - 17 - 10 U - U - - -
W.S. CENTRAL 7 5 57 227 13 14 - - - - - -
Ark. - - 1 23 8 4 - - - - - -
La. 3 - 3 2 2 3 - - - - - -
Okla. 3 4 46 152 3 - - - - - - -
Tex. 1 1 7 50 - 7 U - U - - -
MOUNTAIN 23 7 364 470 101 95 - - - - - -
Mont. - - 6 14 1 - - - - - - -
Idaho - - 23 24 3 - - - - - - -
Wyo. - - 4 3 3 2 - - - - - -
Colo. 1 1 36 69 13 26 - - - - - -
N. Mex. - 1 24 25 34 31 - - - - - -
Ariz. 15 2 224 185 30 20 - - - - - -
Utah 2 1 25 118 8 11 - - - - - -
Nev. 5 2 22 32 9 5 U - U - - -
PACIFIC 9 22 417 897 147 184 - - - - - 5
Wash. - - 42 26 14 3 - - - - - -
Oreg. 8 5 41 57 12 14 - - - - - -
Calif. - 15 331 799 119 161 - - - - - 2
Alaska - - - 4 1 3 - - - - - -
Hawaii 1 2 3 11 1 3 - - - - - 3
Guam - - - - - 1 U - U - - -
P.R. - - - 22 8 55 - - - - - -
V.I. - - - - - - U - U - - -
Amer. Samoa - - - - - - U - U - - -
C.N.M.I. - 2 - 1 3 5 U - U - - -
-----------------------------------------------------------------------------------------------------------------------------------------------------
N: Not notifiable U: Unavailable -: no reported cases
* Of 21 cases among children aged <5 years, serotype was reported for 10 and of those, 5 were type b.
** For imported measles, cases include only those resulting from importation from other countries.
=======================================================================================================================================================
TABLE III. (page 2) Provisional cases of selected notifiable diseases preventable by vaccination, United
States, weeks ending February 14, 1998, and February 8, 1997 (6th Week)
Meningococcal
Disease Mumps Pertussis Rubella
----------------- -------------------------- --------------------------- ---------------------------
Cum. Cum. Cum. Cum. Cum. Cum. Cum. Cum.
Reporting Area 1998 1997 1998 1998 1997 1998 1998 1997 1998 1998 1997
------------------------------------------------------------------------------------------------------------------------------------------
UNITED STATES 311 447 - 28 40 61 363 515 2 14 5
NEW ENGLAND 26 30 - - - 1 72 181 - - -
Maine 1 2 - - - - 4 4 - - -
N.H. 1 3 - - - - 5 22 - - -
Vt. 1 - - - - 1 14 69 - - -
Mass. 10 20 - - - - 49 86 - - -
R.I. 3 1 - - - - - - - - -
Conn. 10 4 - - - - - - - - -
MID. ATLANTIC 27 35 - 1 4 5 26 27 - 10 1
Upstate N.Y. 9 6 - 1 - 5 26 15 - 10 -
N.Y. City 3 5 - - - - - 7 - - 1
N.J. 15 5 - - 2 - - 2 - - -
Pa. - 19 - - 2 - - 3 - - -
E.N. CENTRAL 39 71 - 4 7 5 31 61 - - 3
Ohio 26 30 - 3 2 5 23 30 - - -
Ind. 6 9 - - 2 - 1 - - - -
Ill. - 20 - - 1 - - 6 - - -
Mich. 4 5 - 1 2 - 7 16 - - -
Wis. 3 7 - - - - - 9 - - 3
W.N. CENTRAL 18 37 - - 2 15 26 14 - - -
Minn. - 2 - - - 12 18 3 - - -
Iowa 3 10 - - 2 3 6 4 - - -
Mo. 7 16 - - - - - - - - -
N. Dak. - - - - - - - 1 - - -
S. Dak. 3 1 - - - - - 1 - - -
Nebr. 1 3 - - - - 2 2 - - -
Kans. 4 5 U - - U - 3 U - -
S. ATLANTIC 64 76 - 9 1 9 38 27 - 1 -
Del. - 2 - - - - - - - - -
Md. 8 9 - 2 - - 6 22 - - -
D.C. - 2 - - - - - 2 - - -
Va. 7 4 - - - - - - - - -
W. Va. 2 3 - - - - - - - - -
N.C. 8 16 - 4 - - 23 - - 1 -
S.C. 5 17 - 2 - - - 2 - - -
Ga. 22 12 - - - - - - - - -
Fla. 12 11 - 1 1 9 9 1 - - -
E.S. CENTRAL 14 43 - - 6 1 11 13 - - -
Ky. - 9 - - - - - 2 - - -
Tenn. 14 16 - - 2 1 3 3 - - -
Ala. - 13 - - 2 - 8 5 - - -
Miss. - 5 U - 2 U - 3 U - -
W.S. CENTRAL 17 14 - 5 3 - 12 5 - 1 -
Ark. 2 4 - - - - 6 2 - - -
La. 4 1 - - - - - - - - -
Okla. 11 2 - - - - - - - - -
Tex. - 7 U 5 3 U 6 3 U 1 -
MOUNTAIN 26 28 - 1 4 23 132 117 2 2 -
Mont. 1 1 - - - - 1 - - - -
Idaho - 2 - - - 19 78 75 - - -
Wyo. 1 - - - - - - 3 - - -
Colo. 11 2 - - 1 2 12 27 - - -
N. Mex. 4 8 N N N 2 36 7 - - -
Ariz. 8 8 - 1 - - - 4 - - -
Utah 1 3 - - 1 - 4 - 2 2 -
Nev. - 4 U - 2 U 1 1 U - -
PACIFIC 80 113 - 8 13 2 15 70 - - 1
Wash. 12 9 - - 2 2 7 13 - - -
Oreg. 27 30 N N N - 8 4 - - -
Calif. 41 74 - 2 7 - - 51 - - 1
Alaska - - - 2 - - - 1 - - -
Hawaii - - - 4 4 - - 1 - - -
Guam - - U - 1 U - - U - -
P.R. - 2 - - 2 - - - - - -
V.I. - - U - - U - - U - -
Amer. Samoa - - U - - U - - U - -
C.N.M.I. - - U - - U - - U - -
------------------------------------------------------------------------------------------------------------------------------------------
N: Not notifiable U: Unavailable -: no reported cases
=======================================================================================================================================================
Return to top. Table_IV Note: To print large tables and graphs users may have to change their printer settings to landscape and use a small font size.
TABLE IV. Deaths in 122 U.S. cities,* week ending
February 14, 1998 (6th Week)
===================================================================================================================================
All Causes, By Age (Years)
------------------------------------------------------------------------ P&I**
Reporting Area All Ages >=65 45-64 25-44 1-24 <1 Total
---------------------------------------------------------------------------------------------------------------
NEW ENGLAND 579 448 88 27 13 3 74
Boston, Mass. 163 120 23 15 5 - 26
Bridgeport, Conn. 51 37 11 - 2 1 4
Cambridge, Mass. 32 25 7 - - - 5
Fall River, Mass. 34 31 3 - - - 3
Hartford, Conn. U U U U U U U
Lowell, Mass. 34 29 3 2 - - 7
Lynn, Mass. 11 9 2 - - - 2
New Bedford, Mass. 22 21 1 - - - 2
New Haven, Conn. 38 24 10 2 1 1 2
Providence, R.I. 55 41 13 - 1 - -
Somerville, Mass. - - - - - - -
Springfield, Mass. 57 44 7 3 2 1 6
Waterbury, Conn. U U U U U U U
Worcester, Mass. 82 67 8 5 2 - 17
MID. ATLANTIC 2,253 1,632 398 161 32 30 125
Albany, N.Y. 48 39 4 3 1 1 2
Allentown, Pa. 28 24 4 - - - 1
Buffalo, N.Y. 68 49 14 2 1 2 2
Camden, N.J. 26 19 2 3 1 1 1
Elizabeth, N.J. 19 14 3 2 - - -
Erie, Pa. 61 51 8 2 - - 7
Jersey City, N.J. 39 27 6 4 - 2 -
New York City, N.Y. 1,221 873 217 96 16 19 48
Newark, N.J. 62 32 17 12 1 - 1
Paterson, N.J. 27 17 6 2 2 - -
Philadelphia, Pa. 200 129 48 19 3 1 8
Pittsburgh, Pa.*** 81 63 10 4 4 - 7
Reading, Pa. 40 34 4 1 - 1 6
Rochester, N.Y. 123 98 19 4 1 1 12
Schenectady, N.Y. 17 13 3 1 - - 4
Scranton, Pa. 25 20 5 - - - 4
Syracuse, N.Y. 91 72 14 2 1 2 15
Trenton, N.J. 27 18 6 3 - - 3
Utica, N.Y. 19 17 2 - - - 1
Yonkers, N.Y. 31 23 6 1 1 - 3
E.N. CENTRAL 2,317 1,642 421 149 46 58 147
Akron, Ohio 77 59 12 5 1 - 1
Canton, Ohio 32 28 3 1 - - 4
Chicago, Ill. 378 248 76 38 8 7 25
Cincinnati, Ohio 114 86 18 2 2 6 14
Cleveland, Ohio 159 104 39 8 4 4 1
Columbus, Ohio 219 148 46 17 3 5 22
Dayton, Ohio 149 110 26 8 1 4 10
Detroit, Mich. 207 130 45 22 7 3 9
Evansville, Ind. 69 58 6 2 1 2 3
Fort Wayne, Ind. 69 48 13 5 1 2 3
Gary, Ind. 21 12 4 4 1 - -
Grand Rapids, Mich. 67 51 6 3 1 6 7
Indianapolis, Ind. 222 157 37 12 8 8 -
Lansing, Mich. 40 31 7 1 1 - 3
Milwaukee, Wis. 134 96 27 7 - 4 11
Peoria, Ill. 43 33 8 - 1 1 4
Rockford, Ill. 54 36 10 5 - 3 7
South Bend, Ind. 76 63 7 5 1 - 9
Toledo, Ohio 100 77 17 2 2 2 11
Youngstown, Ohio 87 67 14 2 3 1 3
W.N. CENTRAL 897 684 112 50 17 13 80
Des Moines, Iowa U U U U U U U
Duluth, Minn. 32 28 2 2 - - 5
Kansas City, Kans. 22 13 5 3 1 - -
Kansas City, Mo. 126 82 14 2 4 3 5
Lincoln, Nebr. 42 35 4 3 - - 3
Minneapolis, Minn. 253 197 30 18 2 6 31
Omaha, Nebr. 99 71 16 7 2 3 12
St. Louis, Mo. 118 95 16 6 1 - -
St. Paul, Minn. 108 89 11 3 5 - 18
Wichita, Kans. 97 74 14 6 2 1 6
S. ATLANTIC 1,188 772 246 112 38 17 88
Atlanta, Ga. U U U U U U U
Baltimore, Md. 230 140 45 34 6 3 23
Charlotte, N.C. 97 73 16 6 2 - 14
Jacksonville, Fla. 157 116 24 7 5 5 8
Miami, Fla. 98 55 25 15 2 1 -
Norfolk, Va. 27 17 6 2 1 1 1
Richmond, Va. 97 64 20 10 2 1 7
Savannah, Ga. 76 46 23 5 2 - 8
St. Petersburg, Fla. 69 49 10 5 3 1 4
Tampa, Fla. 214 142 45 14 10 3 20
Washington, D.C. 101 62 19 14 4 2 3
Wilmington, Del. 22 8 13 - 1 - -
E.S. CENTRAL 958 669 177 70 19 23 113
Birmingham, Ala. 222 164 37 11 4 6 26
Chattanooga, Tenn. 85 64 10 6 1 4 17
Knoxville, Tenn. 107 78 17 7 5 - 25
Lexington, Ky. 83 60 18 5 - - 8
Memphis, Tenn. 234 150 45 24 5 10 22
Mobile, Ala. 38 24 10 3 1 - 1
Montgomery, Ala. 33 22 9 1 - 1 8
Nashville, Tenn. 156 107 31 13 3 2 6
W.S. CENTRAL 1,690 1,161 331 114 54 30 131
Austin, Tex. 71 48 13 5 4 1 5
Baton Rouge, La. 38 20 11 5 2 - 2
Corpus Christi, Tex. 54 45 7 1 - 1 7
Dallas, Tex. 206 126 47 22 9 2 2
El Paso, Tex. 125 89 25 5 2 4 16
Ft. Worth, Tex. 108 73 20 9 4 2 7
Houston, Tex. 484 321 100 34 20 9 34
Little Rock, Ark. 90 55 22 7 2 4 4
New Orleans, La. 42 26 12 3 1 - -
San Antonio, Tex. 254 193 41 12 5 3 25
Shreveport, La. 87 64 15 5 1 2 11
Tulsa, Okla. 131 101 18 6 4 2 18
MOUNTAIN 1,188 823 213 94 30 27 117
Albuquerque, N.M. 111 74 18 12 5 2 4
Boise, Idaho 43 38 4 1 - - 6
Colo. Springs, Colo. 66 52 5 6 2 1 6
Denver, Colo. 147 99 29 10 4 5 26
Las Vegas, Nev. 295 194 69 21 6 4 19
Ogden, Utah 27 23 3 - 1 - 8
Phoenix, Ariz. 215 140 46 18 2 9 22
Pueblo, Colo. 22 17 2 3 - - 2
Salt Lake City, Utah 89 63 9 7 5 5 8
Tucson, Ariz. 173 123 28 16 5 1 16
PACIFIC 1,171 853 194 72 25 26 128
Berkeley, Calif. 22 14 8 - - - 4
Fresno, Calif. U U U U U U U
Glendale, Calif. U U U U U U U
Honolulu, Hawaii 85 64 16 2 - 3 9
Long Beach, Calif. 99 74 15 4 4 2 19
Los Angeles, Calif. U U U U U U U
Pasadena, Calif. U U U U U U U
Portland, Oreg. 81 59 10 9 - 3 2
Sacramento, Calif. U U U U U U U
San Diego, Calif. 184 123 36 13 5 7 15
San Francisco, Calif. 162 125 20 15 1 1 22
San Jose, Calif. 188 130 36 8 11 2 20
Santa Cruz, Calif. 37 30 5 1 1 - 4
Seattle, Wash. 155 109 26 13 2 5 11
Spokane, Wash. 59 46 11 1 - 1 9
Tacoma, Wash. 99 79 11 6 1 2 13
TOTAL 12,241**** 8,684 2,180 849 274 227 1,003
---------------------------------------------------------------------------------------------------------------
U: Unavailable -: no reported cases
* Mortality data in this table are voluntarily reported from 122 cities in the United States, most of which have populations
of 100,000 or more. A death is reported by the place of its occurrence and by the week that the death certificate was
filed. Fetal deaths are not included.
** Pneumonia and influenza.
*** Because of changes in reporting methods in this Pennsylvania city, these numbers are partial counts for the current
week. Complete counts will be available in 4 to 6 weeks.
**** Total includes unknown ages.
===================================================================================================================================
Return to top. Disclaimer All MMWR HTML versions of articles are electronic conversions from ASCII text into HTML. This conversion may have resulted in character translation or format errors in the HTML version. Users should not rely on this HTML document, but are referred to the electronic PDF version and/or the original MMWR paper copy for the official text, figures, and tables. An original paper copy of this issue can be obtained from the Superintendent of Documents, U.S. Government Printing Office (GPO), Washington, DC 20402-9371; telephone: (202) 512-1800. Contact GPO for current prices. **Questions or messages regarding errors in formatting should be addressed to mmwrq@cdc.gov.Page converted: 10/05/98 |
|||||||||
This page last reviewed 5/2/01
|