 |
|
|
|
|
|
|
| ||||||||||
|
|
|
|
|
|
|
||||
| ||||||||||
|
|
|
|
|
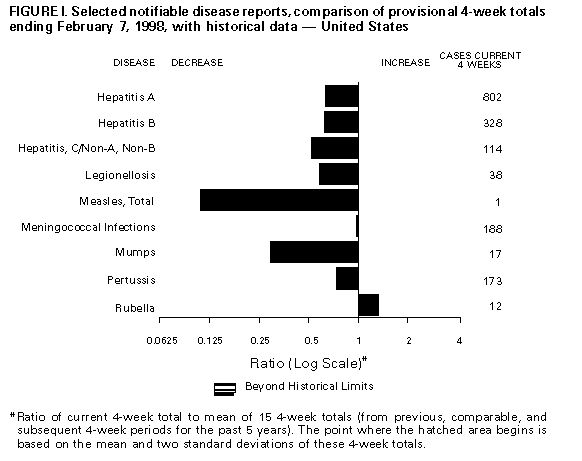
Persons using assistive technology might not be able to fully access information in this file. For assistance, please send e-mail to: mmwrq@cdc.gov. Type 508 Accommodation and the title of the report in the subject line of e-mail. Notifiable Diseases/Deaths in Selected Cities Weekly InformationFigure_I Selected notifiable disease reports, comparison of provisional 4-week totals ending February 7, 1998, with historical data -- United States Table_I Summary -- provisional cases of selected notifiable diseases, United States, cumulative, week ending February 7, 1998 (5th Week) Table_II Provisional cases of selected notifiable diseases, United States, weeks ending February 7, 1998 and February 1, 1997 (5th Week) Table_III Provisional cases of selected notifiable diseases preventable by vaccination, United States, weeks ending February 7, 1998 and February 1, 1997 (5th Week) Table_IV Deaths in 122 U.S. cities, week ending
February 7, 1998 (5th Week)
TABLE I. Summary -- provisional cases of specified notifiable diseases, United
States, cumulative, week ending February 7, 1998 (5th Week)
==================================================================================
                                             Cum. 1998
------------------------------------------------------
Anthrax                                              -
Brucellosis                                          3
Cholera                                              -
Congenital rubella syndrome                          -
Cryptosporidiosis*                                  99
Diphtheria                                           -
Encephalitis:  California*                           -
               eastern equine*                       -
               St. Louis*                            -
               western equine*                       -
Hansen Disease                                       6
Hantavirus pulmonary syndrome*+                      -
Hemolytic uremic syndrome, post-diarrheal*           1
HIV infection, pediatric*&                          22
Plague                                               -
Poliomyelitis, paralytic@                            -
Psittacosis                                          2
Rabies, human                                        -
Rocky Mountain spotted fever (RMSF)                  6
Streptococcal disease, invasive Group A            120
Streptococcal toxic-shock syndrome*                  8
Syphilis, congenital**                               -
Tetanus                                              2
Toxic-shock syndrome                                 6
Trichinosis                                          1
Typhoid fever                                       17
Yellow fever                                         -
------------------------------------------------------
-: no reported cases
 * Not notifiable in all states
 + Updated weekly from reports to the Division of Viral and Rickettsial
   Diseases, National Center for Infectious Diseases (NCID).
 & Updated monthly to the Division of HIV/AIDS Prevention -- Surveillance
   and Epidemiology, National Center for HIV, STD, and TB Prevention
   (NCHSTP), last update January 15, 1998.
 @ One suspected case(s) of polio with onset in 1998 have also been reported
   to date.
** Updated from reports to the Division of STD Prevention, NCHSTP.

==================================================================================
Return to top. Table_II Note: To print large tables and graphs users may have to change their printer settings to landscape and use a small font size.
TABLE II. (page 1) Provisional cases of selected notifiable diseases, United States, weeks ending
February 7, 1998, and February 1, 1997 (5th Week)
Escherichia
coli O157:H7
------------------- Hepatitis
AIDS* Chlamydia NETSS** PHLIS*** Gonorrhea C\NA,NB
----------------- -------------------- -------- -------- ------------------- ----------------
Cum. Cum. Cum. Cum. Cum. Cum. Cum. Cum. Cum. Cum.
Reporting Area 1998 1997 1998 1997 1998 1998 1998 1997 1998 1997
------------------------------------------------------------------------------------------------------------------------------
UNITED STATES 3,171 5,933 35,840 37,881 53 13 24,963 25,887 143 242
NEW ENGLAND 64 133 1,651 1,518 5 3 493 570 1 4
Maine 2 13 29 55 - - 6 3 - -
N.H. - 1 47 70 - 2 9 25 - -
Vt. 5 7 27 34 - - - 5 - -
Mass. 6 61 875 693 4 1 227 242 1 4
R.I. 12 19 241 179 1 - 36 49 - -
Conn. 39 32 432 487 - - 215 246 - -
MID. ATLANTIC 902 1,925 5,094 4,562 1 - 3,075 3,179 11 15
Upstate N.Y. 114 117 N N 1 - 102 579 9 10
N.Y. City 490 1,033 3,292 2,572 - - 1,643 1,323 - -
N.J. 135 473 57 939 - - 363 605 - -
Pa. 163 302 1,745 1,051 N - 967 672 2 5
E.N. CENTRAL 203 373 7,191 6,233 9 1 5,538 4,235 37 66
Ohio 32 92 2,366 2,010 5 - 1,429 1,416 2 3
Ind. 39 25 516 714 4 - 484 560 1 1
Ill. 102 115 2,143 968 - - 1,943 533 - 7
Mich. 15 118 1,940 1,476 - - 1,561 1,261 34 55
Wis. 15 23 226 1,065 N 2 121 465 - -
W.N. CENTRAL 55 187 2,192 2,834 5 3 851 1,223 5 10
Minn. 15 17 357 666 3 4 170 243 - -
Iowa 6 36 39 518 1 - 13 143 3 -
Mo. 19 112 956 999 - 1 355 607 2 8
N. Dak. - 2 - 82 - - - 5 - -
S. Dak. 4 - 149 78 - - 22 9 - -
Nebr. 9 13 62 147 - - 10 45 - -
Kans. 2 7 629 344 1 - 281 171 - 2
S. ATLANTIC 793 1,543 8,180 7,086 12 1 7,452 7,584 11 16
Del. 13 20 182 - - - 155 120 - -
Md. 53 179 648 453 5 1 764 1,099 2 3
D.C. 83 117 N N - - 366 478 - -
Va. 39 131 942 988 N - 741 770 1 -
W. Va. 5 14 293 347 N - 85 106 - -
N.C. 45 59 1,684 1,886 3 - 1,442 1,555 3 4
S.C. 59 104 1,689 961 - - 1,292 1,197 - 9
Ga. 116 187 1,643 593 2 - 1,653 723 - -
Fla. 380 732 1,099 1,858 2 - 954 1,536 5 -
E.S. CENTRAL 156 134 3,245 2,906 3 1 3,568 3,435 9 23
Ky. 19 23 498 574 1 - 389 435 - -
Tenn. 52 58 1,247 970 1 1 1,238 1,004 8 8
Ala. 56 38 910 703 1 - 1,307 1,129 1 1
Miss. 29 15 590 659 - 1 634 867 - 14
W.S. CENTRAL 382 442 2,260 4,264 - - 2,325 3,168 - 14
Ark. 17 18 314 205 - - 589 410 - -
La. 67 85 1,270 546 - - 1,329 607 - 11
Okla. 14 32 676 485 - - 407 440 - -
Tex. 284 307 - 3,028 - - - 1,711 - 3
MOUNTAIN 88 139 1,628 1,917 6 4 684 689 42 31
Mont. 6 7 61 74 - - - 4 3 2
Idaho 3 2 33 124 2 - - 14 10 8
Wyo. - 1 67 42 - - 5 5 21 12
Colo. 21 38 - 104 1 1 281 187 2 3
N. Mex. 9 4 533 392 2 1 98 98 2 2
Ariz. 33 28 751 766 N 2 278 268 - 3
Utah 13 16 173 129 1 - 19 15 3 -
Nev. 3 43 10 286 - - 3 98 1 1
PACIFIC 528 1,057 4,399 6,561 12 - 977 1,804 27 63
Wash. 34 45 1,011 804 - - 175 208 - -
Oreg. 12 30 279 407 2 - 48 61 1 1
Calif. 477 961 2,792 5,141 10 - 695 1,441 16 43
Alaska - 16 167 119 - - 29 53 - -
Hawaii 5 5 150 90 N - 30 41 10 19
Guam - - 8 28 N - 2 2 - -
P.R. 88 144 U U 1 U 39 46 2 3
V.I. 1 4 N N N U - - - -
Amer. Samoa - - - - N U - - - -
C.N.M.I. - - N N N U 5 4 - 1
------------------------------------------------------------------------------------------------------------------------------
N: Not notifiable U: Unavailable -: no reported cases C.N.M.I.: Commonwealth of North Mariana Islands
* Updated monthly to the Division of HIV/AIDS Prevention, -- Surveillance and Epidemiology, National Center for HIV, STD,
and TB Prevention, last update January 15, 1998.
** National Electronic Telecommunications System for Surveillance.
*** Public Health Laboratory Information System.
=======================================================================================================================================================
TABLE II. (page 2) Provisional cases of selected notifiable diseases, United States, weeks ending
February 7, 1998, and February 1, 1997 (5th Week)
Lyme Syphilis Rabies,
Legionellosis Disease Malaria (Primary & Secondary) Tuberculosis Animal
---------------- ---------------- ---------------- --------------------- ----------------- -------
Cum. Cum. Cum. Cum. Cum. Cum. Cum. Cum. Cum. Cum. Cum.
Reporting Area 1998 1997 1998 1997 1998 1997 1998 1997 1998 * 1997 1998
-------------------------------------------------------------------------------------------------------------------------------------------
UNITED STATES 58 86 152 239 62 108 580 857 552 875 540
NEW ENGLAND 2 5 11 61 1 2 9 11 9 17 107
Maine - - - - - - - - U 2 14
N.H. - 2 - 3 - 1 - - - - 8
Vt. - 1 - 1 - - - - - - 3
Mass. 2 2 10 7 1 1 9 5 7 6 36
R.I. - - 1 6 - - - - 2 1 10
Conn. - - - 44 - - - 6 U 8 36
MID. ATLANTIC 8 12 83 142 12 18 36 41 17 65 149
Upstate N.Y. 2 2 24 4 6 1 1 8 U 9 89
N.Y. City - - - 13 3 6 4 9 U 28 U
N.J. - 1 - 52 - 9 22 18 17 13 25
Pa. 6 9 59 73 3 2 9 6 U 15 35
E.N. CENTRAL 20 42 11 1 5 13 83 64 26 130 3
Ohio 13 23 11 - 1 1 26 24 U 37 3
Ind. 2 3 - - 1 2 8 14 U 9 -
Ill. - 1 - 1 - 5 30 10 26 83 -
Mich. 5 14 - - 3 5 15 - U - -
Wis. - 1 U U - - 4 16 U 1 -
W.N. CENTRAL 4 5 1 - - 1 9 20 10 20 31
Minn. - - - - - - - 7 U 9 8
Iowa - - 1 - - 1 - 1 U 4 16
Mo. 2 3 - - - - 6 10 10 5 1
N. Dak. - - - - - - - - U 1 -
S. Dak. - - - - - - - - - 1 -
Nebr. 2 1 - - - - - - - - -
Kans. - 1 - - - - 3 2 U - 6
S. ATLANTIC 12 7 38 22 23 15 222 326 53 61 199
Del. 1 1 - 2 1 1 - 3 - 2 -
Md. 4 5 37 16 11 2 41 103 13 7 57
D.C. 1 1 1 3 3 2 7 6 10 6 -
Va. 2 - - - 1 1 27 18 - 16 51
W. Va. N N - - - - - - 9 6 6
N.C. 1 - - 1 2 1 53 62 21 17 39
S.C. - - - - - 3 30 48 U 1 5
Ga. - - - - 3 3 47 62 U - 20
Fla. 3 - - - 2 2 17 24 U 6 21
E.S. CENTRAL - 3 4 9 - 2 109 196 - 58 13
Ky. - - - 1 - - 9 10 U 12 1
Tenn. - - 4 1 - - 61 75 U 19 6
Ala. - 1 - - - 1 26 54 U 24 6
Miss. - 2 - 7 - 1 13 57 U 3 -
W.S. CENTRAL - - - - 2 - 63 146 - 104 19
Ark. - - - - - - 21 21 - - 1
La. - - - - 2 - 36 53 - - -
Okla. - - - - - - 6 15 U 8 18
Tex. - - - - - - - 57 U 96 -
MOUNTAIN 7 8 - - 5 8 24 20 11 13 7
Mont. - - - - - 1 - - - - 2
Idaho - - - - - - - - - - -
Wyo. - - - - - - - - - 1 5
Colo. 2 2 - - 3 4 2 - U 3 -
N. Mex. 1 - - - 2 - - - U - -
Ariz. - 3 - - - - 20 18 11 6 -
Utah 4 2 - - - - 2 - - - -
Nev. - 1 - - - 3 - 2 U 3 -
PACIFIC 5 4 4 4 14 49 25 33 426 407 12
Wash. - 1 - - - - 1 - U 26 -
Oreg. - - - 2 3 2 1 1 U 10 -
Calif. 5 3 4 2 11 47 23 32 415 343 11
Alaska - - - - - - - - 4 7 1
Hawaii - - - - - - - - 7 21 -
Guam - - - - - - - - - 4 -
P.R. - - - - - 2 15 18 - - 4
V.I. - - - - - - - - - - -
Amer. Samoa - - - - - - - - - - -
C.N.M.I. - - - - - - 1 - 4 - -
-------------------------------------------------------------------------------------------------------------------------------------------
N: Not notifiable U: Unavailable -: no reported cases
* Additional information about areas displaying 'U' (e.g., Tuberculosis) can be found in Notices to Readers, MMWR Vol. 47, No. 2, p. 39.
=======================================================================================================================================================
Return to top. Table_III Note: To print large tables and graphs users may have to change their printer settings to landscape and use a small font size.
TABLE III. (page 1) Provisional cases of selected notifiable diseases preventable by vaccination, United
States, weeks ending February 7, 1998, and February 1, 1997 (5th Week)
Hepatitis (Viral), by type Measles (Rubeola)
H. influenzae, --------------------------------------- ------------------------------------------------------------
invasive A B Indigenous Imported** Total
---------------- ----------------- ----------------- --------------- --------------- ---------------
Cum. Cum. Cum. Cum. Cum. Cum. Cum. Cum. Cum. Cum.
Reporting Area 1998* 1997 1998 1997 1998 1997 1998 1998 1998 1998 1998 1997
-----------------------------------------------------------------------------------------------------------------------------------------------------
UNITED STATES 91 100 1,182 2,007 438 629 - - 1 1 1 10
NEW ENGLAND 6 10 26 47 1 18 - - - - - -
Maine - 2 5 2 - 1 - - - - - -
N.H. 1 2 1 1 1 1 U - U - - -
Vt. - - 1 2 - - - - - - - -
Mass. 5 5 3 24 - 12 - - - - - -
R.I. - 1 2 1 - - - - - - - -
Conn. - - 14 17 - 4 - - - - - -
MID. ATLANTIC 9 16 44 201 50 105 - - 1 1 1 3
Upstate N.Y. 3 1 25 8 20 12 - - 1 1 1 1
N.Y. City 1 6 10 103 10 47 - - - - - 1
N.J. 5 6 1 39 - 23 - - - - - 1
Pa. - 3 8 51 20 23 - - - - - -
E.N. CENTRAL 10 14 198 268 68 121 - - - - - 1
Ohio 9 9 49 53 9 10 - - - - - -
Ind. 1 - 26 29 4 18 - - - - - -
Ill. - 5 - 95 - 34 - - - - - -
Mich. - - 116 63 54 55 - - - - - 1
Wis. - - 7 28 1 4 - - - - - -
W.N. CENTRAL 2 4 147 141 24 45 - - - - - -
Minn. - 2 - 1 - - - - - - - -
Iowa 1 - 62 18 4 2 - - - - - -
Mo. 1 2 80 81 17 36 - - - - - -
N. Dak. - - - - - - U - U - - -
S. Dak. - - 1 5 1 - - - - - - -
Nebr. - - 2 7 - 2 - - - - - -
Kans. - - 2 29 2 5 - - - - - -
S. ATLANTIC 26 17 96 109 48 46 - - - - - -
Del. - - - 6 - 1 - - - - - -
Md. 9 5 29 46 10 19 - - - - - -
D.C. - - 2 1 1 2 - - - - - -
Va. 3 1 14 15 5 4 - - - - - -
W. Va. 1 1 - 1 - 2 - - - - - -
N.C. 1 5 9 13 16 8 - - - - - -
S.C. - - 5 7 - 5 - - - - - -
Ga. 6 2 11 5 6 - - - - - - -
Fla. 6 3 26 15 10 5 - - - - - -
E.S. CENTRAL 2 10 27 66 41 54 - - - - - 1
Ky. - - - 9 - 2 - - - - - -
Tenn. 2 5 16 30 31 37 - - - - - -
Ala. - 5 11 11 10 5 - - - - - 1
Miss. - - - 16 - 10 U - U - - -
W.S. CENTRAL 5 3 45 142 12 9 - - - - - -
Ark. - - 1 14 8 3 - - - - - -
La. 3 - 2 - 1 3 - - - - - -
Okla. 1 2 35 96 3 - - - - - - -
Tex. 1 1 7 32 - 3 - - - - - -
MOUNTAIN 21 6 287 367 74 84 - - - - - -
Mont. - - 6 10 1 - - - - - - -
Idaho - - 14 21 3 - - - - - - -
Wyo. - - 4 3 1 2 - - - - - -
Colo. 1 1 28 58 9 22 - - - - - -
N. Mex. - 1 19 20 22 26 - - - - - -
Ariz. 14 2 174 141 21 18 - - - - - -
Utah 1 1 20 87 8 11 - - - - - -
Nev. 5 1 22 27 9 5 U - U - - -
PACIFIC 10 20 312 666 120 147 - - - - - 5
Wash. - - 38 9 12 - - - - - - -
Oreg. 7 5 32 52 8 14 - - - - - -
Calif. 3 13 239 592 98 129 - - - - - 2
Alaska - - - 3 1 2 - - - - - -
Hawaii - 2 3 10 1 2 - - - - - 3
Guam - - - - - 1 U - U - - -
P.R. - - - 17 7 24 - - - - - -
V.I. - - - - - - U - U - - -
Amer. Samoa - - - - - - U - U - - -
C.N.M.I. - 2 - - 3 4 U - U - - -
-----------------------------------------------------------------------------------------------------------------------------------------------------
N: Not notifiable U: Unavailable -: no reported cases
* Of 22 cases among children aged <5 years, serotype was reported for 9 and of those, 4 were type b.
** For imported measles, cases include only those resulting from importation from other countries.
=======================================================================================================================================================
TABLE III. (page 2) Provisional cases of selected notifiable diseases preventable by vaccination, United
States, weeks ending February 7, 1998, and February 1, 1997 (5th Week)
Meningococcal
Disease Mumps Pertussis Rubella
----------------- -------------------------- --------------------------- ---------------------------
Cum. Cum. Cum. Cum. Cum. Cum. Cum. Cum.
Reporting Area 1998 1997 1998 1998 1997 1998 1998 1997 1998 1998 1997
------------------------------------------------------------------------------------------------------------------------------------------
UNITED STATES 262 353 6 24 27 51 288 421 2 12 3
NEW ENGLAND 26 21 - - - 9 61 157 - - -
Maine 1 1 - - - 1 1 4 - - -
N.H. 1 2 U - - U 5 17 U - -
Vt. 1 - - - - 3 13 58 - - -
Mass. 10 13 - - - 5 42 78 - - -
R.I. 3 1 - - - - - - - - -
Conn. 10 4 - - - - - - - - -
MID. ATLANTIC 21 23 - 1 3 6 17 19 2 10 1
Upstate N.Y. 4 2 - 1 - 6 17 12 2 10 -
N.Y. City 3 4 - - - - - 3 - - 1
N.J. 14 5 - - 1 - - 1 - - -
Pa. - 12 - - 2 - - 3 - - -
E.N. CENTRAL 37 63 2 3 4 2 21 48 - - 2
Ohio 26 26 2 3 2 2 18 25 - - -
Ind. 5 9 - - 2 - - - - - -
Ill. - 17 - - - - - 3 - - -
Mich. 3 4 - - - - 3 14 - - -
Wis. 3 7 - - - - - 6 - - 2
W.N. CENTRAL 17 33 - - - 4 11 8 - - -
Minn. - 2 - - - 4 6 1 - - -
Iowa 2 9 - - - - 3 4 - - -
Mo. 7 14 - - - - - - - - -
N. Dak. - - U - - U - - U - -
S. Dak. 3 1 - - - - - 1 - - -
Nebr. 1 2 - - - - 2 1 - - -
Kans. 4 5 - - - - - 1 - - -
S. ATLANTIC 51 55 2 9 1 7 34 21 - 1 -
Del. - 2 - - - - - - - - -
Md. 7 4 - 2 - - 6 20 - - -
D.C. - 2 - - - - - - - - -
Va. 7 3 - - - - - - - - -
W. Va. 2 1 - - - - - - - - -
N.C. 4 9 1 4 - 2 23 - - 1 -
S.C. 5 15 - 2 - - - 1 - - -
Ga. 16 11 - - - - - - - - -
Fla. 10 8 1 1 1 5 5 - - - -
E.S. CENTRAL 9 33 - - 4 1 10 11 - - -
Ky. - 7 - - - - - 2 - - -
Tenn. 9 12 - - 1 - 2 3 - - -
Ala. - 9 - - 1 1 8 4 - - -
Miss. - 5 U - 2 U - 2 U - -
W.S. CENTRAL 17 4 1 3 3 5 12 4 - 1 -
Ark. 2 2 - - - 1 6 2 - - -
La. 4 - - - - - - - - - -
Okla. 11 1 - - - - - - - - -
Tex. - 1 1 3 3 4 6 2 - 1 -
MOUNTAIN 25 23 - 1 3 13 102 107 - - -
Mont. 1 1 - - - - 1 - - - -
Idaho - 2 - - - 11 55 71 - - -
Wyo. 1 - - - - - - 3 - - -
Colo. 11 1 - - 1 1 10 22 - - -
N. Mex. 3 6 N N N 1 31 6 - - -
Ariz. 8 7 - 1 - - - 4 - - -
Utah 1 3 - - 1 - 4 - - - -
Nev. - 3 U - 1 U 1 1 U - -
PACIFIC 59 98 1 7 9 4 20 46 - - -
Wash. 8 7 - - - 3 5 4 - - -
Oreg. 23 29 N N N 1 8 3 - - -
Calif. 28 62 - 1 5 - 7 38 - - -
Alaska - - - 2 - - - 1 - - -
Hawaii - - 1 4 4 - - - - - -
Guam - - U - - U - - U - -
P.R. - - - - 1 - - - - - -
V.I. - - U - - U - - U - -
Amer. Samoa - - U - - U - - U - -
C.N.M.I. - - U - - U - - U - -
------------------------------------------------------------------------------------------------------------------------------------------
N: Not notifiable U: Unavailable -: no reported cases
=======================================================================================================================================================
Return to top. Table_IV Note: To print large tables and graphs users may have to change their printer settings to landscape and use a small font size.
TABLE IV. Deaths in 122 U.S. cities,* week ending
February 7, 1998 (5th Week)
===================================================================================================================================
All Causes, By Age (Years)
------------------------------------------------------------------------ P&I**
Reporting Area All Ages >=65 45-64 25-44 1-24 <1 Total
---------------------------------------------------------------------------------------------------------------
NEW ENGLAND 708 546 98 45 11 8 98
Boston, Mass. 211 160 32 14 3 2 25
Bridgeport, Conn. 20 15 3 1 - 1 1
Cambridge, Mass. 19 18 - 1 - - 2
Fall River, Mass. 29 25 4 - - - -
Hartford, Conn. 65 47 9 4 3 2 4
Lowell, Mass. 40 30 8 2 - - 5
Lynn, Mass. 8 5 2 1 - - 1
New Bedford, Mass. 38 32 3 3 - - 3
New Haven, Conn. 34 22 6 4 2 - 6
Providence, R.I. 72 53 15 1 3 - 16
Somerville, Mass. 6 6 - - - - 1
Springfield, Mass. 50 36 3 9 - 2 6
Waterbury, Conn. 26 21 3 2 - - 7
Worcester, Mass. 90 76 10 3 - 1 21
MID. ATLANTIC 2,734 1,962 496 175 55 46 190
Albany, N.Y. 41 32 7 1 1 - 2
Allentown, Pa. 16 14 1 1 - - 2
Buffalo, N.Y. 70 52 15 2 - 1 1
Camden, N.J. 32 19 10 2 1 - 1
Elizabeth, N.J. 22 15 6 1 - - 1
Erie, Pa. 48 38 5 4 - 1 4
Jersey City, N.J. 54 40 7 4 2 1 4
New York City, N.Y. 1,344 953 263 83 25 20 77
Newark, N.J. 65 27 22 9 4 3 5
Paterson, N.J. 21 15 2 3 1 - 1
Philadelphia, Pa. 500 335 95 43 16 11 41
Pittsburgh, Pa.*** 110 84 16 3 2 5 8
Reading, Pa. 31 26 3 2 - - 4
Rochester, N.Y. 142 112 23 4 1 2 16
Schenectady, N.Y. 34 29 3 1 - 1 2
Scranton, Pa. 32 25 4 3 - - -
Syracuse, N.Y. 110 91 9 8 1 1 13
Trenton, N.J. 24 21 2 1 - - 2
Utica, N.Y. 38 34 3 - 1 - 6
Yonkers, N.Y. U U U U U U U
E.N. CENTRAL 2,323 1,633 436 134 71 48 149
Akron, Ohio 68 51 12 2 2 1 -
Canton, Ohio 43 31 9 2 1 - 2
Chicago, Ill. 471 278 115 43 22 12 19
Cincinnati, Ohio 109 74 20 6 3 6 12
Cleveland, Ohio 181 129 31 10 3 8 4
Columbus, Ohio 207 140 48 12 4 3 22
Dayton, Ohio 149 123 19 5 - 2 14
Detroit, Mich. 224 147 42 20 11 4 8
Evansville, Ind. 50 39 8 3 - - 4
Fort Wayne, Ind. 76 58 9 4 4 1 8
Gary, Ind. 17 11 2 1 3 - -
Grand Rapids, Mich. 68 51 11 3 2 1 12
Indianapolis, Ind. 162 119 31 5 5 2 -
Lansing, Mich. 45 33 8 2 - 2 2
Milwaukee, Wis. 142 112 20 5 3 2 14
Peoria, Ill. 55 45 8 1 - 1 5
Rockford, Ill. 53 45 7 - 1 - 9
South Bend, Ind. 42 33 5 3 - 1 1
Toledo, Ohio 95 62 24 5 3 1 10
Youngstown, Ohio 66 52 7 2 4 1 3
W.N. CENTRAL 1,127 854 166 54 9 22 86
Des Moines, Iowa 104 85 12 4 1 2 14
Duluth, Minn. 46 36 7 3 - - 5
Kansas City, Kans. 41 34 4 3 - - -
Kansas City, Mo. 137 89 13 9 1 3 2
Lincoln, Nebr. 43 36 5 - 2 - 6
Minneapolis, Minn. 260 199 43 9 2 7 28
Omaha, Nebr. 107 75 22 9 - 1 10
St. Louis, Mo. 124 91 25 4 1 3 -
St. Paul, Minn. 151 125 16 6 - 4 14
Wichita, Kans. 114 84 19 7 2 2 7
S. ATLANTIC 1,245 822 247 109 31 35 81
Atlanta, Ga. U U U U U U U
Baltimore, Md. 260 159 56 36 2 7 31
Charlotte, N.C. 98 63 21 7 3 4 8
Jacksonville, Fla. 167 113 34 13 6 1 2
Miami, Fla. 112 72 23 12 5 - -
Norfolk, Va. 64 42 11 3 3 4 4
Richmond, Va. 76 46 24 4 2 - 4
Savannah, Ga. 63 45 13 2 1 2 6
St. Petersburg, Fla. 71 52 12 4 2 1 4
Tampa, Fla. 213 152 39 14 5 3 20
Washington, D.C. 100 59 12 14 2 13 2
Wilmington, Del. 21 19 2 - - - -
E.S. CENTRAL 994 711 162 72 25 21 108
Birmingham, Ala. 221 154 35 19 6 4 22
Chattanooga, Tenn. 89 63 16 4 3 3 11
Knoxville, Tenn. 151 125 17 7 1 1 31
Lexington, Ky. 60 38 16 5 - 1 9
Memphis, Tenn. 204 140 34 19 7 4 18
Mobile, Ala. 61 45 8 3 1 4 2
Montgomery, Ala. 76 60 9 2 2 3 9
Nashville, Tenn. 132 86 27 13 5 1 6
W.S. CENTRAL 1,648 1,077 347 138 52 34 134
Austin, Tex. 98 68 15 9 3 3 8
Baton Rouge, La. 42 20 14 4 4 - 2
Corpus Christi, Tex. 54 38 6 5 2 3 2
Dallas, Tex. 234 137 53 29 11 4 12
El Paso, Tex. U U U U U U U
Ft. Worth, Tex. 123 88 18 8 6 3 4
Houston, Tex. 464 296 112 37 13 6 50
Little Rock, Ark. 85 59 18 2 2 4 4
New Orleans, La. 74 35 22 9 4 4 -
San Antonio, Tex. 221 151 40 22 4 4 18
Shreveport, La. 95 75 13 5 2 - 14
Tulsa, Okla. 158 110 36 8 1 3 20
MOUNTAIN 1,255 927 206 73 24 23 139
Albuquerque, N.M. 140 91 27 14 4 4 8
Boise, Idaho 55 48 3 2 1 1 12
Colo. Springs, Colo. 56 44 7 4 - 1 6
Denver, Colo. 130 90 22 8 5 5 15
Las Vegas, Nev. 295 221 55 15 2 1 27
Ogden, Utah 37 28 7 2 - - 5
Phoenix, Ariz. 194 146 34 5 3 5 17
Pueblo, Colo. 37 27 7 2 - 1 5
Salt Lake City, Utah 115 87 14 8 3 3 18
Tucson, Ariz. 196 145 30 13 6 2 26
PACIFIC 1,795 1,319 283 112 43 38 229
Berkeley, Calif. 16 13 2 1 - - 2
Fresno, Calif. 99 74 17 4 3 1 8
Glendale, Calif. 16 11 1 3 1 - 1
Honolulu, Hawaii 104 80 12 5 3 4 7
Long Beach, Calif. 110 84 18 3 - 5 29
Los Angeles, Calif. 340 245 59 22 10 4 15
Pasadena, Calif. 36 28 6 - 1 1 6
Portland, Oreg. 81 57 14 5 3 2 4
Sacramento, Calif. 223 167 33 15 6 2 56
San Diego, Calif. 170 126 19 14 5 6 27
San Francisco, Calif. U U U U U U U
San Jose, Calif. 290 210 52 14 8 6 47
Santa Cruz, Calif. 26 22 3 1 - - 5
Seattle, Wash. 119 82 21 12 1 3 3
Spokane, Wash. 68 52 11 3 1 1 10
Tacoma, Wash. 97 68 15 10 1 3 9
TOTAL 13,829**** 9,851 2,441 912 321 275 1,214
---------------------------------------------------------------------------------------------------------------
U: Unavailable -: no reported cases
* Mortality data in this table are voluntarily reported from 122 cities in the United States, most of which have populations
of 100,000 or more. A death is reported by the place of its occurrence and by the week that the death certificate was
filed. Fetal deaths are not included.
** Pneumonia and influenza.
*** Because of changes in reporting methods in this Pennsylvania city, these numbers are partial counts for the current
week. Complete counts will be available in 4 to 6 weeks.
**** Total includes unknown ages.
===================================================================================================================================
Return to top. Disclaimer All MMWR HTML versions of articles are electronic conversions from ASCII text into HTML. This conversion may have resulted in character translation or format errors in the HTML version. Users should not rely on this HTML document, but are referred to the electronic PDF version and/or the original MMWR paper copy for the official text, figures, and tables. An original paper copy of this issue can be obtained from the Superintendent of Documents, U.S. Government Printing Office (GPO), Washington, DC 20402-9371; telephone: (202) 512-1800. Contact GPO for current prices. **Questions or messages regarding errors in formatting should be addressed to mmwrq@cdc.gov.Page converted: 10/05/98 |
|||||||||
This page last reviewed 5/2/01
|