 |
|
|
|
|
|
|
| ||||||||||
|
|
|
|
|
|
|
||||
| ||||||||||
|
|
|
|
|
Persons using assistive technology might not be able to fully access information in this file. For assistance, please send e-mail to: mmwrq@cdc.gov. Type 508 Accommodation and the title of the report in the subject line of e-mail. Missed Opportunities in Preventive Counseling for Cardiovascular Disease -- United States, 1995Cardiovascular disease (CVD), the leading cause of death in the United States, caused 960,592 deaths in 1995 (1) (41.5% of all deaths). Approximately 58 million persons in the United States (20% of the total population) have one or more types of CVD, which include high blood pressure, coronary heart disease, stroke, rheumatic fever or rheumatic heart disease, and other forms of heart disease. Behavioral risk factors for CVD and other chronic diseases include physical inactivity, a diet high in fat, overweight, and smoking. The U.S. Preventive Services Task Force and the American Heart Association recommend that all primary-care providers offer their patients counseling to promote physical activity, a healthy diet, and smoking cessation as part of the preventive health examination (2,3). To characterize the provision of counseling by physicians about preventive health behaviors during office visits in 1995, data were analyzed from CDC's National Ambulatory Medical Care Survey (NAMCS). This report summarizes the results of that analysis, which indicates that a high proportion of office visits in 1995 did not include counseling for the prevention of CVD. The analysis was restricted to the 29,273 office visits by persons aged greater than or equal to 20 years who sought either a general medical or routine gynecologic examination. Visits excluded were those for examinations for illness or injury, school or employment, prenatal care, birth control consultation, assessment of specific organ systems, and follow-up or progress visits. Physicians participating in NAMCS were asked to complete a standardized survey form about visit diagnoses, patient characteristics, and provision of diagnostic and preventive services during office visits. After weighting for selection probability, nonresponse, and a physician-population weighting ratio adjustment, the 29,273 office visits resulted in a national estimate of 40 million office visits during 1995 (4). During 1995, 29.5% of office visits were with obstetricians or gynecologists, 26.3% with internists, 25.0% with family or general practitioners, 2.4% with cardiologists, and 16.9% with other specialists. Physicians reported offering counseling about physical activity during 19.1% of office visits, diet during 22.8%, and weight reduction during 10.4% (Table_1). Counseling was reported more commonly for persons aged 50-64 years, for men than for women (physical activity {23.0% versus 17.5%, respectively}, diet {26.6% versus 21.2%, respectively}), and weight reduction {12.0% versus 9.7%, respectively}), and for non-Hispanic whites and Hispanics (physical activity {19.7% and 19.9%, respectively}) than for non-Hispanic blacks (13.0%). The prevalence of reported counseling was lowest in the South and highest in the Midwest. * Cardiologists and family or general practitioners were more likely than other specialists to provide counseling about physical activity, diet, and weight reduction (Figure_1). Among all respondents, 64% reported that their office visits included an assessment of smoking status; among current smokers, 41% of office visits included smoking cessation counseling. Reported by: Cardiovascular Health Br, Div of Adolescent and Community Health, National Center for Chronic Disease Prevention and Health Promotion, CDC. Editorial NoteEditorial Note: Office visits for general medical and routine gynecologic examinations provide an important opportunity for physicians to counsel patients about reducing behaviors associated with CVD. However, the findings in this report indicate that, in 1995, high proportions of patient visits did not include such counseling. Although reported counseling rates were higher for visits to cardiologists than to other specialists, cardiologists accounted for only 2.4% of visits in 1995. The low prevalence of counseling among obstetricians and gynecologists -- a group of physicians that accounted for almost one third of office visits in the survey -- represents a substantial loss of opportunity. The lower prevalence of counseling among women may be, in part, a result of a high proportion of women receiving care from obstetricians and gynecologists; however, when the analysis excluded these specialists, women were still less likely than men to receive preventive counseling. Although physically active persons often cite a physician's advice as a major motivating factor in their decision to be become physically active (5), physician advice is related to physicians attitudes about physical activity: in 1991, 59% of primary-care physicians believed that engaging in regular physical activity was very important for their patients; only 24% reported that they would be able to modify patient behavior (6). The low proportion of office visits that included counseling about diet probably reflected physician attitudes about dietary advice (5). In 1988, 92% of internal medicine residents reported that a low-fat, low-cholesterol diet can effectively lower cholesterol levels, and 68% reported that they are responsible for providing dietary advice; however, 72% of physicians believed they were inadequately prepared to provide dietary counseling (7). One third of U.S. adults are overweight, and the low prevalence of counseling for weight reduction (10.4%) indicates that most overweight adults are not being counseled about weight reduction (8). Physician counseling about weight reduction should include advice about weight maintenance for all adults and caloric restriction and increased physical activity for persons who are overweight. Barriers to physician counseling include time constraints, lack of reimbursement, and lack of professional training (9). To promote counseling by all health-care providers, training programs for physicians should increase emphasis on preventive counseling. In addition to medical schools, such training should be provided in residencies, other postgraduate programs, continuing medical education, and by professional organizations. Increasing enrollment in managed-care programs highlights the opportunities for counseling for prevention of CVD and other disease-prevention and health-promotion activities in such programs. References
* Northeast=Connecticut, Maine, Massachusetts, New Hampshire, New Jersey, New York, Pennsylvania, Rhode Island, and Vermont; Midwest=Illinois, Indiana, Iowa, Kansas, Michigan, Minnesota, Missouri, Nebraska, North Dakota, Ohio, South Dakota, and Wisconsin; South=Alabama, Arkansas, Delaware, District of Columbia, Florida, Georgia, Kentucky, Louisiana, Maryland, Mississippi, North Carolina, Oklahoma, South Carolina, Tennessee, Texas, Virginia, and West Virginia; and West=Alaska, Arizona, California, Colorado, Hawaii, Idaho, Montana, Nevada, New Mexico, Oregon, Utah, Washington, and Wyoming. Table_1 Note: To print large tables and graphs users may have to change their printer settings to landscape and use a small font size.
TABLE 1. Number and percentage of persons who attended general medical/ gynecologic visits that included counseling for
prevention of cardiovascular disease, by selected characteristics -- United States, National Ambulatory Medical Care Survey,
1995
================================================================================================================================
                                                                               Subject of
                                                                               counseling
                                        ----------------------------------------------------------------------------------------
                                              Physical                                                       Weight
                                              activity                            Diet                      reduction
                                        ------------------------          -----------------------     -----------------------
Characteristic       Estimated no.        (%)         (95% CI+)             (%)          (95% CI)       (%)        (95% CI)
                        visits*
--------------------------------------------------------------------------------------------------------------------------------
Age group (yrs)
 20-34                     6.9            18.9        (+/- 6.4%)           20.1        (+/- 6.6%)       7.9&      (+/- 4.4%)
 35-49                    10.3            15.9        (+/- 4.9%)           17.7        (+/- 5.1%)      10.5       (+/- 4.1%)
 50-64                     9.8            23.8        (+/- 5.9%)           29.5        (+/- 6.3%)      15.1       (+/- 4.9%)
  >=65                    13.0            18.2        (+/- 4.6%)           23.2        (+/- 5.0%)       8.0       (+/- 3.2%)
Sex
 Men                      11.8            23.0        (+/- 5.3%)           26.6        (+/- 5.5%)      12.0       (+/- 4.1%)
 Women                    28.2            17.5        (+/- 3.1%)           21.2        (+/- 3.3%)       9.7       (+/- 2.4%)
Race/Ethnicity@
 White,non-               34.4            19.7        (+/- 2.9%)           23.1        (+/- 3.1%)      10.3       (+/- 2.2%)
Hispanic
 Black,non-                3.7           13.0&        (+/- 7.8%)           21.5        (+/- 9.2%)      10.9&      (+/- 7.0%)
Hispanic
 Hispanic                  1.9           19.9&        (+/-12.6%)           20.3&       (+/-12.7%)      11.9&      (+/-10.2%)
Region**
 Northeast                 9.4            20.2        (+/- 5.6%)           23.2        (+/- 5.9%)      10.2       (+/- 4.3%)
 Midwest                   9.7            22.3        (+/- 5.8%)           25.7        (+/- 6.0%)      14.4       (+/- 4.8%)
 South                    12.6            14.3        (+/- 4.2%)           15.7        (+/- 4.4%)       5.8       (+/- 2.8%)
 West                      8.3            21.4        (+/- 6.1%)           29.7        (+/- 6.8%)      12.9       (+/- 5.0%)
Total                     40.0            19.1        (+/- 2.7%)           22.8        (+/- 2.9%)      10.4       (+/- 2.1%)
--------------------------------------------------------------------------------------------------------------------------------
*  In millions.
+  Confidence interval.
&  Estimates should be interpreted with caution because the relative standard error is >=30%.
@  Numbers for other racial/ethnic groups were too small for meaningful analysis.
** Northeast=Connecticut, Maine, Massachusetts, New Hampshire, New Jersey, New York, Pennsylvania, Rhode Island, and Vermont;
   Midwest=Illinois, Indiana, Iowa, Kansas, Michigan, Minnesota, Missouri, Nebraska, North Dakota, Ohio, South Dakota, and
   Wisconsin; South=Alabama, Arkansas, Delaware, District of Columbia, Florida, Georgia, Kentucky, Louisiana, Maryland,
   Mississippi, North Carolina, Oklahoma, South Carolina, Tennessee, Texas, Virginia, and West Virginia; and West=Alaska,
   Arizona, California, Colorado, Hawaii, Idaho, Montana, Nevada, Oregon, Utah, Washington, and Wyoming.
================================================================================================================================
Return to top. Figure_1 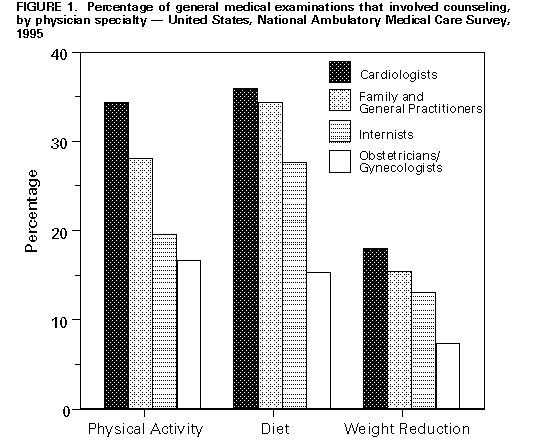 Return to top. Disclaimer All MMWR HTML versions of articles are electronic conversions from ASCII text into HTML. This conversion may have resulted in character translation or format errors in the HTML version. Users should not rely on this HTML document, but are referred to the electronic PDF version and/or the original MMWR paper copy for the official text, figures, and tables. An original paper copy of this issue can be obtained from the Superintendent of Documents, U.S. Government Printing Office (GPO), Washington, DC 20402-9371; telephone: (202) 512-1800. Contact GPO for current prices. **Questions or messages regarding errors in formatting should be addressed to mmwrq@cdc.gov.Page converted: 10/05/98 |
|||||||||
This page last reviewed 5/2/01
|