 |
|
|
|
|
|
|
| ||||||||||
|
|
|
|
|
|
|
||||
| ||||||||||
|
|
|
|
|
Persons using assistive technology might not be able to fully access information in this file. For assistance, please send e-mail to: mmwrq@cdc.gov. Type 508 Accommodation and the title of the report in the subject line of e-mail. AIDS Among Persons Aged greater than or equal to 50 Years -- United States, 1991-1996Early in the human immunodeficiency virus (HIV) epidemic, infection occurred disproportionately among older persons as a result of transmission through receipt of contaminated blood or blood products. Through 1989, receipt of contaminated blood or blood products accounted for only 1% of cases among persons aged 13-49 years; in comparison, this risk factor accounted for 6%, 28%, and 64% of cases among persons aged 50-59 years, 60-69 years, and greater than or equal to 70 years, respectively (1). Because of implementation of voluntary donor deferral and routine screening of blood donations in 1985, the number and proportion of acquired immunodeficiency syndrome (AIDS) cases associated with this risk factor decreased among persons aged greater than or equal to 50 years (2). However, among persons aged greater than or equal to 50 years, the number and proportion with AIDS associated with other modes of exposure increased. This report describes the characteristics of persons aged greater than or equal to 50 years with AIDS reported during 1996 and presents trends in the incidence of AIDS-opportunistic illnesses (AIDS-OIs) diagnosed during 1991-1996 by mode of HIV exposure for persons aged greater than or equal to 50 years. The findings indicate that, even though the incidence of AIDS-OIs during 1996 was higher among persons aged 13-49 years (89%), the proportion of AIDS-OIs accounted for by those aged greater than or equal to 50 years (11%) was substantial. * For persons with AIDS reported in 1996, the analysis included only cases reported during January 1-December 31, 1996. Trends in AIDS incidence were based on cumulative AIDS cases among persons aged greater than or equal to 13 years reported to CDC through June 1997 from the 50 states, the District of Columbia, and the U.S. territories and were analyzed by sex, age, race/ethnicity, mode of exposure, and year of AIDS diagnosis (3). Estimates were adjusted for delays in reporting and for the anticipated reclassification of cases initially reported without an HIV risk/exposure (3). To adjust for the 1993 expansion of the AIDS reporting criteria **, estimates of the incidence of AIDS-OIs were calculated from the sum of cases reported with an AIDS-OI and cases with estimated dates of diagnosis of an AIDS-OI that were reported based only on immunologic criteria (3). AIDS-OI incidence was estimated quarterly through December 1996 (the most recent annual period for which reliable estimates were available). To calculate annual AIDS incidence rates, mid-year U.S. population estimates were used based on decennial census data (4). Reported AIDS Cases Among Persons Aged greater than or equal to 50 Years, 1996 In 1996, of 68,473 persons aged greater than or equal to 13 years reported with AIDS, 7459 (11%) were aged greater than or equal to 50 years (Table_1); this proportion has remained stable since 1991. Of those aged greater than or equal to 50 years, 48% were aged 50-54 years, 26% were aged 55-59 years, 14% were aged 60-64 years, and 12% were aged greater than or equal to 65 years. Males accounted for 84% of cases, and blacks accounted for the highest proportion (43%) by race/ethnicity. Although men who have sex with men (MSM) accounted for the highest proportion of cases by exposure category (36%), compared with persons aged 13-49 years, a higher proportion of cases among persons aged greater than or equal to 50 years were reported without risk information (26%) (Table_1). For both age groups, the highest proportions of cases were in the South (35% and 37%, respectively) and Northeast (32% and 30%, respectively). *** In 1996, persons aged greater than or equal to 50 years were more likely than those aged 13-49 years to be reported with an AIDS-OI (e.g., wasting syndrome {7% versus 4%} **** and HIV encephal-opathy {3% versus 1%} ****) than to be reported with severe immunosuppression and without an AIDS-OI (53% versus 58%) ****. In addition, persons aged greater than or equal to 50 years were more likely to have died within 1 month of their AIDS diagnosis (13% versus 6%) ****, suggesting late diagnosis of HIV infection. Trends in AIDS-OI Incidence, 1991-1996 From 1991 to 1996, the proportionate increase in incident cases of AIDS-OIs was greater among persons aged greater than or equal to 50 years (22%; from 5260 cases to 6400 cases) ***** than among persons aged 13-49 years (9%; from 46,000 cases to 50,300 cases). From 1991 to 1996, among men aged greater than or equal to 50 years, the number of incident cases of AIDS-OIs among MSM remained stable (2900 cases each for 1991 and 1996), while incident cases among men whose risk was heterosexual contact increased 94% (from 360 cases to 700 cases) and incident cases among men reporting injecting-drug use (IDU) increased 53% (from 850 cases to 1300 cases). Among male recipients of contaminated blood or blood products, incident cases of AIDS-OIs decreased 48% (from 250 cases to 130 cases) (Figure_1). Among women aged greater than or equal to 50 years, cases attributed to heterosexual contact and IDU increased 106% (from 340 cases to 700 cases) and 75% (from 160 cases to 280 cases), respectively, while cases among recipients of contaminated blood or blood products decreased 33% (from 120 cases to 80 cases) (Figure_2). In both 1991 and 1996, the rate of AIDS-OIs was higher for persons aged 13-49 years than for persons aged greater than or equal to 50 years; rates among men in both age groups were higher than among women (Table_2). The rate ratios of AIDS-OIs for 1996 and 1991 were similar for both age groups of men (1.1, 1.0) and the same for both age groups of women (1.6) (Table_2). Reported by: Local, state, and territorial health depts. Div of HIV/AIDS Prevention-Surveillance and Epidemiology, National Center for HIV, STD, and TB Prevention, CDC. Editorial NoteEditorial Note: Even though the incidence of AIDS-OIs during 1996 was higher among persons aged 13-49 years, the proportion accounted for by persons aged greater than or equal to 50 years (11%) was substantial. The findings in this report suggest that persons aged greater than or equal to 50 years may not be promptly tested for HIV infection following the onset of HIV-related illnesses. Specifically, the finding that a higher proportion of persons aged greater than or equal to 50 years were reported with an AIDS-OI and died within 1 month of AIDS diagnosis suggests that persons aged greater than or equal to 50 years had AIDS diagnosed later during the course of HIV infection than persons aged 13-49 years. Although older HIV-infected patients have a shorter observed AIDS-free interval and shorter survival period than younger HIV-infected patients (5), one reason for later diagnosis among persons aged greater than or equal to 50 years is that physicians may be less likely to consider HIV infection among this group. This may result in missed opportunities for timely use of OI prophylaxis or antiretroviral therapies to prevent progression of disease. For example, AIDS-OIs that occur commonly among persons aged greater than or equal to 50 years (e.g., HIV encephalopathy and wasting syndrome) mimic other diseases associated with aging (e.g., Alzheimer disease, depression, and malignancies). In addition, in 1996, a survey of primary-care physicians reported they were less likely to discuss symptoms suggestive of HIV infection or to counsel older patients for HIV testing than their younger patients (6). To increase opportunities for HIV testing of U.S. persons aged greater than or equal to 50 years, health-care providers should be encouraged to discuss risk factors, obtain sexual and drug histories for patients, and consider HIV infection in the differential diagnosis of clinical illnesses that may represent HIV infection in this age group. Persons aged greater than or equal to 50 years also may not be promptly tested for HIV infection because they may not perceive themselves to be at risk for HIV infection. AIDS surveillance data indicate that higher proportions of persons aged greater than or equal to 50 years with cases of AIDS are reported without an identified risk. In 1994, the prevalence of reported condom use was lower among sexually active persons aged greater than or equal to 50 years who engaged in high-risk behaviors, and a higher proportion of these persons had never been tested for HIV, compared with younger persons who engaged in the same behaviors (7). During June 1990-October 1994, a study in 12 state and local health department clinics indicated that older women with heterosexually acquired AIDS were less likely than younger women to have used a condom before their HIV diagnosis and were less likely to have been tested for HIV before being hospitalized with an AIDS-OI (8). Because of the frequently long incubation period from HIV infection to AIDS diagnosis, many persons who were diagnosed with AIDS at age greater than or equal to 50 years were probably infected as younger adults; therefore, prevention efforts also must be directed at adults who engage in high-risk sexual and drug-use behaviors. In addition, because of the impact of recent advances in treatment on AIDS incidence, the AIDS surveillance data in this report may underestimate the current impact of the HIV epidemic both in persons in this age group and younger persons (9). Therefore, surveillance for HIV infection and AIDS is important for monitoring HIV transmission -- particularly among persons aged greater than or equal to 50 years -- and for evaluating the effectiveness of prevention programs. CDC supports HIV surveillance in 31 states and is developing technical guidance to assist all states and territories in conducting HIV and AIDS case surveillance. References
* Single copies of this report will be available until January 23, 1999, from the CDC National AIDS Clearinghouse, P.O. Box 6003, Rockville, MD 20849-6003; telephone (800) 458-5231 or (301) 519-0459. ** Conditions in HIV-infected persons that were added to the AIDS case definition in 1993 included laboratory measures of severe immunosuppression (i.e., CD4+ T-lymphocyte count less than 200 cells/uL or percentage of total lymphocytes less than 14) and three clinical conditions (pulmonary tuberculosis, recurrent pneumonia, and invasive cervical cancer). *** Northeast=Connecticut, Maine, Massachusetts, New Hampshire, New Jersey, New York, Pennsylvania, Rhode Island, and Vermont; Midwest=Illinois, Indiana, Iowa, Kansas, Michigan, Minnesota, Missouri, Nebraska, North Dakota, Ohio, South Dakota, and Wisconsin; South=Alabama, Arkansas, Delaware, District of Columbia, Florida, Georgia, Kentucky, Louisiana, Maryland, Mississippi, North Carolina, Oklahoma, South Carolina, Tennessee, Texas, Virginia, and West Virginia; and West=Alaska, Arizona, California, Colorado, Hawaii, Idaho, Montana, Nevada, New Mexico, Oregon, Utah, Washington, and Wyoming. **** p less than 0.05 (Chi-square). ***** Estimates are adjusted for delays in reporting AIDS cases, the 1993 expansion of the AIDS case definition, and anticipated redistribution of cases initially reported with no identified risk, but not for incomplete reporting of cases. Adult/adolescent and total estimates of less than 200, 200-499, 500-999, and greater than or equal to 1000 are rounded to the nearest 10, 20, 50, and 100, respectively. Table_1 Note: To print large tables and graphs users may have to change their printer settings to landscape and use a small font size.
TABLE 1. Number and percentage of persons reported with AIDS, by age group and selected
characteristics -- United States, 1996
==============================================================================================
                                                            Age group (yrs)
                                              ------------------------------------------------
                                                     >=50                     13-49
                                             -------------------------------------------------
Characteristic                                  No.            (%)        No.       (%)
----------------------------------------------------------------------------------------------
Sex
  Men                                          6,237         ( 83.6)     48,416   ( 79.4)
  Women                                        1,222         ( 16.4)*    12,598   ( 20.6)

Race/Ethnicity
  White,non-Hispanic                           2,914         ( 39.1)     23,315   ( 38.2)
  Black,non-Hispanic                           3,200         ( 42.9)     25,146   ( 41.2)
  Hispanic+                                    1,260         ( 16.9)*    11,706   ( 19.2)
  Asian/Pacific Islander                          62         (  0.8)        499   (  0.8)
  American Indian/Alaskan Native                  13         (  0.2)        194   (  0.3)

HIV exposure category
  Men who have sex with men                    2,674         ( 35.9)     24,642   ( 40.4)
  Injecting-drug use                           1,430         ( 19.2)*    15,597   ( 25.6)
  Men who have sex with men and who are          166         (  2.2)     2,801    (  4.6)
    injecting-drug users
  Heterosexual contact                         1,084         ( 14.5)     7,737    ( 12.7)
  Receipt of blood or blood products&            178         (  2.4)        691   (  1.1)
  No risk reported/Other risk                  1,927         ( 25.8)     9,546    ( 15.6)

AIDS-defining conditions
   HIV encephalopathy                            227         (  3.0)*       859   (  1.4)
  Wasting syndrome                               514         (  6.9)*     2,691   (  4.4)
  Other opportunistic illnesses                2,802         ( 37.6)     22,134   ( 36.3)
  Severe HIV immunosuppression                 3,916         ( 52.5)*    35,330   ( 57.9)

Region@
  Northeast                                    2,422         ( 32.4)     18,409   ( 30.2)
  Midwest                                        678         (  9.1)      6,094   ( 10.0)
  South                                        2,645         ( 35.4)     22,831   ( 37.4)
  West                                         1,437         ( 19.3)     11,642   ( 19.1)
  U.S. territories                               273         (  3.7)      1,975   (  3.2)

Total**                                        7,459         (100.0)     61,014   (100.0)
----------------------------------------------------------------------------------------------
*  p<0.05 (Chi-square).
+  Persons of Hispanic origin may be of any race.
&  Includes persons reported with transfusions and hemophilia/coagulation disorders.
@  Northeast=Connecticut, Maine, Massachusetts, New Hampshire, New Jersey, New York,
   Pennsylvania, Rhode Island, and Vermont; Midwest=Illinois, Indiana, Iowa, Kansas, Michigan,
   Minnesota, Missouri, Nebraska, North Dakota, Ohio, South Dakota, and Wisconsin; South=
   Alamaba, Arkansas, Delaware, District of Columbia, Florida, Georgia, Kentucky, Louisiana,
   Maryland, Mississippi, North Carolina, Oklahoma, South Carolina, Tennessee, Texas,
   Virginia, and West Virginia; and West=Alaska, Arizona, California, Colorado, Hawaii, Idaho,
   Montana, Nevada, New Mexico, Oregon, Utah, Washington, and Wyoming.
** Includes persons for whom race/ethnicity or region are missing.
==============================================================================================
Return to top. Figure_1 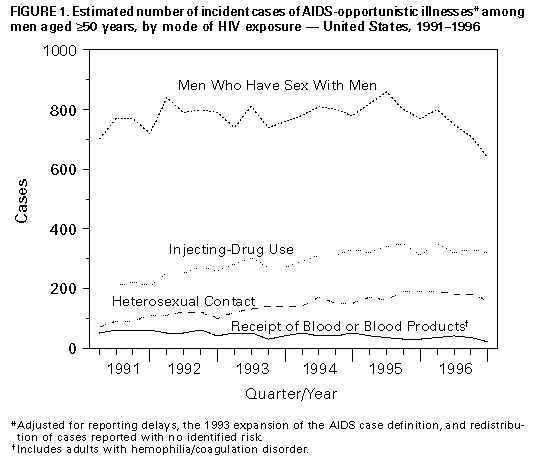 Return to top. Figure_2 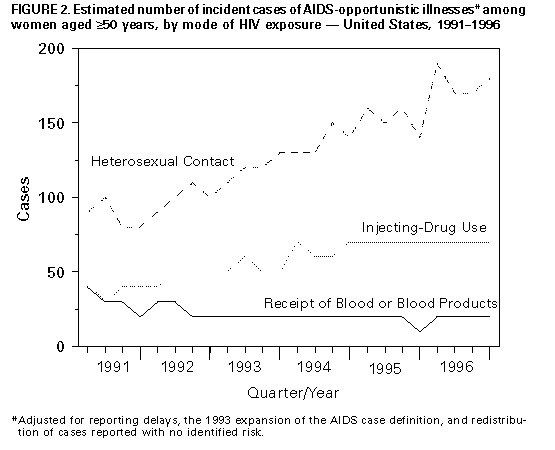 Return to top. Table_2 Note: To print large tables and graphs users may have to change their printer settings to landscape and use a small font size.
TABLE 2. Estimated number* of incident cases of AIDS-opportunistic illnesses
(OIs), rate+ of AIDS-OIs, and rate ratio of AIDS-OI incidence, by sex, age
group, and year -- United States, 1991 and 1996
=============================================================================
                            1991            1996
                       --------------  ---------------       1996:1991
Sex/ Age group (yrs)     No.     Rate    No.      Rate       Rate ratio
-----------------------------------------------------------------------------
Men
  >=50                  4,650    16.4   5,310     17.5           1.1
 13-49                 39,720    56.8  39,930     55.3           1.0

Women
  >=50                    660     1.8   1,080      2.8           1.6
 13-49                  6,350     9.1  10,410     14.5           1.6

Total
  >=50                  5,310     8.2   6,390      9.4           1.1
 13-49                 46,070    32.9  50,340     34.9           1.1
----------------------------------------------------------------------------
* Estimates are rounded to the nearest tens because they do not represent
  exact counts of persons with AIDS but are estimates that are within
  approximately +/-3% of the true value.
+ Per 100,000 population.

=============================================================================
Return to top. Disclaimer All MMWR HTML versions of articles are electronic conversions from ASCII text into HTML. This conversion may have resulted in character translation or format errors in the HTML version. Users should not rely on this HTML document, but are referred to the electronic PDF version and/or the original MMWR paper copy for the official text, figures, and tables. An original paper copy of this issue can be obtained from the Superintendent of Documents, U.S. Government Printing Office (GPO), Washington, DC 20402-9371; telephone: (202) 512-1800. Contact GPO for current prices. **Questions or messages regarding errors in formatting should be addressed to mmwrq@cdc.gov.Page converted: 10/05/98 |
|||||||||
This page last reviewed 5/2/01
|