 |
|
|
|
|
|
|
| ||||||||||
|
|
|
|
|
|
|
||||
| ||||||||||
|
|
|
|
|
Persons using assistive technology might not be able to fully access information in this file. For assistance, please send e-mail to: mmwrq@cdc.gov. Type 508 Accommodation and the title of the report in the subject line of e-mail. Surveillance Summaries Temporal Trends in the Incidence of Birth Defects -- United StatesAs part of its continuing commemoration of CDC's 50th anniversary in July 1996, MMWR is reprinting selected MMWR articles of historical interest to public health, accompanied by current editorial notes. Reprinted below is the report published August 31, 1979, describing trends in the incidence of birth defects in the United States during 1970-1977. Through CDC's Birth Defects Monitoring Program (BDMP), a total of 161 categories of birth defects are analyzed quarterly to determine increases or other unusual trends. Sixteen of these malformations have been selected for review in this report because they occur in sufficient numbers to provide relatively stable rates, the coding categories for them are relatively homogenous, and they represent defects of different organ systems. Data on the incidence of these 16 malformations in the United States in 1970-1971 and in 1976-1977 were compared, and the geometric mean percentage change in rates that occurred in the 6-year interval between these periods was calculated (Table_1). Six malformations changed an average of 5% or more per year. Anencephaly and spina bifida -- 2 of the most common, serious, and easily diagnosable defects -- decreased 5.4% and 6.7% per year, respectively (Figure_1). The cause of this decrease is unknown. The reported incidence of ventricular septal defect doubled, and that for patent ductus arteriosus tripled (Figure_1). A substantial search for the cause of these increases was done in the greater Atlanta area, but it could not be determined whether these increases were due to biologic factors or reporting methods (1,2). The incidence of congenital hip dislocation (without central nervous system anomalies) increased an average of almost 25% per year. Part of the increase was artifactual: a coding change in 1974 assigned hip dysplasia to the hip dislocation category. In addition, the diagnosis of this defect lacks clear, reproducible criteria. Changes in the manner of newborn examinations can, therefore, make substantial changes in reported incidence. The reported incidence rate of renal agenesis increased an average of 9.7% per year. This increase -- as yet unexplained -- is under investigation. Reported by Birth Defects Br, Chronic Diseases Div, Bur of Epidemiology, CDC. editorial note: The BDMP is conducted by CDC's Birth Defects Branch with data provided under contract by the Commission on Professional and Hospital Activities (CPHA) in Ann Arbor, Michigan. BDMP's primary purpose is to monitor the incidence of birth defects and other newborn conditions. Abstracts of hospital discharge summaries are coded by medical records staff from participating hospitals and submitted regularly to CPHA for data processing. CPHA uses some of the data on newborns to produce monitoring reports and other tabulations; these are sent to CDC for analysis. Since 1970, the tabulations have covered the births of 8 million infants. The present annual number of births covered, from 1,130 hospitals, is 975,000 -- about one-third of the births in the country. The advent of new means for the prevention of birth defects or of a widespread exposure to a powerful new teratogen would likely be followed by substantial changes in the incidence of birth defects. Rh hemolytic disease, for example, decreased following the widespread availability and use of rhesus immune globulin (RhIG) (3). In the period covered in this report, the incidence of the majority of birth defects neither substantially decreased nor increased. The paucity of decreasing rates indicates the need for discovering and implementing prevention strategies for birth defects -- the cause of nearly 20% of infant mortality in the United States. The paucity of increases suggests that few, if any, widespread and powerful new teratogens were introduced. The possibility of such an introduction requires continuing surveillance of the incidence of birth defects in the United States. references
Editorial Note 1997: Birth defects are the leading cause of infant mortality in the United States (1,2), and 18 of the most common birth defects account for annual expenditures of $8 billion (2). Even though the prevention of birth defects improves the health of children, prevention efforts have been hampered because the specific causes of most (75%) are unknown. CDC's involvement in the surveillance for birth defects began in late 1967 when Clark Heath, M.D., Chief of the Leukemia Section, Viral Diseases Branch, Epidemiology Program, and Epidemic Intelligence Service Officer Allan Ebbin, M.D., with the support of CDC Chief Epidemiologist Alexander Langmuir, M.D., and Arthur Falek, M.D., and Suzanne Schimpler of the Georgia Mental Health Institute, established birth defects surveillance in metropolitan Atlanta (3). This local surveillance program provided not only excellent surveillance data but also the foundation on which CDC built a group of public health scientists dedicated to determining the causes of birth defects and to preventing birth defects. One purpose of birth defects surveillance is to provide an early warning of an "emerging" birth defects problem. Moreover, an important rationale for birth defects surveillance is that appropriate surveillance programs might have enabled more rapid identification of the birth defects associated with maternal use of thalidomide in Europe during the late 1950s and early 1960s and, thereby, might have contributed to a more timely ending of that tragic epidemic. However, subsequent epidemics of birth defects cannot be predicted, and a single local surveillance system, while providing useful information about exposures that are distributed relatively equally throughout the country, cannot provide data about other regions. For these reasons, in the early 1970s, Virginia Apgar, M.D., and her colleagues at the March of Dimes/Birth Defects Foundation articulated the need for a national birth defects surveillance system. After discussions with Dr. Apgar and her colleagues, CDC's William Flynt, M.D., with funding from the National Institute for Child Health and Human Development, established the national BDMP in 1973 (4). In the August 31, 1979, issue of MMWR, BDMP rates for 16 birth defects during 1970-1971 were compared with those during 1976-1977; the results indicated that the reported rates for most birth defects were stable, although rates for some were either increasing or decreasing. These findings indicated that the epidemiologies of various birth defects can be as different as the varying epidemiologies of different infectious diseases. The figure presented in the 1979 MMWR showed declines in the rates of spina bifida and anencephaly -- two common and severe birth defects with many similar epidemiologic findings. These declines were consistent with improvement in the environment (e.g., improved nutrition and fewer exposures to harmful chemicals). During the weeks surrounding publication of the 1979 MMWR, CDC staff members learned of a study in England suggesting that one or more vitamins might prevent spina bifida and anencephaly (5). At the same time, CDC's David Erickson, D.D.S., and colleagues were designing the Atlanta birth defects case-control study to assess the increased risk for birth defects among children of Vietnam veterans (6); the design included questions about the mothers' use of vitamins before and during the early weeks of pregnancy. Findings of this study included a strong association between regular maternal consumption of multivitamins before and during early pregnancy and a reduction in risk for having a child with spina bifida and/or anencephaly (7). In 1991, the results of a randomized clinical trial from the United Kingdom established that folic acid was the specific vitamin associated with prevention of spina bifida and anencephaly (8). Following publication of those results, the CDC birth defects group assisted in fostering a science-based public policy for this "emerged" prevention opportunity. In particular, CDC guidelines for high-risk women (i.e., those with a previous spina bifida- or anencephaly-affected pregnancy) were published in MMWR 2 weeks after the publication of the randomized clinical trial (9). Findings of earlier case-control studies (7) supported the Public Health Service (PHS) recommendation published September 11, 1992, that all women of reproductive age consume 400 ug of folic acid each day to prevent neural tube defects (10). In the United States, these two recommendations have served as the foundation for intervention programs subsequently implemented by industry, public health organizations, and voluntary agencies (e.g., the March of Dimes Birth Defects Foundation and the Spina Bifida Association of America). In 1996, the Food and Drug Administration issued regulations that required "enriched" cereal-grain products to be fortified with folic acid no later than January 1, 1998 (11). As a result of this fortification, the consumption of folic acid by U.S. women will increase by 100 ug per day. Birth defects surveillance data are important in evaluating the effectiveness of prevention programs. The BDMP was discontinued during the mid-1990s because of changing technology, but was replaced by a network of state-based surveillance systems. In 1992, Congress mandated that CDC establish such a network to collect, analyze, and share data needed to prevent birth defects. By 1996, CDC assistance to states had included the establishment of the National Birth Defects Prevention Network (NBDPN), with a mission of creating and maintaining a national network of state- and population-based programs for birth defects surveillance and research. These programs assess the impact of birth defects on children and families; identify factors that can be used to develop primary prevention strategies; and assist families and their health-care providers in secondary prevention of disabilities. NBDPN recently reported on data from 21 states (12). These surveillance systems will be used to assist health officials in assessing efforts to prevent folic acid-preventable birth defects and in providing surveillance data for etiologic research. State-based birth defects surveillance systems have not yet detected changes in the rates of spina bifida and anencephaly. Conversely, surveys of folic acid consumption indicate that approximately 45 million women of reproductive age still do not consume sufficient folic acid to protect the children they may have from neural tube defects (13). During the next 10 years, additional programs to increase the amount of folic acid consumed by women of reproductive age could result in the prevention of most folic-acid preventable spina bifida. In 1996, CDC intensified efforts to prevent birth defects by establishing a new program comprising eight Centers for Birth Defects Research and Prevention (CBDRP). These eight centers collaborate in epidemiologic studies to provide a timely, continuing source of information on potential causes of birth defects. Each center also will maintain center-specific, investigator-initiated research projects. This new program should assist in advancing the prevention of birth defects by identifying modifiable causes of birth defects, just as earlier epidemiologic studies identified folic acid as the agent that can prevent serious birth defects in thousands of children each year. 1997 Editorial Note by: Godfrey P Oakley, MD, Director, Division of Birth Defects and Developmental Disabilities, National Center for Environmental Health, CDC. References
Table_1 Note: To print large tables and graphs users may have to change their printer settings to landscape and use a small font size.
TABLE 1. Incidence of selected malformations reported to the Birth Defects Monitoring Program, 1970-1971 and 1976-1977
=======================================================================================================================
                                                Cases                   Rates*
                                       -----------------------  ---------------------
                                        1970-1971   1976-1977   1970-1971   1976-1977
                                       ----------------------------------------------           Mean annual
Malformation                                                                                 percent change
-----------------------------------------------------------------------------------------------------------------------
Anencephaly                                 949         833        5.48        3.94                   - 5.4
Spina bifida without anencephaly          1,306       1,053        7.55        4.97                   - 6.7
Hydrocephalus without spina bifida          833         925        4.81        4.37                   - 1.6
Transposition of great vessels              131         175        0.76        0.83                     1.5
Ventricular septal defect                   770       1,889        4.45        8.92                    12.3
Patent ductus arteriosus                    686       2,804        3.96       13.25                    22.3
Cleft palate without cleft lip              873       1,093        5.05        5.16                     0.4
Cleft lip with or without cleft palate    1,715       1,890        9.91        8.93                   - 1.7
Clubfoot without CNS+ defects             4,756       4,912       27.49       23.21                   - 2.8
Reduction deformity                         547         705        3.16        3.33                     0.9
Hip dislocation without CNS defects       1,382       6,407        7.99       30.27                    24.9
Tracheo-esophageal fistula                  289         327        1.67        1.54                   - 1.3
Rectal atresia and stenosis                 648         679        3.75        3.21                   - 2.6
Renal agenesis                              123         263        0.71        1.24                     9.7
Hypospadias                               3,565       5,036       40.02       46.22&                    2.4
Down's syndrome                           1,413       1,590        8.17        7.51                   - 1.4
-----------------------------------------------------------------------------------------------------------------------
* Cases per 10,000 total births.
+ Central nervous system.
& Cases per 10m000 male births.
=======================================================================================================================
Return to top. Figure_1 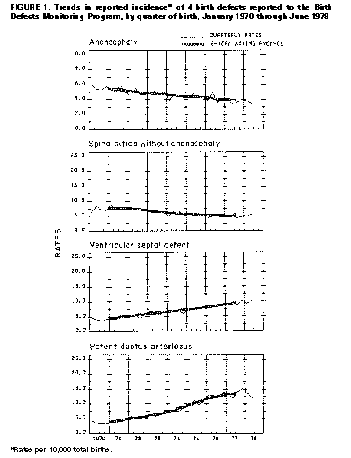 Return to top. Disclaimer All MMWR HTML versions of articles are electronic conversions from ASCII text into HTML. This conversion may have resulted in character translation or format errors in the HTML version. Users should not rely on this HTML document, but are referred to the electronic PDF version and/or the original MMWR paper copy for the official text, figures, and tables. An original paper copy of this issue can be obtained from the Superintendent of Documents, U.S. Government Printing Office (GPO), Washington, DC 20402-9371; telephone: (202) 512-1800. Contact GPO for current prices. **Questions or messages regarding errors in formatting should be addressed to mmwrq@cdc.gov.Page converted: 09/19/98 |
|||||||||
This page last reviewed 5/2/01
|