 |
|
|
|
|
|
|
| ||||||||||
|
|
|
|
|
|
|
||||
| ||||||||||
|
|
|
|
|
Persons using assistive technology might not be able to fully access information in this file. For assistance, please send e-mail to: mmwrq@cdc.gov. Type 508 Accommodation and the title of the report in the subject line of e-mail. Alcohol Involvement in Fatal Motor-Vehicle Crashes -- United States, 1995-1996The table (Table_1) and figure (Figure_1) on page 1155 compare alcohol involvement in fatal motor-vehicle crashes for 1995 and 1996. A fatal crash is considered alcohol-related by the National Highway Traffic Safety Administration (NHTSA) if either a driver or nonoccupant (e.g., pedestrian) had a blood alcohol concentration (BAC) of greater than or equal to 0.01 g/dL in a police-reported traffic crash. Because BACs are not available for all persons in fatal crashes, NHTSA estimates the number of alcohol-related traffic fatalities based on a discriminant analysis of information from all cases for which driver or nonoccupant BAC data are available (1). Overall, the number of alcohol-related traffic fatalities decreased by less than 1% from 1995 to 1996; for BACs of 0.01-0.09 g/dL, the decrease was 0.5%, for BACs greater than or equal to 0.10 g/dL (the legal limit of intoxication for adults in most states), the decrease was 1.0%. A notable increase (9.8%) occurred among those aged 15-20 years where a driver or nonoccupant had a BAC greater than or equal to 0.10 g/dL. Reference
Table_1 Note: To print large tables and graphs users may have to change their printer settings to landscape and use a small font size.
Changes in the estimated number and percentage of traffic fatalities
(including drivers, occupants, and nonoccupants), by age group * and
highest blood alcohol concentration (BAC)+ of driver & or nonoccupant
in crashes -- United States, January 1 - December 31, 1995, compared
with January 1 - December 31, 1996
=====================================================================
                                No. fatalities
                                ------------------------
Age group (yrs)                 1995            1996
--------------------------------------------------------
  <15 @                         2,203           2,193
15-20                           4,013           4,004
21-24                           1,845           1,766
25-34                           3,252           3,192
35-64                           7,293           7,619
 >=65                           5,923           5,945
Total **                       24,529          24,721

  <15 @                           211             193
15-20                             739             698
21-24                             526             530
25-34                             797             782
35-64                           1,103           1,134
 >=65                             364             384
Total **                        3,739           3,721

  <15 @                           384             374
15-20                           1,473           1,617
21-24                           1,894           1,816
25-34                           3,869           3,636
35-64                           5,132           5,144
 >=65                             712             749
Total **                       13,464          13,336
---------------------------------------------------------------------
*  Age was unknown for 84 traffic fatalities in 1995 and 130 traffic
   fatalities in 1996.
+  BAC distributions are estimates for drivers and nonoccupants
   involved in fatal crashes. Fatalities include all occupants and
   nonoccupants who died within 30 days of a motor vehicle crash
   on a public roadway and whose age was known.
&  Driver may or may not have been killed.
@  Although usually too young to drive legally, persons in this age
   group are included for completeness.
** The number of fatalities for each BAC category is rounded to the
   nearest whole number.
====================================================================
Return to top. Figure_1 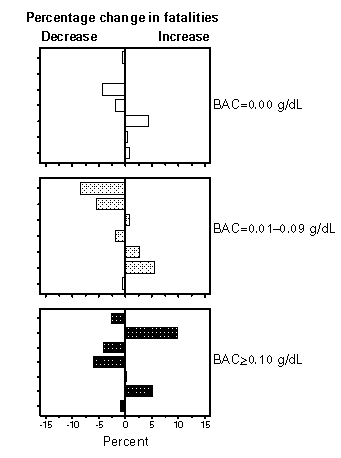 Return to top. Disclaimer All MMWR HTML versions of articles are electronic conversions from ASCII text into HTML. This conversion may have resulted in character translation or format errors in the HTML version. Users should not rely on this HTML document, but are referred to the electronic PDF version and/or the original MMWR paper copy for the official text, figures, and tables. An original paper copy of this issue can be obtained from the Superintendent of Documents, U.S. Government Printing Office (GPO), Washington, DC 20402-9371; telephone: (202) 512-1800. Contact GPO for current prices. **Questions or messages regarding errors in formatting should be addressed to mmwrq@cdc.gov.Page converted: 09/19/98 |
|||||||||
This page last reviewed 5/2/01
|