 |
|
|
|
|
|
|
| ||||||||||
|
|
|
|
|
|
|
||||
| ||||||||||
|
|
|
|
|
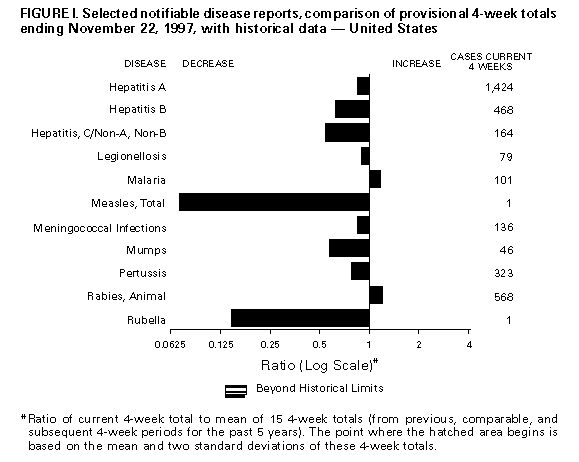
Persons using assistive technology might not be able to fully access information in this file. For assistance, please send e-mail to: mmwrq@cdc.gov. Type 508 Accommodation and the title of the report in the subject line of e-mail. Notifiable Diseases/Deaths in Selected Cities Weekly InformationFigure_I Selected notifiable disease reports, comparison of provisional 4-week totals ending November 22, 1997, with historical data -- United States Table_I Summary -- provisional cases of selected notifiable diseases, United States, cumulative, week ending November 22, 1997 (47th Week) Table_II Provisional cases of selected notifiable diseases, United States, weeks ending November 22, 1997 and November 23, 1996 (47th Week) Table_III Provisional cases of selected notifiable diseases preventable by vaccination, United States, weeks ending November 22, 1997 and November 23, 1996 (47th Week) Table_IV Deaths in 122 U.S. cities, week ending
November 22, 1997 (47th Week)
TABLE I. Summary -- provisional cases of specified notifiable diseases, United
States, cumulative, week ending November 22, 1997 (47th Week)
==================================================================================
                                             Cum. 1997
------------------------------------------------------
Anthrax                                              -
Brucellosis                                         70
Cholera                                              9
Congenital rubella syndrome                          4
Cryptosporidiosis*                               1,770
Diphtheria                                           5
Encephalitis:  California*                         110
               eastern equine*                       7
               St. Louis*                           14
               western equine*                       -
Hansen Disease                                      99
Hantavirus pulmonary syndrome*+                     16
Hemolytic uremic syndrome, post-diarrheal*          58
HIV infection, pediatric*&                         197
Plague                                               3
Poliomyelitis, paralytic@                            1
Psittacosis                                         38
Rabies, human                                        2
Rocky Mountain spotted fever (RMSF)                383
Streptococcal disease, invasive Group A          1,251
Streptococcal toxic-shock syndrome*                 29
Syphilis, congenital**                             525
Tetanus                                             41
Toxic-shock syndrome                               118
Trichinosis                                          8
Typhoid fever                                      316
Yellow fever                                         -
------------------------------------------------------
-: no reported cases
 * Not notifiable in all states
 + Updated weekly from reports to the Division of Viral and Rickettsial
   Diseases, National Center for Infectious Diseases (NCID).
 & Updated monthly to the Division of HIV/AIDS Prevention, National Center
   for HIV, STD, and TB Prevention (NCHSTP), last update October 28, 1997.
 @ One suspected case of polio with onset in 1997 has also been reported
   to date.
** Updated quarterly from reports to the Division of STD Prevention,
   NCHSTP.

==================================================================================
Return to top. Table_II Note: To print large tables and graphs users may have to change their printer settings to landscape and use a small font size.
TABLE II. (page 1) Provisional cases of selected notifiable diseases, United States, weeks ending
November 22, 1997, and November 23, 1996 (47th Week)
Escherichia
coli O157:H7
------------------- Hepatitis
AIDS* Chlamydia NETSS** PHLIS*** Gonorrhea C\NA,NB
----------------- -------------------- -------- -------- ------------------- ----------------
Cum. Cum. Cum. Cum. Cum. Cum. Cum. Cum. Cum. Cum.
Reporting Area 1997 1996 1997 1996 1997 1997 1997 1996 1997 1996
------------------------------------------------------------------------------------------------------------------------------
UNITED STATES 49,050 59,765 419,339 385,425 2,180 1,449 260,921 288,556 2,825 3,166
NEW ENGLAND 2,112 2,534 15,921 15,605 189 118 5,284 5,777 51 93
Maine 50 42 906 838 17 - 61 50 - -
N.H. 35 85 725 685 12 14 83 147 8 7
Vt. 32 18 385 357 8 3 46 42 2 24
Mass. 734 1,248 6,699 6,292 102 86 1,955 1,963 34 56
R.I. 133 158 1,687 1,678 10 - 375 452 7 6
Conn. 1,128 983 5,519 5,755 40 15 2,764 3,123 - -
MID. ATLANTIC 15,008 16,340 55,104 53,021 131 46 34,146 38,673 317 273
Upstate N.Y. 2,274 2,273 N N 91 - 5,552 6,760 241 218
N.Y. City 8,026 8,715 28,847 25,391 11 7 13,187 12,341 - 3
N.J. 2,903 3,258 8,604 11,317 29 24 6,619 8,115 - -
Pa. 1,805 2,094 17,653 16,313 N 15 8,788 11,457 76 52
E.N. CENTRAL 3,578 4,612 62,847 77,233 387 264 38,510 53,403 461 438
Ohio 724 1,019 17,838 18,830 101 49 11,196 13,717 18 33
Ind. 462 495 8,258 8,926 77 40 5,415 5,889 11 8
Ill. 1,523 2,078 9,826 21,416 66 31 4,772 15,164 72 84
Mich. 641 779 18,840 18,652 143 100 13,531 14,183 360 313
Wis. 228 241 8,085 9,409 N 44 3,596 4,450 - -
W.N. CENTRAL 964 1,419 27,653 28,589 519 393 12,286 13,825 147 87
Minn. 177 269 5,551 4,494 226 198 1,974 1,881 4 4
Iowa 93 80 3,943 3,960 115 73 1,018 1,077 32 38
Mo. 452 741 10,800 11,285 53 66 6,717 7,812 96 22
N. Dak. 13 12 623 901 15 12 44 32 3 -
S. Dak. 8 12 1,134 1,313 28 32 129 165 - -
Nebr. 84 88 2,100 2,566 59 - 866 990 3 8
Kans. 137 217 3,502 4,070 23 12 1,538 1,868 9 15
S. ATLANTIC 12,066 14,817 81,859 45,730 200 128 81,165 84,689 247 180
Del. 194 247 1,276 1,148 5 4 1,117 1,325 - 1
Md. 1,741 2,150 6,766 U 24 12 11,849 10,120 18 4
D.C. 895 1,132 N N 2 - 4,011 4,082 - -
Va. 1,011 1,027 10,417 10,582 N 41 7,819 8,336 24 16
W. Va. 112 103 2,658 2,049 N 1 848 723 16 9
N.C. 761 831 16,663 U 68 34 16,523 17,026 47 46
S.C. 698 715 11,326 U 9 7 10,416 10,380 37 28
Ga. 1,468 2,069 10,978 11,197 41 - 12,844 16,657 U -
Fla. 5,186 6,543 21,775 20,754 43 29 15,738 16,040 105 76
E.S. CENTRAL 1,749 2,071 29,154 29,185 94 39 29,342 32,488 313 533
Ky. 319 362 5,695 6,053 30 - 3,662 3,853 12 29
Tenn. 684 726 11,518 12,201 46 39 10,090 10,880 218 371
Ala. 456 569 7,764 7,583 14 - 10,852 12,217 11 7
Miss. 290 414 4,177 3,348 4 - 4,738 5,538 72 126
W.S. CENTRAL 5,206 6,241 54,857 47,592 67 16 36,297 33,241 459 346
Ark. 193 245 2,296 1,591 9 5 3,953 3,656 10 8
La. 899 1,335 9,098 6,680 6 3 8,862 7,225 213 194
Okla. 256 245 6,665 6,703 10 5 4,328 4,379 7 1
Tex. 3,858 4,416 36,798 32,618 42 3 19,154 17,981 229 143
MOUNTAIN 1,409 1,790 21,690 23,631 233 136 7,585 6,838 433 526
Mont. 36 34 999 1,124 24 - 41 34 21 18
Idaho 48 36 1,470 1,373 35 23 133 93 63 96
Wyo. 13 6 542 547 16 12 47 39 217 171
Colo. 332 461 1,896 3,260 82 57 2,038 1,283 35 62
N. Mex. 145 154 2,838 3,579 7 6 1,031 811 52 72
Ariz. 348 535 10,501 9,692 N 28 3,518 3,360 25 69
Utah 119 172 1,589 1,412 58 - 249 262 5 19
Nev. 368 392 1,855 2,644 11 10 528 956 15 19
PACIFIC 6,958 9,940 70,254 64,839 360 306 16,306 19,622 397 690
Wash. 576 637 8,405 8,389 116 131 1,759 1,887 24 50
Oreg. 261 438 4,499 4,851 76 83 672 772 3 8
Calif. 6,004 8,665 54,472 48,833 156 82 13,098 16,143 230 432
Alaska 37 30 1,330 1,139 12 3 329 395 - 3
Hawaii 80 170 1,548 1,627 N 7 448 425 140 197
Guam 2 4 193 335 N - 27 61 - 6
P.R. 1,714 2,014 U U 41 U 499 595 141 140
V.I. 86 17 N N N U - - - -
Amer. Samoa - - - - N U - - - -
C.N.M.I. 1 - N N N U 17 11 2 -
------------------------------------------------------------------------------------------------------------------------------
N: Not notifiable U: Unavailable -: no reported cases C.N.M.I.: Commonwealth of North Mariana Islands
* Updated monthly to the Division of HIV/AIDS Prevention, National Center for HIV, STD, and TB Prevention, last update October 28, 1997.
** National Electronic Telecommunications System for Surveillance.
*** Public Health Laboratory Information System.
=======================================================================================================================================================
TABLE II. (page 2) Provisional cases of selected notifiable diseases, United States, weeks ending
November 22, 1997, and November 23, 1996 (47th Week)
Lyme Syphilis Rabies,
Legionellosis Disease Malaria (Primary & Secondary) Tuberculosis Animal
---------------- ---------------- ---------------- --------------------- ----------------- -------
Cum. Cum. Cum. Cum. Cum. Cum. Cum. Cum. Cum. Cum. Cum.
Reporting Area 1997 1996 1997 1996 1997 1996 1997 1996 1997 1996 1997
-------------------------------------------------------------------------------------------------------------------------------------------
UNITED STATES 918 993 9,630 14,256 1,585 1,492 7,229 10,455 15,306 17,519 7,183
NEW ENGLAND 72 67 2,799 3,899 78 70 119 169 397 372 1,132
Maine 2 2 8 53 1 8 2 - 11 19 206
N.H. 7 4 38 46 8 3 - 1 15 14 43
Vt. 12 5 8 23 2 8 - - 5 1 109
Mass. 23 27 335 258 29 25 59 70 231 185 250
R.I. 11 29 380 479 7 8 2 4 31 27 34
Conn. 17 N 2,030 3,040 31 18 56 94 104 126 490
MID. ATLANTIC 194 220 5,530 8,790 391 432 334 475 2,797 3,242 1,526
Upstate N.Y. 62 67 2,221 4,075 61 78 34 67 333 407 1,121
N.Y. City 9 19 89 391 223 257 79 129 1,468 1,674 U
N.J. 20 14 1,354 1,949 77 65 119 163 616 668 174
Pa. 103 120 1,866 2,375 30 32 102 116 380 493 231
E.N. CENTRAL 272 321 91 406 125 161 615 1,499 1,406 1,791 174
Ohio 118 101 56 27 18 13 187 562 228 280 114
Ind. 45 50 29 30 16 14 148 194 132 166 13
Ill. 14 31 6 10 39 78 66 411 709 913 19
Mich. 81 97 - 20 39 40 128 166 247 341 28
Wis. 14 42 U 319 13 16 86 166 90 91 -
W.N. CENTRAL 71 59 143 210 58 42 157 320 486 446 431
Minn. 3 10 111 106 28 19 13 38 133 98 55
Iowa 12 10 8 18 10 2 8 23 45 59 143
Mo. 32 17 17 46 11 10 105 217 210 180 23
N. Dak. 2 - - 1 3 1 - - 12 8 69
S. Dak. 2 2 1 - 1 - - - 10 17 62
Nebr. 15 15 2 5 1 3 5 10 17 21 2
Kans. 5 5 4 34 4 7 26 32 59 63 77
S. ATLANTIC 118 154 695 663 325 282 2,946 3,471 3,017 3,221 2,884
Del. 11 11 69 170 5 4 20 35 18 36 54
Md. 24 32 460 332 81 80 836 648 287 263 558
D.C. 4 7 9 3 19 8 102 117 91 123 5
Va. 25 37 61 49 64 53 220 359 275 282 625
W. Va. N N 10 11 1 5 3 9 49 50 82
N.C. 14 12 32 63 18 28 662 978 375 460 838
S.C. 8 6 2 6 18 12 333 360 242 315 173
Ga. 1 3 7 1 46 27 490 627 545 585 298
Fla. 30 46 45 28 73 65 280 338 1,135 1,107 251
E.S. CENTRAL 46 48 72 75 32 38 1,480 2,260 1,038 1,231 259
Ky. 7 9 9 26 8 10 123 143 138 210 27
Tenn. 31 19 39 20 8 14 673 776 357 422 143
Ala. 4 5 10 8 10 6 380 503 387 385 84
Miss. 4 15 14 21 6 8 304 838 156 214 5
W.S. CENTRAL 36 23 89 111 54 60 1,101 1,604 2,194 2,216 317
Ark. - 1 25 22 5 1 130 231 171 182 54
La. 6 2 3 6 13 7 331 455 198 200 5
Okla. 7 10 26 22 8 - 112 167 154 154 103
Tex. 23 10 35 61 28 52 528 751 1,671 1,680 155
MOUNTAIN 61 51 21 8 64 58 189 141 435 564 177
Mont. 1 1 - - 2 7 - - 17 18 46
Idaho 2 - 4 1 - - 1 4 13 7 -
Wyo. 1 7 5 3 2 7 - 2 2 6 31
Colo. 17 9 6 - 29 24 14 24 75 77 24
N. Mex. 3 2 1 1 8 2 16 7 53 79 12
Ariz. 12 19 2 - 11 7 144 83 202 214 50
Utah 18 6 1 1 3 5 5 2 27 51 6
Nev. 7 7 2 2 9 6 9 19 46 112 8
PACIFIC 48 50 190 94 458 349 288 516 3,536 4,436 283
Wash. 8 6 10 17 46 22 9 9 225 252 -
Oreg. - - 18 19 24 23 9 9 137 154 14
Calif. 39 38 160 57 378 291 268 495 2,969 3,784 246
Alaska - 1 2 - 3 3 1 - 66 65 23
Hawaii 1 5 - 1 7 10 1 3 139 181 -
Guam - 1 - - - - 3 3 13 76 -
P.R. - - - - 5 2 217 194 164 182 63
V.I. - 1 - - - 1 - - - - -
Amer. Samoa - - - - - - - - - - -
C.N.M.I. - - - - - - 9 1 2 - -
-------------------------------------------------------------------------------------------------------------------------------------------
N: Not notifiable U: Unavailable -: no reported cases
=======================================================================================================================================================
Return to top. Table_III Note: To print large tables and graphs users may have to change their printer settings to landscape and use a small font size.
TABLE III. (page 1) Provisional cases of selected notifiable diseases preventable by vaccination, United
States, weeks ending November 22, 1997, and November 23, 1996 (47th Week)
Hepatitis (Viral), by type Measles (Rubeola)
H. influenzae, --------------------------------------- ------------------------------------------------------------
invasive A B Indigenous Imported** Total
---------------- ----------------- ----------------- --------------- --------------- ---------------
Cum. Cum. Cum. Cum. Cum. Cum. Cum. Cum. Cum. Cum.
Reporting Area 1997* 1996 1997 1996 1997 1996 1997 1997 1997 1997 1997 1996
-----------------------------------------------------------------------------------------------------------------------------------------------------
UNITED STATES 937 910 25,390 26,210 7,937 8,877 - 71 - 55 126 491
NEW ENGLAND 56 32 579 386 135 195 - 11 - 8 19 16
Maine 5 - 59 22 6 2 - - - 1 1 -
N.H. 9 11 32 20 15 17 - 1 - - 1 -
Vt. 3 1 13 12 7 12 - - - - - 2
Mass. 34 18 224 182 48 76 - 10 - 6 16 12
R.I. 3 2 126 22 14 10 - - - - - -
Conn. 2 - 125 128 45 78 - - - 1 1 2
MID. ATLANTIC 126 189 1,730 1,784 1,186 1,274 - 18 - 8 26 37
Upstate N.Y. 33 46 322 406 279 306 - 2 - 3 5 11
N.Y. City 32 49 634 554 406 449 - 8 - 2 10 11
N.J. 42 55 246 339 200 260 - 3 - - 3 3
Pa. 19 39 528 485 301 259 - 5 - 3 8 12
E.N. CENTRAL 143 163 2,506 2,344 806 985 - 6 - 3 9 20
Ohio 81 85 290 693 79 114 - - - - - 5
Ind. 14 13 296 326 88 127 - - - - - -
Ill. 33 47 598 684 192 310 - 6 - 1 7 3
Mich. 14 9 1,185 459 406 350 - - - 2 2 3
Wis. 1 9 137 182 41 84 U - U - - 9
W.N. CENTRAL 59 38 1,984 2,379 423 481 - 12 - 5 17 23
Minn. 44 23 191 129 42 59 - 3 - 5 8 18
Iowa 7 4 433 311 41 66 - - - - - 1
Mo. 4 8 987 1,259 292 283 - 1 - - 1 3
N. Dak. - - 10 135 4 2 - - - - - -
S. Dak. 2 1 21 42 1 5 - 8 - - 8 -
Nebr. 1 1 101 143 15 37 - - - - - -
Kans. 1 1 241 360 28 29 - - - - - 1
S. ATLANTIC 156 165 1,883 1,251 1,157 1,211 - 1 - 13 14 11
Del. - 2 30 20 6 9 - - - - - 1
Md. 55 58 201 220 169 154 - - - 2 2 2
D.C. - 5 32 36 29 32 - - - 1 1 -
Va. 13 9 211 171 115 130 - - - 1 1 3
W. Va. 4 10 11 15 16 30 - - - - - -
N.C. 21 24 187 163 235 313 - - - 2 2 2
S.C. 4 5 99 50 90 91 - - - 1 1 -
Ga. 32 34 559 149 126 32 - - - 1 1 2
Fla. 27 18 553 427 371 420 - 1 - 5 6 1
E.S. CENTRAL 45 25 560 1,182 639 828 - - - - - 2
Ky. 6 6 68 51 34 75 - - - - - -
Tenn. 25 9 343 741 413 464 - - - - - 2
Ala. 14 9 81 186 72 71 - - - - - -
Miss. - 1 68 204 120 218 - - - - - -
W.S. CENTRAL 48 38 5,364 5,257 1,147 1,123 - 3 - 5 8 26
Ark. 1 - 207 438 59 77 - - - - - -
La. 13 4 219 180 160 140 - - - - - -
Okla. 29 29 1,326 2,236 46 24 - - - 1 1 -
Tex. 5 5 3,612 2,403 882 882 - 3 - 4 7 26
MOUNTAIN 84 51 3,975 4,076 819 1,054 - 6 - 2 8 157
Mont. - 1 69 110 12 16 - - - - - -
Idaho 1 1 123 224 46 86 - - - - - 1
Wyo. 4 - 37 33 38 44 - - - - - 1
Colo. 14 15 384 455 141 120 - - - - - 7
N. Mex. 9 10 330 337 239 390 - - - - - 17
Ariz. 30 17 2,123 1,546 189 219 - 5 - - 5 8
Utah 3 7 527 969 87 94 - - - 1 1 118
Nev. 23 - 382 402 67 85 U 1 U 1 2 5
PACIFIC 220 209 6,809 7,551 1,625 1,726 - 14 - 11 25 199
Wash. 5 4 588 683 70 94 - 1 - 1 2 38
Oreg. 30 29 346 816 100 121 - - - - - 14
Calif. 171 168 5,716 5,906 1,424 1,484 - 11 - 8 19 45
Alaska 7 6 32 44 21 15 - - - - - 63
Hawaii 7 2 127 102 10 12 - 2 - 2 4 39
Guam - - - 7 3 1 U - U - - -
P.R. - 2 251 225 1,336 926 - - - - - 3
V.I. - - - 35 - 39 U - U - - -
Amer. Samoa - - - - - - U - U - - -
C.N.M.I. 6 10 1 1 34 5 U 1 U - 1 -
-----------------------------------------------------------------------------------------------------------------------------------------------------
N: Not notifiable U: Unavailable -: no reported cases
* Of 211 cases among children aged <5 years, serotype was reported for 112 and of those, 47 were type b.
** For imported measles, cases include only those resulting from importation from other countries.
=======================================================================================================================================================
TABLE III. (page 2) Provisional cases of selected notifiable diseases preventable by vaccination, United
States, weeks ending November 22, 1997, and November 23, 1996 (47th Week)
Meningococcal
Disease Mumps Pertussis Rubella
----------------- -------------------------- --------------------------- ---------------------------
Cum. Cum. Cum. Cum. Cum. Cum. Cum. Cum.
Reporting Area 1997 1996 1997 1997 1996 1997 1997 1996 1997 1997 1996
------------------------------------------------------------------------------------------------------------------------------------------
UNITED STATES 2,851 2,941 16 539 633 138 4,641 5,854 - 157 221
NEW ENGLAND 179 128 - 9 1 7 815 1,383 - 1 27
Maine 17 12 - - - 1 7 48 - - -
N.H. 15 7 - - - 1 124 141 - - -
Vt. 4 4 - - - 2 214 192 - - 2
Mass. 87 56 - 2 1 3 428 940 - 1 21
R.I. 19 14 - 6 - - 16 30 - - -
Conn. 37 35 - 1 - - 26 32 - - 4
MID. ATLANTIC 294 316 3 51 83 10 338 519 - 31 13
Upstate N.Y. 66 82 - 9 24 1 123 301 - 4 5
N.Y. City 42 46 - 3 18 - 59 50 - 27 5
N.J. 63 64 1 6 4 - 9 31 - - 2
Pa. 123 124 2 33 37 9 147 137 - - 1
E.N. CENTRAL 407 414 2 66 118 12 409 699 - 5 3
Ohio 153 142 1 31 41 1 151 254 - - -
Ind. 51 56 - 12 8 1 55 78 - - -
Ill. 124 121 - 12 22 8 85 154 - 2 1
Mich. 47 43 1 11 44 2 46 51 - - 2
Wis. 32 52 U - 3 U 72 162 U 3 -
W.N. CENTRAL 211 211 - 17 20 34 451 375 - - -
Minn. 34 25 - 6 6 10 268 291 - - -
Iowa 45 46 - 9 2 21 90 19 - - -
Mo. 90 80 - - 9 2 61 38 - - -
N. Dak. 2 4 - - 2 - 2 1 - - -
S. Dak. 5 10 - - - - 5 4 - - -
Nebr. 15 21 - 2 - 1 12 9 - - -
Kans. 20 25 - - 1 - 13 13 - - -
S. ATLANTIC 517 560 9 78 103 13 414 613 - 83 91
Del. 5 2 - - - - 1 24 - - -
Md. 42 56 - 7 33 - 114 245 - - -
D.C. 9 5 - - - - 3 3 - 1 1
Va. 57 56 8 18 16 9 51 98 - 1 2
W. Va. 17 16 - - - - 6 2 - - -
N.C. 87 68 - 10 20 3 115 97 - 59 77
S.C. 54 58 - 11 7 1 28 42 - 19 1
Ga. 100 126 - 10 3 - 13 19 - - -
Fla. 146 173 1 22 24 - 83 83 - 3 10
E.S. CENTRAL 218 215 2 27 20 2 126 194 - - 2
Ky. 45 28 - 3 - 1 54 140 - - -
Tenn. 81 59 1 6 1 1 37 21 - - -
Ala. 73 79 - 9 4 - 27 24 - - 2
Miss. 19 49 1 9 15 - 8 9 - - N
W.S. CENTRAL 272 302 - 60 48 18 244 145 - 4 8
Ark. 31 32 - 1 1 - 60 8 - - -
La. 47 57 - 14 13 1 19 9 - - 1
Okla. 39 37 - - 1 17 46 19 - - -
Tex. 155 176 - 45 33 - 119 109 - 4 7
MOUNTAIN 169 169 - 54 24 21 1,064 515 - 6 6
Mont. 9 9 - - - - 19 34 - - -
Idaho 10 23 - 3 - - 573 101 - 1 2
Wyo. 4 4 - 1 1 - 7 8 - - -
Colo. 45 39 - 3 4 10 285 219 - - 2
N. Mex. 28 25 N N N 11 109 62 - - -
Ariz. 41 36 - 32 1 - 35 32 - 5 1
Utah 15 16 - 8 3 - 18 21 - - -
Nev. 17 17 U 7 15 U 18 38 U - 1
PACIFIC 584 626 - 177 216 21 780 1,411 - 27 71
Wash. 79 91 - 19 21 18 356 651 - 5 15
Oreg. 116 114 N N N - 19 60 - - 1
Calif. 380 406 - 131 162 3 378 664 - 14 52
Alaska 2 9 - 4 3 - 14 3 - - -
Hawaii 7 6 - 23 30 - 13 33 - 8 3
Guam 1 4 U 1 10 U - - U - -
P.R. 10 12 - 7 1 - 1 3 - - -
V.I. - - U - 2 U - - U - -
Amer. Samoa - - U - - U - - U - -
C.N.M.I. - - U 4 - U - - U - -
------------------------------------------------------------------------------------------------------------------------------------------
N: Not notifiable U: Unavailable -: no reported cases
=======================================================================================================================================================
Return to top. Table_IV Note: To print large tables and graphs users may have to change their printer settings to landscape and use a small font size.
TABLE IV. Deaths in 122 U.S. cities,* week ending
November 22, 1997 (47th Week)
===================================================================================================================================
All Causes, By Age (Years)
------------------------------------------------------------------------ P&I**
Reporting Area All Ages >=65 45-64 25-44 1-24 <1 Total
---------------------------------------------------------------------------------------------------------------
NEW ENGLAND 556 393 104 39 8 12 40
Boston, Mass. 168 105 40 11 5 7 11
Bridgeport, Conn. 34 28 2 4 - - 3
Cambridge, Mass. 12 7 4 - - 1 1
Fall River, Mass. 39 35 4 - - - 4
Hartford, Conn. 48 32 10 3 1 2 1
Lowell, Mass. 21 15 4 2 - - 5
Lynn, Mass. 18 14 2 2 - - 1
New Bedford, Mass. 27 23 2 2 - - -
New Haven, Conn. 31 20 9 1 1 - 1
Providence, R.I. U U U U U U U
Somerville, Mass. 5 2 3 - - - -
Springfield, Mass. 50 34 11 4 - 1 7
Waterbury, Conn. 30 22 4 3 1 - 2
Worcester, Mass. 73 56 9 7 - 1 4
MID. ATLANTIC 2,293 1,601 467 164 34 27 116
Albany, N.Y. 54 32 20 1 - 1 6
Allentown, Pa. 20 17 2 1 - - 2
Buffalo, N.Y. 60 39 17 2 1 1 3
Camden, N.J. 32 21 6 3 1 1 1
Elizabeth, N.J. 26 19 6 1 - - -
Erie, Pa. 42 33 7 2 - - 4
Jersey City, N.J. 49 36 9 4 - - 6
New York City, N.Y. 1,203 851 231 90 18 13 49
Newark, N.J. 68 30 28 7 3 - 1
Paterson, N.J. 37 21 13 - 2 1 -
Philadelphia, Pa. 300 198 63 30 2 7 13
Pittsburgh, Pa.*** 45 29 11 2 1 2 4
Reading, Pa. 21 18 1 2 - - 1
Rochester, N.Y. 131 104 17 6 3 1 9
Schenectady, N.Y. 25 22 2 1 - - 1
Scranton, Pa. 35 27 5 1 2 - 2
Syracuse, N.Y. 103 76 20 6 1 - 11
Trenton, N.J. 28 17 7 4 - - 3
Utica, N.Y. 14 11 2 1 - - -
Yonkers, N.Y. U U U U U U U
E.N. CENTRAL 2,285 1,577 419 176 55 58 129
Akron, Ohio 54 37 11 1 1 4 -
Canton, Ohio 38 29 6 3 - - 4
Chicago, Ill. 386 231 81 44 13 17 30
Cincinnati, Ohio 118 87 17 10 1 3 13
Cleveland, Ohio 129 84 24 15 3 3 4
Columbus, Ohio 211 147 39 13 8 4 19
Dayton, Ohio 144 106 26 5 5 2 7
Detroit, Mich. 210 126 46 27 8 3 4
Evansville, Ind. 59 48 9 1 - 1 1
Fort Wayne, Ind. 66 47 17 2 - - 4
Gary, Ind. 8 3 3 2 - - -
Grand Rapids, Mich. 66 52 10 1 2 1 2
Indianapolis, Ind. 290 201 51 19 7 12 15
Lansing, Mich. 37 28 4 2 1 2 2
Milwaukee, Wis. 122 92 16 13 1 - 7
Peoria, Ill. 56 37 14 2 1 2 2
Rockford, Ill. 46 37 5 3 1 - -
South Bend, Ind. 56 44 8 2 - 2 5
Toledo, Ohio 114 77 22 11 3 1 8
Youngstown, Ohio 75 64 10 - - 1 2
W.N. CENTRAL 858 619 138 49 25 19 57
Des Moines, Iowa U U U U U U U
Duluth, Minn. 26 22 4 - - - -
Kansas City, Kans. 40 23 10 4 3 - 2
Kansas City, Mo. 114 74 22 9 1 - 5
Lincoln, Nebr. 46 36 6 2 1 1 7
Minneapolis, Minn. 247 188 37 6 7 9 26
Omaha, Nebr. 88 63 10 10 1 4 6
St. Louis, Mo. 100 65 19 11 3 2 -
St. Paul, Minn. 112 85 17 4 5 1 10
Wichita, Kans. 85 63 13 3 4 2 1
S. ATLANTIC 1,124 761 242 78 18 24 53
Atlanta, Ga. 154 90 31 17 6 10 4
Baltimore, Md. 237 157 48 19 7 6 17
Charlotte, N.C. 90 63 24 3 - - 3
Jacksonville, Fla. 108 73 24 8 1 2 3
Miami, Fla. 101 73 20 7 - 1 -
Norfolk, Va. 50 32 13 - 2 3 2
Richmond, Va. U U U U U U U
Savannah, Ga. 68 56 6 5 1 - 6
St. Petersburg, Fla. 46 32 11 2 - 1 1
Tampa, Fla. 190 141 38 9 1 - 15
Washington, D.C. 61 38 17 5 - 1 2
Wilmington, Del. 19 6 10 3 - - -
E.S. CENTRAL 913 648 150 73 25 15 45
Birmingham, Ala. 196 138 37 13 3 3 7
Chattanooga, Tenn. 75 52 15 4 3 1 8
Knoxville, Tenn. 76 53 11 7 3 2 7
Lexington, Ky. 64 52 6 3 - 3 5
Memphis, Tenn. 207 149 30 17 9 2 13
Mobile, Ala. 98 69 15 9 3 2 -
Montgomery, Ala. 49 35 7 5 1 1 3
Nashville, Tenn. 148 100 29 15 3 1 2
W.S. CENTRAL 1,506 1,002 294 132 38 40 74
Austin, Tex. 79 53 18 5 1 2 4
Baton Rouge, La. 34 25 7 2 - - -
Corpus Christi, Tex. 46 38 7 - - 1 3
Dallas, Tex. 204 144 34 14 6 6 6
El Paso, Tex. 58 39 9 6 1 3 5
Ft. Worth, Tex. 100 64 19 9 4 4 2
Houston, Tex. 415 256 86 47 16 10 26
Little Rock, Ark. 71 46 15 7 1 2 3
New Orleans, La. 107 57 25 15 4 6 -
San Antonio, Tex. 201 141 38 16 3 3 12
Shreveport, La. 81 58 16 5 - 2 6
Tulsa, Okla. 110 81 20 6 2 1 7
MOUNTAIN 817 567 146 66 23 14 44
Albuquerque, N.M. 95 72 10 5 7 1 1
Boise, Idaho 40 29 6 2 1 2 -
Colo. Springs, Colo. 54 44 7 2 - 1 3
Denver, Colo. U U U U U U U
Las Vegas, Nev. 139 78 35 20 4 1 6
Ogden, Utah 27 24 2 1 - - 3
Phoenix, Ariz. 174 118 31 16 5 4 18
Pueblo, Colo. 22 14 6 2 - - 2
Salt Lake City, Utah 131 91 20 11 4 5 6
Tucson, Ariz. 135 97 29 7 2 - 5
PACIFIC 1,711 1,185 326 123 45 32 152
Berkeley, Calif. 15 11 2 2 - - -
Fresno, Calif. 68 45 13 6 2 2 7
Glendale, Calif. 15 12 1 2 - - 1
Honolulu, Hawaii 74 51 15 7 1 - 4
Long Beach, Calif. 73 58 11 2 2 - 19
Los Angeles, Calif. 239 158 56 14 7 4 8
Pasadena, Calif. 23 13 7 2 1 - 3
Portland, Oreg. 171 121 29 12 5 4 5
Sacramento, Calif. 187 132 39 10 6 - 19
San Diego, Calif. 157 101 37 11 3 5 21
San Francisco, Calif. 113 70 21 16 2 4 13
San Jose, Calif. 252 180 45 16 5 6 28
Santa Cruz, Calif. 19 17 1 1 - - 3
Seattle, Wash. 146 99 22 14 7 4 5
Spokane, Wash. 64 48 10 4 - 2 7
Tacoma, Wash. 95 69 17 4 4 1 9
TOTAL 12,063**** 8,353 2,286 900 271 241 710
---------------------------------------------------------------------------------------------------------------
U: Unavailable -: no reported cases
* Mortality data in this table are voluntarily reported from 122 cities in the United States, most of which have populations
of 100,000 or more. A death is reported by the place of its occurrence and by the week that the death certificate was
filed. Fetal deaths are not included.
** Pneumonia and influenza.
*** Because of changes in reporting methods in these 3 Pennsylvania cities, these numbers are partial counts for the current
week. Complete counts will be available in 4 to 6 weeks.
**** Total includes unknown ages.
===================================================================================================================================
Return to top. Disclaimer All MMWR HTML versions of articles are electronic conversions from ASCII text into HTML. This conversion may have resulted in character translation or format errors in the HTML version. Users should not rely on this HTML document, but are referred to the electronic PDF version and/or the original MMWR paper copy for the official text, figures, and tables. An original paper copy of this issue can be obtained from the Superintendent of Documents, U.S. Government Printing Office (GPO), Washington, DC 20402-9371; telephone: (202) 512-1800. Contact GPO for current prices. **Questions or messages regarding errors in formatting should be addressed to mmwrq@cdc.gov.Page converted: 09/19/98 |
|||||||||
This page last reviewed 5/2/01
|