 |
|
|
|
|
|
|
| ||||||||||
|
|
|
|
|
|
|
||||
| ||||||||||
|
|
|
|
|
Persons using assistive technology might not be able to fully access information in this file. For assistance, please send e-mail to: mmwrq@cdc.gov. Type 508 Accommodation and the title of the report in the subject line of e-mail. Regional Variations in Suicide Rates -- United States, 1990-1994In 1994, suicides were committed by 31,142 persons in the United States (crude rate: 12.0 suicides per 100,000 population), and suicide was the ninth leading cause of death (1). Although rates of suicide have varied by geographic region (e.g., rates have consistently been higher in western states {2}), reasons for these regional variations are unknown but may reflect regional differences in certain demographic variables. For example, suicide rates have been higher for males, for the elderly, and for certain racial/ethnic groups (e.g., non-Hispanic whites and American Indians/Alaskan Natives) (2). CDC examined U.S. suicide rates from 1990 through 1994 to determine whether regional variations in suicide rates are affected by differences in age, race/Hispanic-ethnicity, and sex and to examine whether method-specific rates varied by region. This report summarizes the results of that analysis, which indicate that, despite adjustments for certain demographic variables, regional differences persist. Suicides in each state were identified using final mortality data from CDC's underlying cause-of-death files for each year during 1990-1994. Suicide and methods of fatal self-inflicted injury were classified using the International Classification of Diseases, Ninth Revision, (codes E950-E959). The three leading methods of suicide (firearms {E955.0-E955.4}, strangulation {E953}, and overdose {E950}) and all other methods (inhalation {E951-E952}, cutting {E956}, drowning {E954}, falls {E957}, and others {E958-E959}) combined were examined. Rates were calculated for 1990-1994 using population data from the 1990 Census enumerations and postcensal year estimates compiled by the U.S. Bureau of the Census. Crude suicide rates for each state were adjusted for age, race/Hispanic-ethnicity, and sex. Overall- and method-specific adjusted suicide rates were examined by region *. During 1990-1994, a total of 154,444 persons committed suicide in the United States; 23,734 (15%) suicides occurred in the Northeast, 34,492 (22%) in the Midwest, 38,709 (25%) in the West, and 57,509 (37%) in the South (Table_1). When state-specific crude suicide rates for the U.S. were ranked by quartiles, the rates from 10 of the 13 western states ranked in the highest quartile. This pattern persisted after adjustments for age, race/Hispanic-ethnicity, and sex (Figure_1). Regional crude suicide rates were highest for persons residing in the West (14.1 per 100,000 population), followed by the South (13.1), Midwest (11.4), and Northeast (9.3). After adjusting for age, race/Hispanic-ethnicity, and sex, rates remained highest in the West (14.7), followed by the South (13.1), Midwest (10.9), and Northeast (8.6). All regional rates were significantly different from the total U.S. adjusted suicide rate (11.8 per 100,000 population) and from each other. Adjusted suicide rates were approximately 70% higher in the West than in the Northeast (rate ratio {RR}=1.7) (3). When suicide rates in each region were stratified by method, rates were highest in the West for all methods except firearms. Firearms were the leading method in all regions, accounting for 69.8% of all suicides in the South, 58.3% in the West, 57.8% in the Midwest, and 44.9% in the Northeast. Regional variations were greatest for overdose- and firearm-related suicide rates. For overdose, the adjusted suicide rate in the West was approximately 100% higher than in the Northeast, which had the lowest rate (RR=2.1). Adjusted firearm suicide rates were highest in the South and were 130% higher than in the Northeast (RR=2.3). Reported by: Div of Violence Prevention, National Center for Injury Prevention and Control, CDC. Editorial NoteEditorial Note: The findings in this report are consistent with previous studies that documented regional differences in suicide rates in the United States. In particular, during 1990-1994, both crude and adjusted suicide rates were significantly higher in the West than in the South, Midwest, and Northeast, and firearms were the leading method employed in all regions. Factors that may account for regional differences in suicide rates are varied and complex. Regional differences in demographic patterns (i.e., age, race/Hispanic-ethnicity, and sex) and in suicide methods do not completely account for variations in suicide, and additional analyses are required to clarify reasons for these differences and to develop tailored prevention strategies. The findings in this report are limited by the constraints inherent in mortality data. Mortality files provide a limited number of variables that may explain regional variations in suicide rates, and reporting levels for some of these variables differ among the states. For example, even though educational attainment is contained in mortality files, this variable was not examined in this analysis because of concerns about quality and completeness of the data in some states. Marital status also is presented on death certificates but was not examined for this report because it is not consistently available in detailed state-level census data. Suicide rates are inversely related to level of education, and are substantially lower among married persons than among persons who are single, separated, divorced, or widowed (2). However, available census data reflect little variation in marital status and educational attainment across regions, and it is unlikely that these variables account for the differences in suicide rates. Despite these limitations, this report documented important region-specific differences in suicide rates both overall and when stratified by method. For example, firearms were the leading method in all regions, accounting for more than half the suicides committed in every region except the Northeast (44.9%). The availability of firearms in homes of suicidal or potentially suicidal persons is associated with increased risk for suicide (4). Although differences in firearm ownership or the availability of firearms may account for some of the regional variation in suicide rates, they do not explain the higher method-specific rates in the West for strangulation, overdose, or other methods. A spectrum of social and environmental factors have been associated with suicidal behavior. For example, levels of residential instability, unemployment, and other indicators of limited economic opportunity may be higher in communities with higher rates of suicide (5,6). Similarly, suicide rates are higher in communities with low levels of social integration and unstable social environments (5-7). Additional efforts are necessary to determine the relation between these factors and variations in regional suicide rates. Arizona, Washington, and other states in the West have initiated prevention strategies designed to reduce the impact of injuries from suicidal behavior (8,9). For example, in Washington, the suicide prevention plan includes multiple interventions such as improving suicide surveillance efforts, public education campaigns, crisis intervention services, and family support programs (10). These strategies should be evaluated and, if documented effective, adapted for use in other states, particularly those with the highest suicide rates. References
* Northeast=Connecticut, Maine, Massachusetts, New Hampshire, New Jersey, New York, Pennsylvania, Rhode Island, and Vermont; Midwest=Illinois, Indiana, Iowa, Kansas, Michigan, Minnesota, Missouri, Nebraska, North Dakota, Ohio, South Dakota, and Wisconsin; South=Alabama, Arkansas, Delaware, District of Columbia, Florida, Georgia, Kentucky, Louisiana, Maryland, Mississippi, North Carolina, Oklahoma, South Carolina, Tennessee, Texas, Virginia, and West Virginia; and West=Alaska, Arizona, California, Colorado, Hawaii, Idaho, Montana, Nevada, New Mexico, Oregon, Utah, Washington, and Wyoming. Figure_1 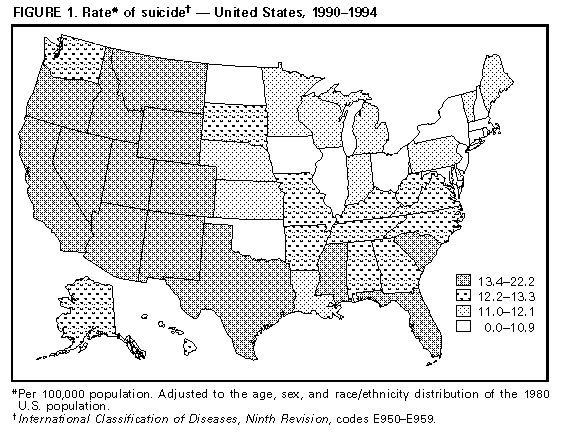 Return to top. Table_1 Note: To print large tables and graphs users may have to change their printer settings to landscape and use a small font size. TABLE 1. Number and rate * of suicides +, by region and state -- United States, 1990-1994 ================================================================================== Region/State No. deaths Crude rate Adjusted rate& (95% CI@) ---------------------------------------------------------------------------------- Northeast Connecticut 1,553 9.5 8.3 ( 7.9- 8.7) Maine 838 13.6 11.3 (10.5-12.1) Massachusetts 2,530 8.4 7.7 ( 7.4- 8.0) New Hampshire 697 12.5 NC** NC New Jersey 2,729 7.0 6.8 ( 6.5- 7.1) New York 7,551 8.4 7.6 ( 7.4- 7.8) Pennsylvania 6,976 11.6 11.0 (10.7-11.3) Rhode Island 454 9.1 8.9 ( 8.1- 9.7) Vermont 406 14.2 11.4 (10.3-12.5) Total 23,734 9.3 8.6 ( 8.5- 8.7) Midwest Illinois 5,717 9.9 9.8 ( 9.5-10.1) Indiana 3,575 12.7 12.0 (11.6-12.4) Iowa 1,598 11.4 10.8 (10.3-11.3) Kansas 1,546 12.3 11.4 (10.8-12.0) Michigan 5,403 11.5 11.0 (10.7-11.3) Minnesota 2,562 11.5 11.1 (10.7-11.5) Missouri 3,448 13.3 12.6 (12.2-13.0) Nebraska 958 12.0 11.4 (10.7-12.1) North Dakota 371 11.7 10.2 ( 9.1-11.3) Ohio 5,875 10.7 10.1 ( 9.8-10.4) South Dakota 479 13.5 12.2 (11.1-13.3) Wisconsin 2,960 11.9 11.3 (10.9-11.7) Total 34,492 11.4 10.9 (10.8-11.0) South Alabama 2,659 12.9 13.0 (12.5-13.5) Arkansas 1,550 12.9 12.3 (11.7-12.9) Delaware 421 12.2 11.7 (10.6-12.8) District of Columbia 177 6.0 6.7 ( 5.7- 7.7) Florida 10,413 15.4 14.3 (14.0-14.6) Georgia 4,275 12.6 13.2 (12.8-13.6) Kentucky 2,572 13.7 12.5 (12.0-13.0) Louisiana 2,727 12.8 NC NC Maryland 2,433 9.9 9.9 ( 9.5-10.3) Mississippi 1,589 12.1 13.4 (12.7-14.1) North Carolina 4,319 12.6 12.4 (12.0-12.8) Oklahoma 2,248 14.0 NC NC South Carolina 2,278 12.7 13.4 (12.8-14.0) Tennessee 3,298 13.1 12.5 (12.1-12.9) Texas 11,316 12.8 14.2 (13.9-14.5) Virginia 4,008 12.6 12.3 (11.9-12.7) West Virginia 1,226 13.6 12.3 (11.6-13.0) Total 57,509 13.1 13.1 (13.0-13.2) West Alaska 451 15.5 11.6 (10.5-12.7) Arizona 3,495 18.1 18.0 (17.4-18.6) California 18,734 12.2 13.8 (13.6-14.0) Colorado 2,936 16.9 16.3 (15.7-16.9) Hawaii 619 10.8 11.3 (10.4-12.2) Idaho 915 17.1 16.6 (15.5-17.7) Montana 794 19.2 18.6 (17.3-19.9) Nevada 1,606 24.1 22.2 (21.1-23.3) New Mexico 1,459 18.4 18.5 (17.5-19.5) Oregon 2,367 15.9 14.8 (14.2-15.4) Utah 1,357 15.0 15.7 (14.9-16.5) Washington 3,512 13.7 12.7 (12.3-13.1) Wyoming 464 20.0 19.8 (18.0-21.6) Total 38,709 14.1 14.7 (14.6-14.8) Total 154,444 12.0 11.8 (11.7-11.9) ---------------------------------------------------------------------------------- * Per 100,000 population. + International Classification of Diseases, Ninth Revision, codes E950-E959. & Adjusted to the age, sex, and race/Hispanic ethnicity of the 1980 U.S. population. @ Confidence interval. ** Not calculated because of incomplete reporting. ================================================================================== Return to top. Disclaimer All MMWR HTML versions of articles are electronic conversions from ASCII text into HTML. This conversion may have resulted in character translation or format errors in the HTML version. Users should not rely on this HTML document, but are referred to the electronic PDF version and/or the original MMWR paper copy for the official text, figures, and tables. An original paper copy of this issue can be obtained from the Superintendent of Documents, U.S. Government Printing Office (GPO), Washington, DC 20402-9371; telephone: (202) 512-1800. Contact GPO for current prices. **Questions or messages regarding errors in formatting should be addressed to mmwrq@cdc.gov.Page converted: 09/19/98 |
|||||||||
This page last reviewed 5/2/01
|