 |
|
|
|
|
|
|
| ||||||||||
|
|
|
|
|
|
|
||||
| ||||||||||
|
|
|
|
|
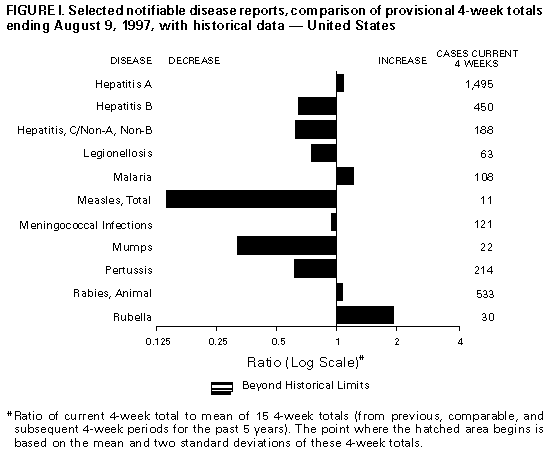
Persons using assistive technology might not be able to fully access information in this file. For assistance, please send e-mail to: mmwrq@cdc.gov. Type 508 Accommodation and the title of the report in the subject line of e-mail. Notifiable Diseases/Deaths in Selected Cities Weekly InformationFigure_I Selected notifiable disease reports, comparison of provisional 4-week totals ending August 9, 1997, with historical data -- United States Table_I Summary -- provisional cases of selected notifiable diseases, United States, cumulative, week ending August 9, 1997 (32nd Week) Table_II Provisional cases of selected notifiable diseases, United States, weeks ending August 9, 1997 and August 10, 1996 (32nd Week) Table_III Provisional cases of selected notifiable diseases preventable by vaccination, United States, weeks ending August 9, 1997 and August 10, 1996 (32nd Week) Table_IV Deaths in 122 U.S. cities, week ending
August 9, 1997 (32nd Week)
TABLE I. Summary -- provisional cases of specified notifiable diseases, United
States, cumulative, week ending August 9, 1997 (32nd Week)
==================================================================================
                                             Cum. 1997
------------------------------------------------------
Anthrax                                              -
Brucellosis                                         43
Cholera                                              3
Congenital rubella syndrome                          2
Cryptosporidiosis*                                 819
Diphtheria                                           5
Encephalitis:  California*                          15
               eastern equine*                       1
               St. Louis*                            1
               western equine*                       1
Hansen Disease                                      66
Hantavirus pulmonary syndrome*+                     12
Hemolytic uremic syndrome, post-diarrheal*          27
HIV infection, pediatric*&                         150
Plague                                               1
Poliomyelitis, paralytic                             -
Psittacosis                                         26
Rabies, human                                        2
Rocky Mountain spotted fever (RMSF)                208
Streptococcal disease, invasive Group A            988
Streptococcal toxic-shock syndrome*                 23
Syphilis, congenital@                              190
Tetanus                                             26
Toxic-shock syndrome                                74
Trichinosis                                          6
Typhoid fever                                      182
Yellow fever                                         -
------------------------------------------------------
-: no reported cases
 * Not notifiable in all states
 + Updated weekly from reports to the Division of Viral and Rickettsial
   Diseases, National Center for Infectious Diseases (NCID).
 & Updated monthly to the Division of HIV/AIDS Prevention, National Center
   for HIV, STD, and TB Prevention (NCHSTP), last update July 29, 1997.
 @ Updated quarterly from reports to the Division of STD Prevention,
   NCHSTP.

==================================================================================
Return to top. Table_II Note: To print large tables and graphs users may have to change their printer settings to landscape and use a small font size.
TABLE II. (page 1) Provisional cases of selected notifiable diseases, United States, weeks ending
August 9, 1997, and August 10, 1996 (32nd Week)
Escherichia
coli O157:H7
------------------- Hepatitis
AIDS* Chlamydia NETSS** PHLIS*** Gonorrhea C\NA,NB
----------------- -------------------- -------- -------- ------------------- ----------------
Cum. Cum. Cum. Cum. Cum. Cum. Cum. Cum. Cum. Cum.
Reporting Area 1997 1996 1997 1996 1997 1997 1997 1996 1997 1996
------------------------------------------------------------------------------------------------------------------------------
UNITED STATES 34,732 40,090 256,848 260,894 1,184 672 161,292 191,236 1,915 2,171
NEW ENGLAND 1,478 1,713 10,579 10,388 106 46 3,587 3,893 43 61
Maine 36 29 590 547 8 - 36 29 - -
N.H. 19 50 463 440 4 5 62 93 8 6
Vt. 23 14 236 253 5 1 32 37 2 16
Mass. 533 870 4,377 4,022 65 40 1,352 1,315 26 33
R.I. 99 113 1,189 1,237 3 - 272 314 7 6
Conn. 768 637 3,724 3,889 21 - 1,833 2,105 - -
MID. ATLANTIC 11,041 11,284 35,732 39,879 57 19 21,212 25,243 219 179
Upstate N.Y. 1,754 1,382 N N 38 5 3,308 4,445 165 142
N.Y. City 5,750 6,277 18,451 21,125 8 - 8,224 9,552 - 3
N.J. 2,211 2,219 5,508 7,512 11 8 4,074 4,988 - -
Pa. 1,326 1,406 11,773 11,242 N 6 5,606 6,258 54 34
E.N. CENTRAL 2,441 3,208 35,704 52,640 228 123 22,646 34,851 325 324
Ohio 525 691 7,227 12,391 51 22 4,947 8,861 12 22
Ind. 396 430 5,500 5,810 40 10 3,632 3,754 10 7
Ill. 899 1,396 6,493 15,144 43 - 3,162 10,325 49 62
Mich. 460 521 11,224 12,785 94 70 8,633 8,961 254 233
Wis. 161 170 5,260 6,510 N 21 2,272 2,950 - -
W.N. CENTRAL 650 919 14,133 18,876 260 176 6,780 8,887 102 64
Minn. 128 169 U 3,128 132 119 U 1,381 3 1
Iowa 75 63 2,571 2,600 48 9 704 663 21 30
Mo. 275 462 6,939 7,905 29 36 4,573 5,203 65 15
N. Dak. 9 11 473 559 8 6 35 17 2 -
S. Dak. 4 8 781 775 15 - 84 108 - -
Nebr. 67 65 1,122 1,195 18 - 422 269 2 6
Kans. 92 141 2,247 2,714 10 6 962 1,246 9 12
S. ATLANTIC 8,425 9,677 55,117 30,460 118 78 52,912 57,332 183 107
Del. 159 189 1,276 1,148 3 3 720 875 - -
Md. 1,075 1,145 4,256 U 11 3 7,926 6,223 11 2
D.C. 598 644 N N 1 - 2,600 2,758 - -
Va. 719 646 7,023 6,535 N 18 4,795 5,800 18 8
W. Va. 62 73 1,798 1,294 N - 574 464 13 7
N.C. 503 539 11,342 U 37 22 11,062 11,263 38 30
S.C. 484 498 7,461 U 4 5 6,651 6,743 27 17
Ga. 1,064 1,413 7,666 7,137 28 - 8,445 12,366 U -
Fla. 3,761 4,530 14,295 14,346 33 27 10,139 10,840 76 43
E.S. CENTRAL 1,193 1,306 20,183 18,524 62 26 20,011 19,619 226 390
Ky. 211 209 3,993 4,161 21 - 2,508 2,518 10 24
Tenn. 501 497 7,803 8,001 31 26 6,557 6,928 156 296
Ala. 285 364 4,888 5,133 7 - 6,940 8,179 6 3
Miss. 196 236 3,499 1,229 3 - 4,006 1,994 54 67
W.S. CENTRAL 3,615 3,953 34,760 33,665 38 5 21,774 23,186 272 217
Ark. 131 169 780 1,064 6 1 1,662 2,524 - 4
La. 622 927 5,671 4,264 4 3 5,301 4,568 131 129
Okla. 188 166 4,542 4,692 2 1 2,868 2,906 6 1
Tex. 2,674 2,691 23,767 23,645 26 - 11,943 13,188 135 83
MOUNTAIN 1,022 1,189 14,175 15,419 136 78 4,414 4,841 249 379
Mont. 26 22 644 768 14 - 27 17 14 11
Idaho 34 25 890 944 15 8 68 67 34 88
Wyo. 13 3 345 389 7 - 35 22 104 120
Colo. 250 333 1,896 1,290 54 39 1,249 1,090 26 35
N. Mex. 104 111 2,081 2,493 5 4 706 511 33 47
Ariz. 255 342 5,864 6,803 N 21 1,750 2,343 23 44
Utah 82 114 954 919 33 - 140 183 3 17
Nev. 258 239 1,501 1,813 8 6 439 608 12 17
PACIFIC 4,867 6,840 36,465 41,043 179 118 7,956 13,384 296 450
Wash. 421 445 5,534 6,092 45 22 1,165 1,319 19 36
Oreg. 188 311 2,971 - 50 58 461 - 2 -
Calif. 4,187 5,946 26,147 33,191 76 31 5,819 11,504 177 285
Alaska 36 16 864 692 8 1 235 266 - 2
Hawaii 35 122 949 1,068 N 6 276 295 98 127
Guam 2 4 31 248 N - 3 42 - 6
P.R. 1,199 1,337 U U 28 U 392 389 74 113
V.I. 71 16 N N N U - - - -
Amer. Samoa - - - - N U - - - -
C.N.M.I. 1 - N N N U 17 11 2 -
------------------------------------------------------------------------------------------------------------------------------
N: Not notifiable U: Unavailable -: no reported cases C.N.M.I.: Commonwealth of North Mariana Islands
* Updated monthly to the Division of HIV/AIDS Prevention, National Center for HIV, STD, and TB Prevention, last update July 29, 1997.
** National Electronic Telecommunications System for Surveillance.
*** Public Health Laboratory Information System.
=======================================================================================================================================================
TABLE II. (page 2) Provisional cases of selected notifiable diseases, United States, weeks ending
August 9, 1997, and August 10, 1996 (32nd Week)
Lyme Syphilis Rabies,
Legionellosis Disease Malaria (Primary & Secondary) Tuberculosis Animal
---------------- ---------------- ---------------- --------------------- ----------------- -------
Cum. Cum. Cum. Cum. Cum. Cum. Cum. Cum. Cum. Cum. Cum.
Reporting Area 1997 1996 1997 1996 1997 1996 1997 1996 1997 1996 1997
-------------------------------------------------------------------------------------------------------------------------------------------
UNITED STATES 508 515 3,462 6,938 924 868 4,828 7,401 10,341 11,372 4,549
NEW ENGLAND 38 27 769 1,936 41 33 96 108 264 253 682
Maine 2 1 8 14 1 6 - - 11 16 130
N.H. 4 1 9 28 1 1 - 1 10 8 25
Vt. 7 4 6 10 2 2 - - 4 1 90
Mass. 9 14 129 81 18 11 45 50 151 112 142
R.I. 5 7 195 202 5 5 2 1 19 24 15
Conn. 11 N 422 1,601 14 8 49 56 69 92 280
MID. ATLANTIC 90 114 2,042 4,144 231 267 229 316 1,915 2,053 931
Upstate N.Y. 24 36 637 1,994 42 53 21 49 241 243 693
N.Y. City 3 8 27 216 122 151 53 95 986 1,083 U
N.J. 12 9 670 902 49 47 88 108 394 442 102
Pa. 51 61 708 1,032 18 16 67 64 294 285 136
E.N. CENTRAL 156 170 49 280 82 109 404 1,143 1,017 1,216 95
Ohio 78 54 32 13 12 9 119 436 180 174 65
Ind. 27 36 15 14 8 9 90 146 90 111 8
Ill. 5 23 2 8 29 56 39 314 517 665 7
Mich. 39 30 - 6 25 22 93 122 157 204 13
Wis. 7 27 U 239 8 13 63 125 73 62 2
W.N. CENTRAL 44 25 48 93 31 24 93 227 327 302 296
Minn. 1 3 32 18 10 7 U 26 86 70 29
Iowa 12 4 5 13 10 2 6 15 38 43 107
Mo. 11 5 7 34 6 8 61 162 132 126 15
N. Dak. 2 - - - 2 1 - - 8 3 44
S. Dak. 2 2 1 - - - - - 7 14 40
Nebr. 12 9 2 2 1 2 5 8 14 13 1
Kans. 4 2 1 26 2 4 21 16 42 33 60
S. ATLANTIC 72 71 349 322 196 144 2,001 2,363 1,973 2,071 1,863
Del. 6 9 27 122 2 3 16 23 11 28 43
Md. 17 13 245 113 57 39 524 412 192 181 339
D.C. 3 6 7 1 10 7 77 90 59 82 4
Va. 14 13 24 24 43 24 152 279 194 178 374
W. Va. N N 3 9 - 3 3 2 37 40 58
N.C. 9 6 21 43 10 15 453 643 251 297 556
S.C. 3 4 1 3 10 9 237 254 199 208 103
Ga. - 3 1 1 21 16 342 421 370 387 200
Fla. 20 17 20 6 43 28 197 239 660 670 186
E.S. CENTRAL 32 29 45 49 20 22 1,098 1,612 760 867 199
Ky. 4 2 6 15 4 6 91 83 112 148 21
Tenn. 22 14 24 16 6 9 485 530 245 299 123
Ala. 2 3 4 5 7 3 277 355 251 269 55
Miss. 4 10 11 13 3 4 245 644 152 151 -
W.S. CENTRAL 13 16 48 70 10 22 683 1,163 1,433 1,378 223
Ark. - 1 11 19 2 - 68 165 124 118 27
La. 2 1 2 1 8 2 230 334 136 9 2
Okla. 3 4 9 5 - - 73 123 109 110 70
Tex. 8 10 26 45 - 20 312 541 1,064 1,141 124
MOUNTAIN 32 31 12 4 50 35 96 94 299 385 92
Mont. 1 1 - - 2 5 - - 7 14 26
Idaho 2 - 2 - - - - 2 8 6 -
Wyo. 1 3 2 3 2 3 - 2 2 4 20
Colo. 8 7 4 - 24 16 7 24 57 51 -
N. Mex. 2 1 1 - 7 1 8 4 16 56 9
Ariz. 8 12 1 - 7 4 70 49 150 150 34
Utah 6 2 - 1 3 4 4 2 13 34 -
Nev. 4 5 2 - 5 2 7 11 46 70 3
PACIFIC 31 32 100 40 263 212 128 375 2,353 2,847 168
Wash. 6 3 5 5 13 12 7 7 190 162 -
Oreg. - - 11 - 15 - 5 - 103 - 7
Calif. 24 27 84 34 230 191 114 366 1,900 2,523 142
Alaska - 1 - - 3 3 1 - 52 50 19
Hawaii 1 1 - 1 2 6 1 2 108 112 -
Guam - 1 - - - - - 3 5 55 -
P.R. - - - - 4 1 154 147 129 105 41
V.I. - - - - - - - - - - -
Amer. Samoa - - - - - - - - - - -
C.N.M.I. - - - - - - 9 1 2 - -
-------------------------------------------------------------------------------------------------------------------------------------------
N: Not notifiable U: Unavailable -: no reported cases
=======================================================================================================================================================
Return to top. Table_III Note: To print large tables and graphs users may have to change their printer settings to landscape and use a small font size.
TABLE III. (page 1) Provisional cases of selected notifiable diseases preventable by vaccination, United
States, weeks ending August 9, 1997, and August 10, 1996 (32nd Week)
Hepatitis (Viral), by type Measles (Rubeola)
H. influenzae, --------------------------------------- ------------------------------------------------------------
invasive A B Indigenous Imported** Total
---------------- ----------------- ----------------- --------------- --------------- ---------------
Cum. Cum. Cum. Cum. Cum. Cum. Cum. Cum. Cum. Cum.
Reporting Area 1997* 1996 1997 1996 1997 1996 1997 1997 1997 1997 1997 1996
-----------------------------------------------------------------------------------------------------------------------------------------------------
UNITED STATES 687 692 16,573 16,101 5,254 5,785 1 57 1 40 97 393
NEW ENGLAND 37 24 398 202 94 135 - 10 - 6 16 13
Maine 3 - 45 13 6 2 - - - 1 1 -
N.H. 5 10 21 9 7 8 - 1 - - 1 -
Vt. 3 1 8 4 5 10 - - - - - 2
Mass. 22 12 151 103 37 45 - 9 - 4 13 10
R.I. 2 1 95 9 11 7 - - - - - -
Conn. 2 - 78 64 28 63 - - - 1 1 1
MID. ATLANTIC 78 149 1,216 1,132 782 918 1 14 1 7 21 33
Upstate N.Y. 14 37 179 260 168 219 - 2 - 3 5 7
N.Y. City 22 40 451 352 267 333 - 5 - 2 7 11
N.J. 32 38 193 230 155 180 - 1 - - 1 3
Pa. 10 34 393 290 192 186 1 6 1 2 8 12
E.N. CENTRAL 112 122 1,569 1,528 533 679 - 5 - 3 8 16
Ohio 66 70 218 536 55 85 - - - - - 2
Ind. 11 7 190 191 64 92 - - - - - -
Ill. 24 32 338 395 124 203 - 5 - 1 6 3
Mich. 10 8 730 271 266 240 - - - 2 2 2
Wis. 1 5 93 135 24 59 - - - - - 9
W.N. CENTRAL 37 30 1,271 1,333 310 296 - 9 - 3 12 18
Minn. 25 18 111 76 23 35 - - - 3 3 16
Iowa 5 3 235 227 33 40 - - - - - -
Mo. 3 6 651 682 218 176 - 1 - - 1 1
N. Dak. - - 10 28 3 - - - - - - -
S. Dak. 2 1 17 39 1 2 - 8 - - 8 -
Nebr. 1 1 61 97 10 21 - - - - - -
Kans. 1 1 186 184 22 22 - - - - - 1
S. ATLANTIC 122 129 1,068 683 777 789 - 3 - 8 11 8
Del. - 2 22 9 4 6 - - - - - 1
Md. 46 44 161 122 110 106 - - - 2 2 1
D.C. 2 5 16 20 25 26 - - - 1 1 -
Va. 9 6 137 98 79 90 - - - 1 1 2
W. Va. 3 6 6 12 9 14 - - - - - -
N.C. 17 20 121 87 161 227 - 1 - 1 2 2
S.C. 3 4 71 37 62 49 - - - 1 1 -
Ga. 23 30 230 60 83 8 - - - 1 1 1
Fla. 19 12 304 238 244 263 - 2 - 1 3 1
E.S. CENTRAL 37 20 403 911 419 508 - - - - - -
Ky. 5 5 51 26 25 47 - - - - - -
Tenn. 24 8 253 608 280 286 - - - - - -
Ala. 8 6 59 124 41 40 - - - - - -
Miss. - 1 40 153 73 135 - - - - - -
W.S. CENTRAL 33 30 3,530 3,236 701 689 - 3 - 4 7 22
Ark. 1 - 160 294 41 52 - - - - - -
La. 7 3 139 106 94 75 - - - - - -
Okla. 22 23 993 1,385 24 24 - - - - - -
Tex. 3 4 2,238 1,451 542 538 - 3 - 4 7 22
MOUNTAIN 73 38 2,729 2,722 579 711 - 7 - 1 8 149
Mont. - - 57 80 6 7 - - - - - -
Idaho 1 1 85 148 17 67 - - - - - 1
Wyo. 2 - 21 25 24 30 - - - - - -
Colo. 10 11 277 275 111 80 - - - - - 7
N. Mex. 8 9 214 273 187 245 - - - - - 10
Ariz. 28 12 1,398 1,061 130 166 - 5 - - 5 8
Utah 3 5 404 608 65 64 - 1 - - 1 118
Nev. 21 - 273 252 39 52 - 1 - 1 2 5
PACIFIC 158 150 4,389 4,354 1,059 1,060 - 6 - 8 14 134
Wash. 3 2 328 320 48 59 - 1 - - 1 38
Oreg. 26 - 240 - 64 - - - - - - -
Calif. 119 142 3,717 3,948 925 987 - 3 - 7 10 31
Alaska 3 4 24 32 14 6 - - - - - 63
Hawaii 7 2 80 54 8 8 - 2 - 1 3 2
Guam - - - 6 1 - U - U - - -
P.R. - 1 201 132 914 636 - - - - - 2
V.I. - - - 26 - 25 U - U - - -
Amer. Samoa - - - - - - U - U - - -
C.N.M.I. 6 10 1 1 34 5 U 1 U - 1 -
-----------------------------------------------------------------------------------------------------------------------------------------------------
N: Not notifiable U: Unavailable -: no reported cases
* Of 149 cases among children aged <5 years, serotype was reported for 79 and of those, 31 were type b.
** For imported measles, cases include only those resulting from importation from other countries.
=======================================================================================================================================================
TABLE III. (page 2) Provisional cases of selected notifiable diseases preventable by vaccination, United
States, weeks ending August 9, 1997, and August 10, 1996 (32nd Week)
Meningococcal
Disease Mumps Pertussis Rubella
----------------- -------------------------- --------------------------- ---------------------------
Cum. Cum. Cum. Cum. Cum. Cum. Cum. Cum.
Reporting Area 1997 1996 1997 1997 1996 1997 1997 1996 1997 1997 1996
------------------------------------------------------------------------------------------------------------------------------------------
UNITED STATES 2,198 2,078 6 365 441 54 2,960 2,598 - 121 202
NEW ENGLAND 139 94 - 8 1 2 572 589 - - 24
Maine 15 10 - - - - 6 21 - - -
N.H. 13 3 - - - - 66 40 - - -
Vt. 3 3 - - - - 181 16 - - 2
Mass. 70 36 - 2 1 2 295 507 - - 20
R.I. 12 10 - 5 - - 12 - - - -
Conn. 26 32 - 1 - - 12 5 - - 2
MID. ATLANTIC 203 235 - 35 56 4 201 172 - 24 10
Upstate N.Y. 50 60 - 7 17 - 59 85 - 1 4
N.Y. City 37 35 - 3 13 1 52 22 - 23 4
N.J. 44 52 - - 2 - 5 11 - - 2
Pa. 72 88 - 25 24 3 85 54 - - -
E.N. CENTRAL 310 314 - 40 93 3 233 325 - 4 3
Ohio 121 116 - 18 32 3 95 110 - - -
Ind. 34 45 - 6 5 - 35 19 - - -
Ill. 93 87 - 7 18 - 37 69 - 1 1
Mich. 37 31 - 9 37 - 31 27 - - 2
Wis. 25 35 - - 1 - 35 100 - 3 -
W.N. CENTRAL 162 173 - 13 11 10 190 125 - - -
Minn. 24 23 - 5 3 10 130 89 - - -
Iowa 38 37 - 6 1 - 19 3 - - -
Mo. 74 64 - - 4 - 27 18 - - -
N. Dak. 1 3 - - 2 - 2 1 - - -
S. Dak. 4 9 - - - - 3 3 - - -
Nebr. 6 16 - 2 - - 4 5 - - -
Kans. 15 21 - - 1 - 5 6 - - -
S. ATLANTIC 393 337 1 51 69 8 299 267 - 62 89
Del. 5 2 - - - - - 17 - - -
Md. 36 39 - 4 24 5 92 103 - - -
D.C. 1 5 - - - - 3 - - - 1
Va. 37 35 1 9 10 - 34 27 - 1 2
W. Va. 14 13 - - - - 5 2 - - -
N.C. 74 58 - 7 14 - 80 47 - 50 75
S.C. 44 41 - 10 5 3 14 18 - 9 1
Ga. 75 100 - 5 2 - 9 13 - - -
Fla. 107 44 - 16 14 - 62 40 - 2 10
E.S. CENTRAL 172 154 - 18 18 1 67 164 - - 2
Ky. 37 20 - 3 - - 15 131 - - -
Tenn. 67 46 - 3 1 1 27 15 - - -
Ala. 52 50 - 6 3 - 16 11 - - 2
Miss. 16 38 - 6 14 - 9 7 - - N
W.S. CENTRAL 218 234 - 33 30 - 73 77 - 3 7
Ark. 25 27 - - 1 - 13 3 - - -
La. 45 45 - 11 11 - 13 6 - - 1
Okla. 24 23 - - - - 14 8 - - -
Tex. 124 139 - 22 18 - 33 60 - 3 6
MOUNTAIN 130 127 1 49 18 18 835 261 - 5 6
Mont. 8 6 - - - 1 16 13 - - -
Idaho 8 20 - 2 - 6 537 76 - 1 2
Wyo. 1 3 - 1 - - 6 2 - - -
Colo. 36 22 - 3 3 3 178 81 - - 2
N. Mex. 21 21 N N N 6 53 36 - - -
Ariz. 35 30 - 31 1 - 23 15 - 4 1
Utah 11 12 - 6 3 - 10 10 - - -
Nev. 10 13 1 6 11 2 12 28 - - 1
PACIFIC 471 410 4 118 145 8 490 618 - 23 61
Wash. 59 65 1 14 18 8 224 227 - 5 12
Oreg. 94 - N N N - 17 - - - -
Calif. 313 337 - 86 104 - 236 371 - 10 46
Alaska 1 5 - 2 2 - 2 1 - - -
Hawaii 4 3 3 16 21 - 11 19 - 8 3
Guam - 4 U 1 4 U - - U - -
P.R. 9 10 - 5 1 - - 2 - - -
V.I. - - U - 1 U - - U - -
Amer. Samoa - - U - - U - - U - -
C.N.M.I. - - U 4 - U - - U - -
------------------------------------------------------------------------------------------------------------------------------------------
N: Not notifiable U: Unavailable -: no reported cases
=======================================================================================================================================================
Return to top. Table_IV Note: To print large tables and graphs users may have to change their printer settings to landscape and use a small font size.
TABLE IV. Deaths in 122 U.S. cities,* week ending
August 9, 1997 (32nd Week)
===================================================================================================================================
All Causes, By Age (Years)
------------------------------------------------------------------------ P&I**
Reporting Area All Ages >=65 45-64 25-44 1-24 <1 Total
---------------------------------------------------------------------------------------------------------------
NEW ENGLAND 476 315 95 41 15 10 25
Boston, Mass. 162 96 32 19 11 4 9
Bridgeport, Conn. 14 13 - 1 - - -
Cambridge, Mass. 2 2 - - - - -
Fall River, Mass. 30 24 4 1 - 1 -
Hartford, Conn. 18 14 3 - 1 - -
Lowell, Mass. 25 20 4 1 - - 2
Lynn, Mass. 15 7 4 4 - - 2
New Bedford, Mass. 20 16 4 - - - -
New Haven, Conn. 30 19 5 3 - 3 1
Providence, R.I. 47 26 13 5 2 1 1
Somerville, Mass. 5 3 2 - - - -
Springfield, Mass. 35 26 8 1 - - 3
Waterbury, Conn. 23 14 7 2 - - 1
Worcester, Mass. 50 35 9 4 1 1 6
MID. ATLANTIC 2,082 1,387 406 208 46 32 87
Albany, N.Y. 34 23 7 3 - 1 -
Allentown, Pa. 19 15 3 1 - - -
Buffalo, N.Y. 58 45 10 1 - 2 1
Camden, N.J. 32 18 8 5 1 - -
Elizabeth, N.J. 27 15 7 2 1 2 -
Erie, Pa. 40 34 4 2 - - 1
Jersey City, N.J. 33 24 5 3 1 - 1
New York City, N.Y. 1,101 740 215 109 23 14 44
Newark, N.J. 75 28 21 17 6 - 2
Paterson, N.J. 18 9 4 2 3 - -
Philadelphia, Pa. 300 176 71 42 5 6 17
Pittsburgh, Pa.*** 42 30 6 3 - 3 3
Reading, Pa. 4 4 - - - - -
Rochester, N.Y. 137 95 26 10 4 2 6
Schenectady, N.Y. 24 21 3 - - - 1
Scranton, Pa. 25 20 5 - - - -
Syracuse, N.Y. 70 55 8 3 2 2 6
Trenton, N.J. 29 25 1 3 - - 5
Utica, N.Y. 14 10 2 2 - - -
Yonkers, N.Y. U U U U U U U
E.N. CENTRAL 2,088 1,415 431 160 49 32 124
Akron, Ohio 49 43 5 - - 1 -
Canton, Ohio 39 31 7 1 - - 6
Chicago, Ill. 431 253 117 41 15 4 30
Cincinnati, Ohio 129 80 25 14 7 3 14
Cleveland, Ohio 154 100 32 14 2 6 1
Columbus, Ohio 227 157 44 21 4 1 12
Dayton, Ohio 120 88 25 7 - - 11
Detroit, Mich. 181 110 40 22 4 5 5
Evansville, Ind. 45 37 7 - 1 - 1
Fort Wayne, Ind. 55 36 12 4 3 - 4
Gary, Ind. 12 3 2 3 4 - -
Grand Rapids, Mich. 57 43 10 2 1 1 1
Indianapolis, Ind. 185 128 38 13 4 2 15
Lansing, Mich. 38 28 8 2 - - 3
Milwaukee, Wis. 101 70 22 5 - 4 8
Peoria, Ill. 31 23 7 - - 1 3
Rockford, Ill. 55 43 7 3 2 - 3
South Bend, Ind. 34 29 5 - - - 2
Toledo, Ohio 90 63 14 7 2 4 5
Youngstown, Ohio 55 50 4 1 - - -
W.N. CENTRAL 624 443 113 35 11 16 15
Des Moines, Iowa U U U U U U U
Duluth, Minn. 25 22 3 - - - -
Kansas City, Kans. 27 15 11 - - 1 -
Kansas City, Mo. 78 51 10 7 4 2 1
Lincoln, Nebr. 36 26 4 3 1 2 1
Minneapolis, Minn. 166 114 38 8 2 2 7
Omaha, Nebr. 79 53 13 7 2 4 3
St. Louis, Mo. 101 78 16 5 1 1 -
St. Paul, Minn. 54 46 6 1 1 - 3
Wichita, Kans. 58 38 12 4 - 4 -
S. ATLANTIC 1,200 713 280 131 44 27 41
Atlanta, Ga. 143 88 35 10 8 2 3
Baltimore, Md. 197 107 51 28 6 4 12
Charlotte, N.C. 91 55 20 13 1 2 4
Jacksonville, Fla. 126 84 21 13 6 2 1
Miami, Fla. 109 56 25 19 5 2 -
Norfolk, Va. 46 28 9 2 2 5 2
Richmond, Va. 86 39 33 10 2 - 1
Savannah, Ga. 48 32 10 2 3 1 3
St. Petersburg, Fla. 60 41 12 4 1 2 3
Tampa, Fla. 164 104 37 18 2 3 10
Washington, D.C. 106 61 27 6 8 4 2
Wilmington, Del. 24 18 - 6 - - -
E.S. CENTRAL 798 546 140 67 26 17 58
Birmingham, Ala. 167 126 21 11 6 1 26
Chattanooga, Tenn. 82 54 14 9 4 1 7
Knoxville, Tenn. 121 90 18 6 4 3 8
Lexington, Ky. 46 31 8 4 - 3 8
Memphis, Tenn. 146 90 34 16 4 2 6
Mobile, Ala. 97 69 15 6 4 3 1
Montgomery, Ala. 21 14 5 1 1 - 2
Nashville, Tenn. 118 72 25 14 3 4 -
W.S. CENTRAL 1,451 895 298 140 62 56 74
Austin, Tex. 73 48 15 5 1 4 1
Baton Rouge, La. 36 25 6 4 - 1 4
Corpus Christi, Tex. 60 39 14 3 - 4 2
Dallas, Tex. 214 130 38 19 11 16 3
El Paso, Tex. 91 59 20 8 1 3 6
Ft. Worth, Tex. 83 51 17 8 5 2 10
Houston, Tex. 343 185 89 42 18 9 28
Little Rock, Ark. 84 54 17 8 3 2 3
New Orleans, La. 89 43 11 15 15 5 -
San Antonio, Tex. 195 135 34 17 2 7 14
Shreveport, La. 65 53 7 2 1 2 1
Tulsa, Okla. 118 73 30 9 5 1 2
MOUNTAIN 837 555 146 72 42 21 49
Albuquerque, N.M. 65 43 14 5 3 - -
Boise, Idaho 31 22 7 1 1 - 3
Colo. Springs, Colo. 46 31 8 2 4 1 3
Denver, Colo. 152 98 28 12 10 4 14
Las Vegas, Nev. 138 93 29 11 3 2 9
Ogden, Utah 30 23 3 4 - - 4
Phoenix, Ariz. 154 90 26 23 10 4 5
Pueblo, Colo. 32 19 6 2 3 2 1
Salt Lake City, Utah 88 63 9 6 5 5 7
Tucson, Ariz. 101 73 16 6 3 3 3
PACIFIC 2,075 1,440 378 143 70 44 133
Berkeley, Calif. 14 11 2 1 - - -
Fresno, Calif. 50 30 7 5 6 2 7
Glendale, Calif. 26 21 4 1 - - 3
Honolulu, Hawaii 75 53 12 7 - 3 7
Long Beach, Calif. 70 41 17 8 4 - 4
Los Angeles, Calif. 710 484 135 56 19 16 37
Pasadena, Calif. 34 28 3 2 1 - 4
Portland, Oreg. 200 129 45 14 12 - 8
Sacramento, Calif. 203 141 40 11 7 4 17
San Diego, Calif. 127 88 19 8 7 5 14
San Francisco, Calif. 90 58 19 7 1 5 6
San Jose, Calif. 172 126 33 6 4 3 14
Santa Cruz, Calif. 29 24 5 - - - 5
Seattle, Wash. 141 102 19 11 7 2 2
Spokane, Wash. 46 36 6 1 1 2 2
Tacoma, Wash. 88 68 12 5 1 2 3
TOTAL 11,631**** 7,709 2,287 997 365 255 606
---------------------------------------------------------------------------------------------------------------
U: Unavailable -: no reported cases
* Mortality data in this table are voluntarily reported from 122 cities in the United States, most of which have populations
of 100,000 or more. A death is reported by the place of its occurrence and by the week that the death certificate was
filed. Fetal deaths are not included.
** Pneumonia and influenza.
*** Because of changes in reporting methods in these 3 Pennsylvania cities, these numbers are partial counts for the current
week. Complete counts will be available in 4 to 6 weeks.
**** Total includes unknown ages.
===================================================================================================================================
Return to top. Disclaimer All MMWR HTML versions of articles are electronic conversions from ASCII text into HTML. This conversion may have resulted in character translation or format errors in the HTML version. Users should not rely on this HTML document, but are referred to the electronic PDF version and/or the original MMWR paper copy for the official text, figures, and tables. An original paper copy of this issue can be obtained from the Superintendent of Documents, U.S. Government Printing Office (GPO), Washington, DC 20402-9371; telephone: (202) 512-1800. Contact GPO for current prices. **Questions or messages regarding errors in formatting should be addressed to mmwrq@cdc.gov.Page converted: 09/19/98 |
|||||||||
This page last reviewed 5/2/01
|