 |
|
|
|
|
|
|
| ||||||||||
|
|
|
|
|
|
|
||||
| ||||||||||
|
|
|
|
|
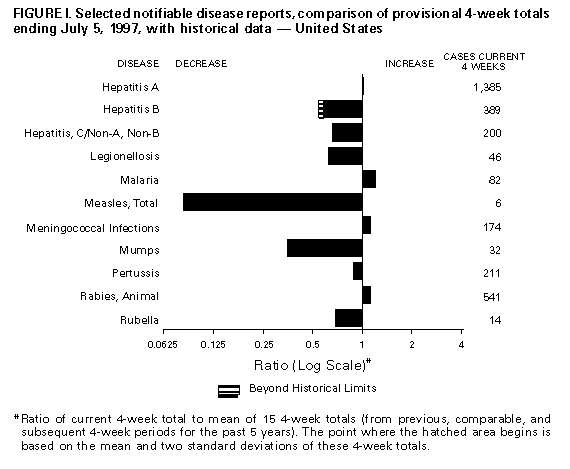
Persons using assistive technology might not be able to fully access information in this file. For assistance, please send e-mail to: mmwrq@cdc.gov. Type 508 Accommodation and the title of the report in the subject line of e-mail. Notifiable Diseases/Deaths in Selected Cities Weekly InformationFigure_I Selected notifiable disease reports, comparison of provisional 4-week totals ending July 5, 1997, with historical data -- United States Table_I Summary -- provisional cases of selected notifiable diseases, United States, cumulative, week ending July 5, 1997 (27th Week) Table_II Provisional cases of selected notifiable diseases, United States, weeks ending July 5, 1997 and July 6, 1996 (27th Week) Table_III Provisional cases of selected notifiable diseases preventable by vaccination, United States, weeks ending July 5, 1997 and July 6, 1996 (27th Week) Table_IV Deaths in 122 U.S. cities, week ending
July 5, 1997 (27th Week)
TABLE I. Summary -- provisional cases of specified notifiable diseases, United
States, cumulative, week ending July 5, 1997 (27th Week)
==================================================================================
                                             Cum. 1997
------------------------------------------------------
Anthrax                                              -
Brucellosis                                         28
Cholera                                              3
Congenital rubella syndrome                          2
Cryptosporidiosis*                                 605
Diphtheria                                           5
Encephalitis:  California*                           4
               eastern equine*                       -
               St. Louis*                            1
               western equine*                       1
Hansen Disease                                      53
Hantavirus pulmonary syndrome*+                      6
Hemolytic uremic syndrome, post-diarrheal*          21
HIV infection, pediatric*&                         131
Plague                                               2
Poliomyelitis, paralytic                             -
Psittacosis                                         21
Rabies, human                                        2
Rocky Mountain spotted fever (RMSF)                121
Streptococcal disease, invasive Group A            867
Streptococcal toxic-shock syndrome*                 21
Syphilis, congenital@                              125
Tetanus                                             21
Toxic-shock syndrome                                60
Trichinosis                                          3
Typhoid fever                                      136
Yellow fever                                         -
------------------------------------------------------
-: no reported cases
 * Not notifiable in all states
 + Updated weekly from reports to the Division of Viral and Rickettsial
   Diseases, National Center for Infectious Diseases (NCID).
 & Updated monthly to the Division of HIV/AIDS Prevention, National Center
   for HIV, STD, and TB Prevention (NCHSTP), last update June 24, 1997.
 @ Updated quarterly from reports to the Division of STD Prevention,
   NCHSTP.

==================================================================================
Return to top. Table_II Note: To print large tables and graphs users may have to change their printer settings to landscape and use a small font size.
TABLE II. (page 1) Provisional cases of selected notifiable diseases, United States, weeks ending
July 5, 1997, and July 6, 1996 (27th Week)
Escherichia
coli O157:H7
------------------- Hepatitis
AIDS* Chlamydia NETSS** PHLIS*** Gonorrhea C\NA,NB
----------------- -------------------- -------- -------- ------------------- ----------------
Cum. Cum. Cum. Cum. Cum. Cum. Cum. Cum. Cum. Cum.
Reporting Area 1997 1996 1997 1996 1997 1997 1997 1996 1997 1996
------------------------------------------------------------------------------------------------------------------------------
UNITED STATES 30,463 34,082 208,706 206,400 661 327 130,054 152,114 1,558 1,845
NEW ENGLAND 1,277 1,384 8,369 8,342 60 27 2,803 3,205 31 50
Maine 28 22 485 U 6 - 29 22 - -
N.H. 17 42 383 371 4 3 58 72 6 4
Vt. 23 10 201 231 3 1 25 30 - 15
Mass. 467 648 3,637 3,349 38 23 1,135 1,080 21 28
R.I. 85 94 1,021 1,042 1 - 234 267 4 3
Conn. 657 568 2,642 3,349 8 - 1,322 1,734 - -
MID. ATLANTIC 9,745 9,439 29,047 34,558 42 11 17,032 21,254 170 154
Upstate N.Y. 1,645 1,163 N N 27 4 2,741 3,711 132 122
N.Y. City 4,978 5,302 15,258 18,913 7 - 6,697 8,292 - 3
N.J. 1,973 1,786 4,448 6,729 8 5 3,147 4,184 - -
Pa. 1,149 1,188 9,341 8,916 N 2 4,447 5,067 38 29
E.N. CENTRAL 2,041 2,762 29,720 44,701 111 41 18,163 29,114 289 272
Ohio 396 618 6,345 10,514 31 15 4,140 7,372 8 10
Ind. 361 389 4,378 4,878 23 10 2,917 3,242 7 7
Ill. 765 1,203 5,643 12,659 27 - 2,757 8,438 32 53
Mich. 386 401 9,173 11,158 30 6 6,529 7,618 242 202
Wis. 133 151 4,181 5,492 N 10 1,820 2,444 - -
W.N. CENTRAL 565 811 11,609 16,079 99 64 5,434 7,429 90 50
Minn. 101 157 U 2,702 42 27 U 1,099 2 -
Iowa 70 57 2,351 1,980 16 8 643 504 18 24
Mo. 237 398 5,770 6,814 18 22 3,757 4,396 57 12
N. Dak. 7 9 417 508 3 3 28 14 2 -
S. Dak. 4 8 631 688 6 - 67 97 - -
Nebr. 61 55 489 1,056 9 - 126 220 2 5
Kans. 85 127 1,951 2,331 5 4 813 1,099 9 9
S. ATLANTIC 7,504 8,521 43,860 25,736 72 35 42,222 48,627 151 93
Del. 144 165 - 563 2 2 601 742 - -
Md. 950 1,022 3,711 U 6 3 6,713 5,018 10 1
D.C. 538 599 N N - - 1,535 2,275 - -
Va. 651 542 5,686 5,554 N 15 3,975 4,797 11 8
W. Va. 57 65 1,543 1,079 N - 469 367 9 7
N.C. 428 466 8,783 U 19 12 8,148 9,531 29 27
S.C. 410 439 6,150 U 1 - 5,586 5,696 26 15
Ga. 965 1,279 5,781 6,327 19 - 6,513 10,926 U -
Fla. 3,361 3,944 12,206 12,213 25 3 8,682 9,275 66 35
E.S. CENTRAL 1,022 1,132 16,908 15,487 48 7 16,849 16,367 184 341
Ky. 177 173 3,492 3,525 15 - 2,186 2,097 8 20
Tenn. 418 444 6,292 6,684 24 7 5,245 5,738 120 265
Ala. 237 323 4,133 4,337 6 - 5,860 6,752 6 2
Miss. 190 192 2,991 941 3 - 3,558 1,780 50 54
W.S. CENTRAL 3,187 3,297 28,107 10,906 28 5 17,442 10,223 194 168
Ark. 120 144 648 901 4 1 1,333 2,128 - 4
La. 545 777 4,142 3,630 4 3 3,865 3,839 117 101
Okla. 166 139 3,744 3,942 2 1 2,377 2,428 4 1
Tex. 2,356 2,237 19,573 2,433 18 - 9,867 1,828 73 62
MOUNTAIN 881 971 12,271 12,972 81 45 3,761 3,988 201 327
Mont. 22 14 477 636 5 - 20 13 12 10
Idaho 28 23 754 794 12 8 57 55 24 84
Wyo. 13 3 284 335 4 - 26 14 80 100
Colo. 210 298 1,896 989 30 16 1,058 916 24 30
N. Mex. 79 56 1,844 2,150 5 4 640 438 33 40
Ariz. 227 281 4,806 5,782 N 13 1,442 1,945 21 37
Utah 68 102 847 799 22 - 124 156 3 12
Nev. 234 194 1,363 1,487 3 4 394 451 4 14
PACIFIC 4,241 5,765 28,815 37,619 120 89 6,348 11,907 248 390
Wash. 380 380 4,711 5,136 23 22 986 1,116 16 34
Oreg. 162 266 1,991 2,856 37 40 309 438 4 6
Calif. 3,643 5,016 20,564 28,165 57 24 4,606 9,867 150 237
Alaska 22 14 731 538 3 - 211 228 - 2
Hawaii 34 89 818 924 N 3 236 258 78 111
Guam 2 4 31 220 N - 3 36 - 6
P.R. 1,021 1,047 U U 23 U 337 326 62 94
V.I. 52 14 N N N U - - - -
Amer. Samoa - - - - N U - - - -
C.N.M.I. 1 - N N N U 16 11 2 -
------------------------------------------------------------------------------------------------------------------------------
N: Not notifiable U: Unavailable -: no reported cases C.N.M.I.: Commonwealth of North Mariana Islands
* Updated monthly to the Division of HIV/AIDS Prevention, National Center for HIV, STD, and TB Prevention, last update June 24, 1997.
** National Electronic Telecommunications System for Surveillance.
*** Public Health Laboratory Information System.
=======================================================================================================================================================
TABLE II. (page 2) Provisional cases of selected notifiable diseases, United States, weeks ending
July 5, 1997, and July 6, 1996 (27th Week)
Lyme Syphilis Rabies,
Legionellosis Disease Malaria (Primary & Secondary) Tuberculosis Animal
---------------- ---------------- ---------------- --------------------- ----------------- -------
Cum. Cum. Cum. Cum. Cum. Cum. Cum. Cum. Cum. Cum. Cum.
Reporting Area 1997 1996 1997 1996 1997 1996 1997 1996 1997 1996 1997
-------------------------------------------------------------------------------------------------------------------------------------------
UNITED STATES 412 385 1,615 2,966 677 632 4,066 5,937 8,371 9,351 3,727
NEW ENGLAND 25 18 353 543 36 24 79 82 214 226 557
Maine 1 1 3 7 1 3 - - 11 16 113
N.H. 3 - 7 13 1 1 - 1 6 8 21
Vt. 4 2 3 4 2 2 - - 3 1 90
Mass. 7 9 59 32 14 7 38 39 127 98 117
R.I. 5 6 43 52 4 3 2 1 16 23 11
Conn. 5 N 238 435 14 8 39 41 51 80 205
MID. ATLANTIC 66 83 898 2,089 170 198 191 272 1,610 1,652 770
Upstate N.Y. 15 21 140 898 29 38 18 43 215 180 564
N.Y. City 2 4 16 115 91 109 40 88 841 852 -
N.J. 11 8 277 504 37 36 77 89 314 365 84
Pa. 38 50 465 572 13 15 56 52 240 255 122
E.N. CENTRAL 140 137 26 26 42 84 346 1,001 851 994 78
Ohio 75 47 20 12 9 7 107 376 156 155 59
Ind. 23 32 5 9 6 6 77 130 81 97 8
Ill. 3 17 1 5 5 42 34 272 414 540 2
Mich. 33 27 - - 19 17 72 109 143 156 8
Wis. 6 14 U U 3 12 56 114 57 46 1
W.N. CENTRAL 37 21 20 56 26 14 75 209 263 243 241
Minn. 1 1 15 3 9 3 U 25 68 62 23
Iowa 9 3 1 9 8 2 3 13 30 34 83
Mo. 10 5 2 24 4 7 50 149 106 89 12
N. Dak. 2 - - - 2 - - - 5 3 34
S. Dak. 2 2 - - - - - - 7 13 32
Nebr. 9 8 1 - 1 - 1 7 12 13 1
Kans. 4 2 1 20 2 2 21 15 35 29 56
S. ATLANTIC 62 52 187 140 150 95 1,705 2,003 1,680 1,754 1,579
Del. 6 4 16 62 2 2 15 19 11 27 33
Md. 14 7 135 32 45 28 480 340 154 152 288
D.C. 3 3 7 1 9 5 45 84 52 73 2
Va. 11 12 4 7 32 16 144 234 165 149 312
W. Va. N N 1 4 - 1 1 2 29 27 45
N.C. 6 5 8 27 7 10 364 550 196 247 495
S.C. 2 4 1 2 9 4 211 224 180 196 83
Ga. - 1 1 - 14 8 285 346 305 338 159
Fla. 20 15 14 5 32 21 160 204 588 545 162
E.S. CENTRAL 22 23 34 38 15 15 912 1,368 557 730 141
Ky. 2 2 4 13 3 3 80 70 97 120 19
Tenn. 14 9 15 12 4 6 386 444 154 254 81
Ala. 2 2 4 1 5 3 242 287 212 233 41
Miss. 4 10 11 12 3 3 204 567 94 123 -
W.S. CENTRAL 7 2 28 29 6 13 580 605 1,055 988 166
Ark. - - 4 15 2 - 60 143 107 102 25
La. 2 - 1 1 4 2 200 289 - 5 1
Okla. 2 2 11 3 - - 59 99 97 83 63
Tex. 3 - 12 10 - 11 261 74 851 798 77
MOUNTAIN 26 25 8 4 36 29 72 73 283 325 60
Mont. 1 1 - - 2 3 - - 7 14 14
Idaho 2 - 2 - - - - 1 7 4 -
Wyo. 1 3 2 3 2 2 - 2 2 3 18
Colo. 8 6 2 - 18 14 3 22 50 44 -
N. Mex. 1 1 - - 5 1 - 4 16 51 4
Ariz. 7 7 1 - 4 3 59 38 144 114 22
Utah 5 2 - 1 2 4 3 2 11 34 -
Nev. 1 5 1 - 3 2 7 4 46 61 2
PACIFIC 27 24 61 41 196 160 106 324 1,858 2,439 135
Wash. 6 2 2 3 8 9 7 6 99 133 -
Oreg. - - 9 10 10 11 4 4 82 92 2
Calif. 20 22 50 27 173 134 93 313 1,546 2,069 115
Alaska - - - - 3 2 1 - 46 46 18
Hawaii 1 - - 1 2 4 1 1 85 99 -
Guam - 1 - - - - - 3 5 55 -
P.R. - - - - 3 - 124 127 88 105 31
V.I. - - - - - - - - - - -
Amer. Samoa - - - - - - - - - - -
C.N.M.I. - - - - - - 5 1 - - -
-------------------------------------------------------------------------------------------------------------------------------------------
N: Not notifiable U: Unavailable -: no reported cases
=======================================================================================================================================================
Return to top. Table_III Note: To print large tables and graphs users may have to change their printer settings to landscape and use a small font size.
TABLE III. (page 1) Provisional cases of selected notifiable diseases preventable by vaccination, United
States, weeks ending July 5, 1997, and July 6, 1996 (27th Week)
Hepatitis (Viral), by type Measles (Rubeola)
H. influenzae, --------------------------------------- ------------------------------------------------------------
invasive A B Indigenous Imported** Total
---------------- ----------------- ----------------- --------------- --------------- ---------------
Cum. Cum. Cum. Cum. Cum. Cum. Cum. Cum. Cum. Cum.
Reporting Area 1997* 1996 1997 1996 1997 1996 1997 1997 1997 1997 1997 1996
-----------------------------------------------------------------------------------------------------------------------------------------------------
UNITED STATES 602 620 13,729 13,877 4,308 4,802 - 50 - 21 71 286
NEW ENGLAND 34 16 306 160 76 101 - 9 - 1 10 11
Maine 3 - 41 12 7 2 - - - - - -
N.H. 4 9 18 7 5 8 - 1 - - 1 -
Vt. 3 - 7 3 2 8 - - - - - 1
Mass. 21 6 129 79 32 30 - 8 - - 8 9
R.I. 2 1 47 7 9 6 - - - - - -
Conn. 1 - 64 52 21 47 U - U 1 1 1
MID. ATLANTIC 69 130 1,003 934 596 777 - 12 - 4 16 25
Upstate N.Y. 12 33 147 208 117 180 - 2 - 3 5 4
N.Y. City 20 34 354 297 210 281 - 4 - 1 5 9
N.J. 27 35 176 210 127 159 - 1 - - 1 1
Pa. 10 28 326 219 142 157 - 5 - - 5 11
E.N. CENTRAL 98 107 1,403 1,261 460 566 - 5 - 3 8 16
Ohio 59 56 204 470 44 64 - - - - - 2
Ind. 8 7 159 161 49 77 - - - - - -
Ill. 22 32 299 318 111 171 - 5 - 1 6 3
Mich. 8 7 665 203 241 202 - - - 2 2 2
Wis. 1 5 76 109 15 52 - - - - - 9
W.N. CENTRAL 29 21 1,052 1,069 255 242 - 9 - 2 11 16
Minn. 19 10 90 50 23 19 - - - 2 2 14
Iowa 3 3 179 208 29 29 - - - - - -
Mo. 3 5 565 543 175 156 - 1 - - 1 1
N. Dak. - - 10 28 1 - - - - - - -
S. Dak. 2 1 14 39 - - U 8 U - 8 -
Nebr. 1 1 47 82 10 16 - - - - - -
Kans. 1 1 147 119 17 22 - - - - - 1
S. ATLANTIC 119 108 874 561 637 643 - 2 - 4 6 5
Del. - 1 12 6 3 4 - - - - - 1
Md. 47 37 141 103 95 82 - - - 1 1 -
D.C. 2 5 14 18 21 26 - - - 1 1 -
Va. 7 4 100 82 63 80 - - - - - 2
W. Va. 3 4 6 12 9 14 - - - - - -
N.C. 17 18 106 68 123 182 - - - 1 1 -
S.C. 4 3 66 30 60 43 - - - - - -
Ga. 20 27 190 41 57 7 - - - - - 1
Fla. 19 9 239 201 206 205 - 2 - 1 3 1
E.S. CENTRAL 34 18 339 799 361 411 - - - - - -
Ky. 4 5 44 16 22 40 - - - - - -
Tenn. 22 7 209 558 234 240 - - - - - -
Ala. 8 5 51 101 37 27 - - - - - -
Miss. - 1 35 124 68 104 U - U - - -
W.S. CENTRAL 31 27 2,855 2,586 540 524 - 3 - 1 4 5
Ark. 1 - 141 254 31 45 - - - - - -
La. 6 2 114 82 68 60 - - - - - -
Okla. 19 22 859 1,088 17 24 - - - - - -
Tex. 5 3 1,741 1,162 424 395 U 3 U 1 4 5
MOUNTAIN 61 33 2,125 2,255 475 587 - 5 - - 5 80
Mont. - - 52 67 5 6 - - - - - -
Idaho 1 1 77 136 15 62 - - - - - 1
Wyo. 1 - 20 20 20 22 - - - - - -
Colo. 9 7 241 208 93 64 - - - - - 6
N. Mex. 7 8 171 257 159 196 - - - - - 6
Ariz. 24 12 1,078 861 105 137 - 5 - - 5 8
Utah 3 5 352 504 55 60 - - - - - 54
Nev. 16 - 134 202 23 40 - - - - - 5
PACIFIC 127 160 3,772 4,252 908 951 - 5 - 6 11 128
Wash. 2 2 285 286 41 55 - - - - - 37
Oreg. 22 22 200 560 59 61 - - - - - 7
Calif. 97 130 3,194 3,329 787 824 - 2 - 6 8 19
Alaska 1 4 23 28 13 4 - - - - - 63
Hawaii 5 2 70 49 8 7 - 3 - - 3 2
Guam - - - 6 1 - U - U - - -
P.R. - 1 172 111 691 530 - - - - - 2
V.I. - - - 24 - 21 U - U - - -
Amer. Samoa - - - - - - U - U - - -
C.N.M.I. 5 10 1 1 21 5 U 1 U - 1 -
-----------------------------------------------------------------------------------------------------------------------------------------------------
N: Not notifiable U: Unavailable -: no reported cases
* Of 128 cases among children aged <5 years, serotype was reported for 65 and of those, 26 were type b.
** For imported measles, cases include only those resulting from importation from other countries.
=======================================================================================================================================================
TABLE III. (page 2) Provisional cases of selected notifiable diseases preventable by vaccination, United
States, weeks ending July 5, 1997, and July 6, 1996 (27th Week)
Meningococcal
Disease Mumps Pertussis Rubella
----------------- -------------------------- --------------------------- ---------------------------
Cum. Cum. Cum. Cum. Cum. Cum. Cum. Cum.
Reporting Area 1997 1996 1997 1997 1996 1997 1997 1996 1997 1997 1996
------------------------------------------------------------------------------------------------------------------------------------------
UNITED STATES 2,000 1,934 3 326 379 44 2,496 1,940 - 64 129
NEW ENGLAND 123 81 - 7 1 5 521 435 - - 24
Maine 12 9 - - - - 6 13 - - -
N.H. 13 3 - - - 1 60 19 - - -
Vt. 2 3 - - - 2 173 10 - - 2
Mass. 62 30 - 2 1 2 260 388 - - 20
R.I. 9 8 - 4 - - 12 - - - -
Conn. 25 28 U 1 - U 10 5 U - 2
MID. ATLANTIC 175 213 - 30 53 3 173 125 - 3 7
Upstate N.Y. 44 53 - 6 15 - 52 62 - 1 3
N.Y. City 31 31 - - 13 - 40 19 - 2 2
N.J. 40 46 - - 2 - 5 7 - - 2
Pa. 60 83 - 24 23 3 76 37 - - -
E.N. CENTRAL 284 278 2 34 85 3 188 257 - 4 3
Ohio 110 97 2 16 27 3 77 82 - - -
Ind. 32 37 - 4 5 - 29 15 - - -
Ill. 85 83 - 7 17 - 28 61 - 1 1
Mich. 34 29 - 7 35 - 31 22 - - 2
Wis. 23 32 - - 1 - 23 77 - 3 -
W.N. CENTRAL 149 148 - 12 5 3 146 71 - - -
Minn. 19 14 - 5 1 3 99 43 - - -
Iowa 33 32 - 6 - - 16 3 - - -
Mo. 75 61 - - 2 - 19 15 - - -
N. Dak. 1 2 - - 2 - 2 1 - - -
S. Dak. 4 7 U - - U 2 2 U - -
Nebr. 5 13 - 1 - - 3 2 - - -
Kans. 12 19 - - - - 5 5 - - -
S. ATLANTIC 362 293 - 46 54 7 248 186 - 33 22
Del. 5 2 - - - - - 13 - - -
Md. 35 35 - 4 18 1 79 64 - - -
D.C. 1 4 - - - - 2 - - - 1
Va. 33 35 - 6 5 - 25 20 - 1 2
W. Va. 14 12 - - - - 4 2 - - -
N.C. 64 49 - 7 11 - 68 34 - 22 8
S.C. 41 38 - 10 5 - 11 7 - 9 1
Ga. 69 81 - 4 2 - 7 9 - - -
Fla. 100 37 - 15 13 6 52 37 - 1 10
E.S. CENTRAL 149 136 - 16 15 1 54 149 - - 2
Ky. 35 19 - 3 - - 11 128 - - -
Tenn. 54 41 - 3 1 - 22 12 - - -
Ala. 44 40 - 6 3 1 13 4 - - 2
Miss. 16 36 U 4 11 U 8 5 U - N
W.S. CENTRAL 199 222 - 34 28 5 48 65 - 4 7
Ark. 25 26 - - 1 1 10 2 - - -
La. 37 41 - 11 10 - 11 4 - - 1
Okla. 23 20 - - - 4 10 5 - - -
Tex. 114 135 U 23 17 U 17 54 U 4 6
MOUNTAIN 116 116 - 43 16 7 721 184 - 5 6
Mont. 8 5 - - - - 9 7 - - -
Idaho 8 16 - 2 - 1 510 60 - 1 2
Wyo. 1 3 - 1 - 1 5 1 - - -
Colo. 32 19 - 3 3 1 141 41 - - 2
N. Mex. 18 20 N N N 1 32 32 - - -
Ariz. 32 29 - 29 1 3 18 12 - 4 1
Utah 11 11 - 6 2 - 4 6 - - -
Nev. 6 13 - 2 10 - 2 25 - - 1
PACIFIC 443 447 1 104 122 10 397 468 - 15 58
Wash. 54 57 - 12 17 10 192 191 - 3 12
Oreg. 91 77 - - - - 18 33 - - 1
Calif. 295 307 1 80 86 - 180 231 - 7 42
Alaska 1 4 - 2 2 - 1 1 - - -
Hawaii 2 2 - 10 17 - 6 12 - 5 3
Guam - 3 U 1 4 U - - U - -
P.R. 8 9 - 4 1 - - 2 - - -
V.I. - - U - 1 U - - U - -
Amer. Samoa - - U - - U - - U - -
C.N.M.I. - - U 4 - U - - U - -
------------------------------------------------------------------------------------------------------------------------------------------
N: Not notifiable U: Unavailable -: no reported cases
=======================================================================================================================================================
Return to top. Table_IV Note: To print large tables and graphs users may have to change their printer settings to landscape and use a small font size.
TABLE IV. Deaths in 122 U.S. cities,* week ending
July 5, 1997 (27th Week)
===================================================================================================================================
All Causes, By Age (Years)
------------------------------------------------------------------------ P&I**
Reporting Area All Ages >=65 45-64 25-44 1-24 <1 Total
---------------------------------------------------------------------------------------------------------------
NEW ENGLAND 465 324 84 35 15 7 34
Boston, Mass. 141 90 32 12 5 2 11
Bridgeport, Conn. 32 20 8 2 2 - 2
Cambridge, Mass. 18 15 3 - - - 2
Fall River, Mass. 29 23 3 3 - - -
Hartford, Conn. 41 27 4 6 1 3 1
Lowell, Mass. 13 9 3 1 - - 2
Lynn, Mass. 8 5 3 - - - 1
New Bedford, Mass. 13 12 1 - - - 1
New Haven, Conn. 20 10 5 3 1 1 1
Providence, R.I. 42 31 6 2 3 - 8
Somerville, Mass. 6 5 - 1 - - -
Springfield, Mass. 33 23 6 2 2 - -
Waterbury, Conn. 26 23 1 2 - - 1
Worcester, Mass. 43 31 9 1 1 1 4
MID. ATLANTIC 2,095 1,435 388 166 57 48 81
Albany, N.Y. 46 36 6 1 2 1 2
Allentown, Pa. 18 12 3 3 - - -
Buffalo, N.Y. 62 48 11 1 1 1 3
Camden, N.J. 25 15 6 1 - 3 1
Elizabeth, N.J. 14 11 3 - - - -
Erie, Pa. 35 29 3 1 - 2 1
Jersey City, N.J. 77 52 16 6 2 1 -
New York City, N.Y. 1,014 689 188 89 25 23 25
Newark, N.J. 61 25 22 9 4 - 4
Paterson, N.J. 13 11 1 - 1 - -
Philadelphia, Pa. 401 253 90 35 17 6 22
Pittsburgh, Pa.*** 46 37 7 1 - 1 5
Reading, Pa. 7 5 1 1 - - -
Rochester, N.Y. 101 79 16 3 1 2 6
Schenectady, N.Y. 21 16 3 2 - - 4
Scranton, Pa. 35 29 2 3 - 1 2
Syracuse, N.Y. 70 53 3 7 3 4 4
Trenton, N.J. 30 22 3 2 - 3 2
Utica, N.Y. 19 13 4 1 1 - -
Yonkers, N.Y. U U U U U U U
E.N. CENTRAL 1,882 1,239 369 162 64 48 97
Akron, Ohio 30 17 7 4 1 1 -
Canton, Ohio 31 24 5 - 1 1 3
Chicago, Ill. 461 274 106 46 22 13 22
Cincinnati, Ohio 74 54 16 4 - - 8
Cleveland, Ohio 96 52 27 8 4 5 -
Columbus, Ohio 157 105 31 13 4 4 9
Dayton, Ohio 94 68 13 11 2 - 7
Detroit, Mich. 172 109 37 19 4 3 4
Evansville, Ind. 29 24 4 1 - - 1
Fort Wayne, Ind. 74 47 14 8 3 2 1
Gary, Ind. 17 13 1 1 2 - 1
Grand Rapids, Mich. 51 39 4 3 4 1 1
Indianapolis, Ind. 161 90 43 14 7 7 12
Lansing, Mich. 32 24 6 1 - 1 3
Milwaukee, Wis. 122 94 17 7 2 2 7
Peoria, Ill. 30 18 5 2 3 2 3
Rockford, Ill. 38 26 6 3 1 2 2
South Bend, Ind. 60 46 4 7 1 2 6
Toledo, Ohio 96 71 16 6 2 1 4
Youngstown, Ohio 57 44 7 4 1 1 3
W.N. CENTRAL 678 472 121 47 12 17 45
Des Moines, Iowa 89 63 19 4 3 - 11
Duluth, Minn. 36 27 8 - 1 - 4
Kansas City, Kans. 13 7 4 1 - 1 -
Kansas City, Mo. 93 58 16 8 1 1 3
Lincoln, Nebr. 25 20 2 3 - - 2
Minneapolis, Minn. 154 113 19 14 2 6 10
Omaha, Nebr. 61 37 12 6 2 4 3
St. Louis, Mo. 96 69 16 7 - 4 5
St. Paul, Minn. 50 38 11 1 - - 5
Wichita, Kans. 61 40 14 3 3 1 2
S. ATLANTIC 1,144 714 253 124 35 18 46
Atlanta, Ga. 160 101 37 17 4 1 4
Baltimore, Md. 168 108 32 20 6 2 14
Charlotte, N.C. 59 41 10 5 1 2 4
Jacksonville, Fla. 112 70 26 9 7 - -
Miami, Fla. 99 59 18 20 1 1 -
Norfolk, Va. 47 33 8 3 1 2 1
Richmond, Va. 50 29 14 7 - - 2
Savannah, Ga. 59 32 16 5 2 4 2
St. Petersburg, Fla. 69 48 11 7 1 2 2
Tampa, Fla. 153 105 30 13 4 1 13
Washington, D.C. 147 79 40 17 8 3 4
Wilmington, Del. 21 9 11 1 - - -
E.S. CENTRAL 670 464 119 39 30 18 53
Birmingham, Ala. 177 131 27 9 6 4 12
Chattanooga, Tenn. 54 38 10 2 2 2 5
Knoxville, Tenn. 85 66 12 3 2 2 14
Lexington, Ky. 53 29 15 2 2 5 5
Memphis, Tenn. 141 93 24 12 10 2 13
Mobile, Ala. 45 30 7 4 2 2 -
Montgomery, Ala. 19 15 2 - 2 - 1
Nashville, Tenn. 96 62 22 7 4 1 3
W.S. CENTRAL 1,228 806 232 107 55 28 67
Austin, Tex. 43 29 7 3 3 1 1
Baton Rouge, La. 48 32 9 5 2 - -
Corpus Christi, Tex. 48 35 6 4 2 1 4
Dallas, Tex. 122 65 37 11 8 1 1
El Paso, Tex. 58 44 7 6 1 - 6
Ft. Worth, Tex. 93 64 18 4 4 3 3
Houston, Tex. 306 195 59 31 12 9 23
Little Rock, Ark. 63 43 9 6 2 3 4
New Orleans, La. 95 56 13 12 13 1 -
San Antonio, Tex. 139 98 25 9 5 2 9
Shreveport, La. 80 56 11 7 2 4 5
Tulsa, Okla. 133 89 31 9 1 3 11
MOUNTAIN 616 420 109 48 20 19 34
Albuquerque, N.M. 90 68 16 3 2 1 7
Boise, Idaho 33 28 5 - - - 3
Colo. Springs, Colo. 45 31 9 2 2 1 2
Denver, Colo. 92 50 19 8 7 8 6
Las Vegas, Nev. 112 70 25 12 2 3 8
Ogden, Utah 17 14 1 1 - 1 -
Phoenix, Ariz. 94 63 12 10 5 4 -
Pueblo, Colo. 20 17 2 1 - - -
Salt Lake City, Utah U U U U U U U
Tucson, Ariz. 113 79 20 11 2 1 8
PACIFIC 1,429 1,011 239 102 42 35 104
Berkeley, Calif. 7 6 - - - 1 1
Fresno, Calif. 70 48 14 1 4 3 3
Glendale, Calif. 37 32 4 - - 1 4
Honolulu, Hawaii 53 36 9 1 2 5 3
Long Beach, Calif. 63 46 9 3 4 1 9
Los Angeles, Calif. 460 332 71 39 11 7 21
Pasadena, Calif. 12 9 3 - - - 2
Portland, Oreg. 112 72 20 12 4 4 5
Sacramento, Calif. U U U U U U U
San Diego, Calif. 100 69 17 6 2 6 13
San Francisco, Calif. 125 84 25 13 2 1 11
San Jose, Calif. 170 117 30 14 7 2 14
Santa Cruz, Calif. 19 13 4 2 - - 4
Seattle, Wash. 99 69 16 8 5 1 3
Spokane, Wash. 52 41 7 1 1 2 5
Tacoma, Wash. 50 37 10 2 - 1 6
TOTAL 10,207**** 6,885 1,914 830 330 238 561
---------------------------------------------------------------------------------------------------------------
U: Unavailable -: no reported cases
* Mortality data in this table are voluntarily reported from 122 cities in the United States, most of which have populations
of 100,000 or more. A death is reported by the place of its occurrence and by the week that the death certificate was
filed. Fetal deaths are not included.
** Pneumonia and influenza.
*** Because of changes in reporting methods in these 3 Pennsylvania cities, these numbers are partial counts for the current
week. Complete counts will be available in 4 to 6 weeks.
**** Total includes unknown ages.
===================================================================================================================================
Return to top. Disclaimer All MMWR HTML versions of articles are electronic conversions from ASCII text into HTML. This conversion may have resulted in character translation or format errors in the HTML version. Users should not rely on this HTML document, but are referred to the electronic PDF version and/or the original MMWR paper copy for the official text, figures, and tables. An original paper copy of this issue can be obtained from the Superintendent of Documents, U.S. Government Printing Office (GPO), Washington, DC 20402-9371; telephone: (202) 512-1800. Contact GPO for current prices. **Questions or messages regarding errors in formatting should be addressed to mmwrq@cdc.gov.Page converted: 09/19/98 |
|||||||||
This page last reviewed 5/2/01
|