 |
|
|
|
|
|
|
| ||||||||||
|
|
|
|
|
|
|
||||
| ||||||||||
|
|
|
|
|
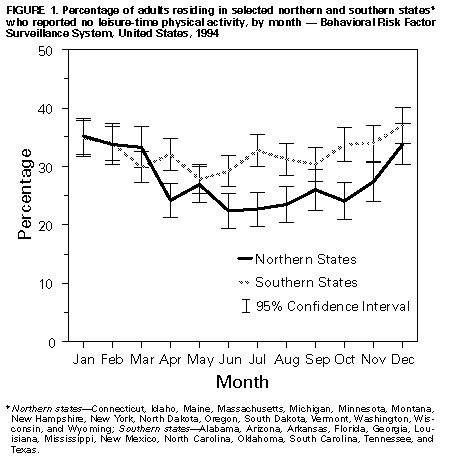
Persons using assistive technology might not be able to fully access information in this file. For assistance, please send e-mail to: mmwrq@cdc.gov. Type 508 Accommodation and the title of the report in the subject line of e-mail. Monthly Estimates of Leisure-Time Physical Inactivity -- United States, 1994Physical inactivity increases the risk for heart disease, diabetes, colon cancer, high blood pressure, obesity, osteoporosis, muscle and joint disorders, and symptoms of anxiety and depression (1). However, approximately one third of adults in the United States report no leisure-time physical activity, and rates of inactivity have been higher in January than in June (1). Among adults, the prevalence of leisure-time physical inactivity is highest among those who are older, Hispanic, and residing in southern states (1). A national health objective for the year 2000 is to reduce to less than or equal to 15% the proportion of persons reporting no leisure-time physical activity (objective 1.5) (2). To assist in monitoring efforts to achieve this objective, CDC analyzed data from the 1994 Behavioral Risk Factor Surveillance System (BRFSS) and estimated for each month the proportion of adults from selected demographic groups who reported no leisure-time physical activity. The findings indicate seasonal patterns in the prevalence of reported leisure-time physical inactivity; however, monthly rates of inactivity were higher and more stable among older persons, Hispanics, and residents of southern states. The BRFSS is a population-based, random-digit-dialed telephone survey of the civilian, noninstitutionalized U.S. population aged greater than or equal to 18 years, with samples drawn monthly. During 1994, a total of 105,853 respondents in 50 states and the District of Columbia were asked whether they participated in exercise, recreation, or physical activities other than their regular job duties (e.g., running, calisthenics, golf, gardening, or walking for exercise) during the past month. Respondents were classified as having no leisure-time physical activity if they reported no such participation. Data were weighted and aggregated, and composite estimates and standard errors were calculated using SESUDAAN. Prevalence estimates and 95% confidence intervals were calculated for each month by demographic group and by residence in selected northern or southern states * in the contiguous 48 states; northern states were those generally north of 41 degrees latitude, and southern states were those generally south of 37 degrees latitude. During 1994, an overall proportion of 29.4% of adults reported no leisure-time physical activity; prevalence rates were highest in January (35.3%) and lowest in June (24.7%) (Table_1). Seasonal patterns (high prevalences during winter months and low prevalences during summer months) were consistent for both sexes, among all age and racial/ethnic groups, and by region of residence. Monthly variations in prevalence were small for persons aged greater than or equal to 75 years (range: 5.1 percentage points when February is excluded; the range is 13.0 percentage points when February is included), and was less than or equal to 10 percentage points among Hispanics and residents in southern states. In addition, prevalences were higher among residents in southern states than among those in northern states during April-November; however, for May and September, confidence intervals for the prevalences overlapped (Figure_1). Reported by the following BRFSS coordinators: J Cook, MPA, Alabama; P Owen, Alaska; B Bender, Arizona; J Senner, PhD, Arkansas; B Davis, PhD, California; M Leff, MSPH, Colorado; M Adams, MPH, Connecticut; F Breukelman, Delaware; C Mitchell, District of Columbia; D McTague, MS, Florida; E Pledger, MPA, Georgia; J Cooper, MA, Hawaii; C Johnson, MPH, Idaho; B Steiner, MS, Illinois; N Costello, MPA, Indiana; A Wineski, Iowa; M Perry, Kansas; K Asher, Kentucky; R Meriweather, MD, Louisiana; D Maines, Maine; A Weinstein, MA, Maryland; D Brooks, MPH, Massachusetts; H McGee, MPH, Michigan; N Salem, PhD, Minnesota; P Arbuthnot, Mississippi; T Murayi, PhD, Missouri; P Smith, Montana; S Huffman, Nebraska; E DeJan, MPH, Nevada; K Zaso, MPH, New Hampshire; G Boeselager, MS, New Jersey; W Honey, MPH, New Mexico; T Melnik, DrPH, New York; K Passaro, PhD, North Carolina; J Kaske, MPH, North Dakota; R Indian, MS, Ohio; N Hann, MPH, Oklahoma; J Grant-Worley, MS, Oregon; L Mann, Pennsylvania; Y Gladman, South Carolina; M Gildemaster, South Dakota; D Ridings, Tennessee; K Condon, Texas; R Giles, Utah; R McIntyre, PhD, Vermont; L Redman, Virginia; K Wynkoop-Simmons, PhD, Washington; F King, West Virginia; E Cautley, MS, Wisconsin; M Futa, MA, Wyoming. Physical Activity and Health Br, Div of Nutrition and Physical Activity, National Center for Chronic Disease Prevention and Health Promotion, CDC. Editorial NoteEditorial Note: The findings in this report indicate that leisure-time physical inactivity was higher during winter months and lower during summer months for both sexes and among most age and racial/ethnic groups. Such differences are consistent with previous surveys in Canada and Scotland (3,4) and may reflect changes in temperature, amount of daylight, and annual precipitation. In addition, this report documents less monthly change in physical activity among older adults, Hispanics, and residents of southern states. Older adults may be socially isolated or have chronic diseases, and for some Hispanic adults, physical activity messages and promotional strategies may be constrained by barriers in communication. The difference between residents of southern states and residents of northern states probably reflects smaller declines in inactivity during spring and summer months resulting from differing demographic or environmental factors (e.g., higher temperatures and humidity). The findings in this report are subject to at least two limitations. First, because BRFSS data are cross-sectional, different persons report their activity patterns for each month of the year; longitudinal follow-up would provide more accurate and reliable measurements of the changes in this behavior over time. Second, the monthly results by demographic group and state of residence were not adjusted for potential confounding variables (e.g., social, demographic, and climatic factors). To achieve the national health objective for increasing leisure-time physical activity, comprehensive public health efforts are needed to reduce reported levels of leisure-time physical inactivity for all population groups for all months of the year. Examples of strategies and approaches to increase leisure-time physical activity include encouragement to climb stairs and to avoid the use of labor-saving devices (5); organization of health education classes for the elderly to stimulate interest and participation in physical activity (6); facilitation of indoor activities (e.g., walking in malls) during inclement weather, darker winter months, or hot, humid summer months (7); establishment at worksites of leisure-time physical-activity challenges for workers throughout the year (8); and the implementation of community-based physical-activity programs (9) to promote regular activity (e.g., brisk walking) in conjunction with other seasonal activities, such as gardening and outdoor sports during spring and summer, raking and bagging leaves during fall, and indoor dancing or outdoor ice skating during winter. Interventions also can be developed for and tailored to racial/ethnic and other high-risk groups (10). References
Disclaimer All MMWR HTML versions of articles are electronic conversions from ASCII text into HTML. This conversion may have resulted in character translation or format errors in the HTML version. Users should not rely on this HTML document, but are referred to the electronic PDF version and/or the original MMWR paper copy for the official text, figures, and tables. An original paper copy of this issue can be obtained from the Superintendent of Documents, U.S. Government Printing Office (GPO), Washington, DC 20402-9371; telephone: (202) 512-1800. Contact GPO for current prices. **Questions or messages regarding errors in formatting should be addressed to mmwrq@cdc.gov.Page converted: 09/19/98 |
|||||||||
This page last reviewed 5/2/01
|