 |
|
|
|
|
|
|
| ||||||||||
|
|
|
|
|
|
|
||||
| ||||||||||
|
|
|
|
|
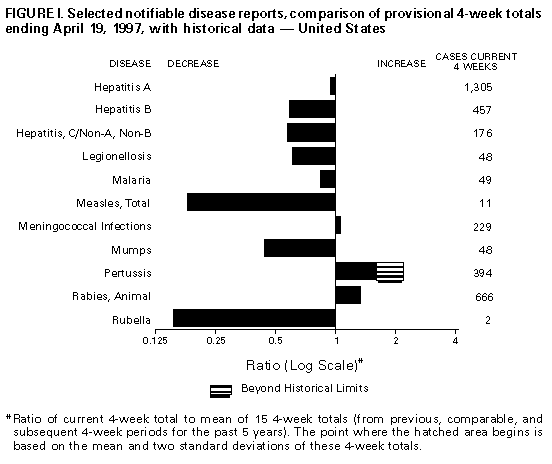
Persons using assistive technology might not be able to fully access information in this file. For assistance, please send e-mail to: mmwrq@cdc.gov. Type 508 Accommodation and the title of the report in the subject line of e-mail. Notifiable Diseases/Deaths in Selected Cities Weekly InformationFigure_I Selected notifiable disease reports, comparison of provisional 4-week totals ending April 19, 1997, with historical data -- United States Table_I Summary -- provisional cases of selected notifiable diseases, United States, cumulative, week ending April 19, 1997 (16th Week) Table_II Provisional cases of selected notifiable diseases, United States, weeks ending April 19, 1997 and April 20, 1996 (16th Week) Table_III Provisional cases of selected notifiable diseases preventable by vaccination, United States, weeks ending April 19, 1997 and April 20, 1996 (16th Week) Table_IV Deaths in 122 U.S. cities, week ending
April 19, 1997 (16th Week)
TABLE I. Summary -- provisional cases of specified notifiable diseases, United
States, cumulative, week ending April 19, 1997 (16th Week)
==================================================================================
                                             Cum. 1997
------------------------------------------------------
Anthrax                                              -
Brucellosis                                         12
Cholera                                              1
Congenital rubella syndrome                          2
Cryptosporidiosis*                                 324
Diphtheria                                           2
Encephalitis:  California*                           4
               eastern equine*                       -
               St. Louis*                            -
               western equine*                       -
Hansen Disease                                      35
Hantavirus pulmonary syndrome*+                      1
Hemolytic uremic syndrome, post-diarrheal*          12
HIV infection, pediatric*&                          53
Plague                                               -
Poliomyelitis, paralytic                             -
Psittacosis                                         14
Rabies, human                                        1
Rocky Mountain spotted fever (RMSF)                 30
Streptococcal disease, invasive Group A            394
Streptococcal toxic-shock syndrome*                  9
Syphilis, congenital@                               27
Tetanus                                             10
Toxic-shock syndrome                                30
Trichinosis                                          5
Typhoid fever                                       82
Yellow fever                                         -
------------------------------------------------------
-: no reported cases
 * Not notifiable in all states
 + Updated weekly from reports to the Division of Viral and Rickettsial
   Diseases, National Center for Infectious Diseases (NCID).
 & Updated monthly to the Division of HIV/AIDS Prevention, National Center
   for HIV, STD, and TB Prevention (NCHSTP), last update March 25, 1997.
 @ Updated quarterly from reports to the Division of STD Prevention,
   NCHSTP.

==================================================================================
Return to top. Table_II Note: To print large tables and graphs users may have to change their printer settings to landscape and use a small font size.
TABLE II. (page 1) Provisional cases of selected notifiable diseases, United States, weeks ending
April 19, 1997, and April 20, 1996 (16th Week)
Escherichia
coli O157:H7
------------------- Hepatitis
AIDS* Chlamydia NETSS** PHLIS*** Gonorrhea C\NA,NB
----------------- -------------------- -------- -------- ------------------- ----------------
Cum. Cum. Cum. Cum. Cum. Cum. Cum. Cum. Cum. Cum.
Reporting Area 1997 1996 1997 1996 1997 1997 1997 1996 1997 1996
------------------------------------------------------------------------------------------------------------------------------
UNITED STATES 15,582 19,904 104,549 118,706 283 128 69,555 89,681 848 908
NEW ENGLAND 465 841 4,670 5,760 23 10 1,533 2,373 13 24
Maine 18 10 288 - 1 - 14 13 - -
N.H. 4 25 163 212 - - 40 37 2 3
Vt. 10 8 120 155 2 1 15 19 - 10
Mass. 220 486 2,231 1,991 16 9 726 660 9 8
R.I. 43 38 653 657 1 - 164 173 2 3
Conn. 170 274 1,215 2,745 3 - 574 1,471 - -
MID. ATLANTIC 5,146 5,591 6,857 16,086 17 4 5,258 7,928 83 77
Upstate N.Y. 833 571 N N 9 3 1,557 33 64 67
N.Y. City 2,649 3,283 U 7,225 5 - U 3,955 - 1
N.J. 1,098 1,023 2,040 2,863 3 - 1,270 766 - -
Pa. 566 714 4,817 5,998 N 1 2,431 3,174 19 9
E.N. CENTRAL 1,088 1,538 18,308 28,008 51 18 11,357 18,216 173 159
Ohio 216 401 4,294 6,408 17 9 2,779 4,629 5 4
Ind. 286 264 2,541 2,790 11 2 1,748 2,015 4 4
Ill. 372 527 3,444 8,174 10 - 1,739 5,301 15 31
Mich. 158 254 5,843 7,192 13 2 4,086 4,766 149 120
Wis. 56 92 2,186 3,444 N 5 1,005 1,505 - -
W.N. CENTRAL 313 424 6,262 9,996 40 27 2,807 3,968 53 19
Minn. 55 84 U 1,369 23 17 U - - -
Iowa 52 31 1,501 1,107 9 4 379 312 20 7
Mo. 135 173 3,291 4,547 3 3 1,943 2,688 22 7
N. Dak. 4 1 81 317 3 2 5 9 2 -
S. Dak. 2 7 339 424 - - 38 65 - -
Nebr. 28 32 259 757 1 - 89 152 - 2
Kans. 37 96 791 1,475 1 1 353 742 9 3
S. ATLANTIC 3,895 5,141 23,744 16,894 42 7 24,532 31,427 72 56
Del. 51 113 - - 1 1 331 439 - -
Md. 425 645 2,054 1,825 2 1 3,897 4,121 5 -
D.C. 182 243 N N - - 1,319 1,339 - -
Va. 323 266 3,470 3,688 N 2 2,599 3,006 6 4
W. Va. 21 32 - - N - 206 99 3 4
N.C. 217 277 5,193 U 9 3 4,766 5,622 18 14
S.C. 213 276 3,535 U - - 3,106 3,526 14 11
Ga. 528 682 2,406 4,078 15 - 3,425 7,447 U -
Fla. 1,935 2,607 7,086 7,303 15 - 4,883 5,828 26 23
E.S. CENTRAL 473 723 9,709 8,824 25 7 9,887 9,473 115 159
Ky. 48 118 1,833 2,228 7 - 1,160 1,252 6 10
Tenn. 203 244 3,774 3,678 13 7 3,238 3,242 62 148
Ala. 127 235 2,293 2,750 2 - 3,189 4,240 5 1
Miss. 95 126 1,809 168 3 - 2,300 739 42 -
W.S. CENTRAL 1,459 2,030 11,126 7,245 3 1 7,797 6,913 77 87
Ark. 59 96 373 456 2 - 755 1,223 2 1
La. 219 494 2,002 2,076 1 1 1,928 2,428 55 33
Okla. 86 66 2,304 2,280 - - 1,491 1,434 4 26
Tex. 1,095 1,374 6,447 2,433 - - 3,623 1,828 16 27
MOUNTAIN 441 632 6,305 4,268 30 21 2,223 2,400 112 195
Mont. 12 8 276 410 2 - 14 10 4 8
Idaho 8 10 469 507 4 - 33 29 15 40
Wyo. 9 2 151 213 2 - 18 10 44 62
Colo. 114 177 100 7 13 8 507 563 18 19
N. Mex. 34 43 1,148 1,188 4 3 435 285 16 28
Ariz. 122 191 2,884 592 N 8 934 1,162 10 24
Utah 30 73 467 476 2 - 53 90 2 7
Nev. 112 128 810 875 3 2 229 251 3 7
PACIFIC 2,302 2,984 17,568 21,625 52 31 4,161 6,983 150 132
Wash. 176 217 2,836 2,846 8 4 645 727 8 24
Oreg. 97 188 970 1,621 13 10 146 143 3 3
Calif. 2,002 2,523 12,843 16,353 28 15 3,084 5,789 92 44
Alaska 12 3 427 239 3 - 148 163 - 2
Hawaii 15 53 492 566 N 2 138 161 47 59
Guam - 3 - 102 N - - 24 - 1
P.R. 420 418 N N 21 U 175 60 21 13
V.I. 17 6 N N N U - - - -
Amer. Samoa - - - - N U - - - -
C.N.M.I. - - N N N U 11 11 2 -
------------------------------------------------------------------------------------------------------------------------------
N: Not notifiable U: Unavailable -: no reported cases C.N.M.I.: Commonwealth of North Mariana Islands
* Updated monthly to the Division of HIV/AIDS Prevention, National Center for HIV, STD, and TB Prevention, last update March 25, 1997.
** National Electronic Telecommunications System for Surveillance.
*** Public Health Laboratory Information System.
=======================================================================================================================================================
TABLE II. (page 2) Provisional cases of selected notifiable diseases, United States, weeks ending
April 19, 1997, and April 20, 1996 (16th Week)
Lyme Syphilis Rabies,
Legionellosis Disease Malaria (Primary & Secondary) Tuberculosis Animal
---------------- ---------------- ---------------- --------------------- ----------------- -------
Cum. Cum. Cum. Cum. Cum. Cum. Cum. Cum. Cum. Cum. Cum.
Reporting Area 1997 1996 1997 1996 1997 1996 1997 1996 1997 1996 1997
-------------------------------------------------------------------------------------------------------------------------------------------
UNITED STATES 247 233 744 1,271 334 304 2,286 3,640 3,875 4,854 2,013
NEW ENGLAND 19 9 140 98 7 8 43 60 93 164 311
Maine 1 1 2 - - 2 - - - 7 72
N.H. 3 - 4 2 1 1 - 1 1 3 11
Vt. 3 - 2 - 1 1 - - - - 50
Mass. 7 3 37 10 4 3 22 24 52 44 62
R.I. 1 5 29 21 1 1 - - 7 18 4
Conn. 4 N 66 65 - - 21 35 33 92 112
MID. ATLANTIC 40 51 481 1,034 70 79 79 90 812 830 435
Upstate N.Y. 9 9 48 376 9 15 12 12 85 92 304
N.Y. City - 1 2 232 36 38 U 46 460 418 -
N.J. 5 7 114 94 17 21 39 - 176 176 42
Pa. 26 34 317 332 8 5 28 32 91 144 89
E.N. CENTRAL 95 89 14 7 26 37 220 597 459 563 20
Ohio 55 32 11 5 3 5 77 240 108 85 16
Ind. 10 21 3 2 3 2 49 80 40 49 2
Ill. - 12 - - 5 15 19 159 214 343 1
Mich. 28 16 - - 13 8 35 50 69 70 1
Wis. 2 8 U U 2 7 40 68 28 16 -
W.N. CENTRAL 20 13 10 27 9 4 41 167 125 137 125
Minn. - - 7 1 4 1 U 36 34 34 14
Iowa 3 1 1 3 2 1 3 6 15 15 50
Mo. 6 3 - 7 2 1 26 110 49 52 7
N. Dak. 1 - - - - - - - 2 1 16
S. Dak. 1 2 - - - - - - 2 9 17
Nebr. 5 6 2 - 1 - - 6 4 8 -
Kans. 4 1 - 16 - 1 12 9 19 18 21
S. ATLANTIC 37 26 63 62 87 53 955 1,221 794 675 912
Del. 3 1 - 20 2 2 8 12 7 14 12
Md. 14 5 45 28 24 15 208 189 78 77 165
D.C. 1 1 4 - 5 2 41 47 23 36 1
Va. 4 9 - - 18 7 101 144 86 43 188
W. Va. - 1 - 3 - - - 1 15 19 23
N.C. 5 3 2 6 5 7 239 325 109 100 294
S.C. 2 1 1 1 4 3 111 149 87 101 42
Ga. - - 1 - 11 7 165 259 133 163 88
Fla. 8 5 10 4 18 10 82 95 256 122 99
E.S. CENTRAL 7 17 18 19 7 8 565 896 292 400 86
Ky. - 3 1 6 1 3 51 48 57 72 9
Tenn. 3 7 4 6 2 3 235 296 57 123 57
Ala. 1 1 2 - 1 1 140 177 119 133 20
Miss. 3 6 11 7 3 1 139 375 59 72 -
W.S. CENTRAL - 1 4 5 4 10 273 392 92 539 48
Ark. - - - 4 1 - 25 86 59 43 15
La. - - 1 - 3 - 126 180 - - -
Okla. - 1 2 1 - - 36 52 33 54 33
Tex. - - 1 - - 10 86 74 - 442 -
MOUNTAIN 15 11 - - 21 19 46 43 125 174 13
Mont. 1 - - - 2 1 - - 2 - 2
Idaho 1 - - - - - - 1 4 3 -
Wyo. 1 1 - - 1 2 - 1 1 1 -
Colo. 3 5 - - 10 11 1 14 27 32 -
N. Mex. - - - - 2 1 - - 8 22 1
Ariz. 4 2 - - 3 1 38 24 51 79 9
Utah 4 - - - - 2 1 - 4 10 -
Nev. 1 3 - - 3 1 6 3 28 27 1
PACIFIC 14 16 14 19 103 86 64 174 1,083 1,372 63
Wash. 3 1 - - 3 5 5 1 62 79 -
Oreg. - - 7 5 7 7 3 3 43 54 1
Calif. 10 15 7 13 91 71 55 169 892 1,163 54
Alaska - - - - 2 - - - 31 24 8
Hawaii 1 - - 1 - 3 1 1 55 52 -
Guam - - - - - - - 2 - 35 -
P.R. - - - - 3 - 64 37 - 47 14
V.I. - - - - - - - - - - -
Amer. Samoa - - - - - - - - - - -
C.N.M.I. - - - - - - 3 1 - - -
-------------------------------------------------------------------------------------------------------------------------------------------
N: Not notifiable U: Unavailable -: no reported cases
=======================================================================================================================================================
Return to top. Table_III Note: To print large tables and graphs users may have to change their printer settings to landscape and use a small font size.
TABLE III. (page 1) Provisional cases of selected notifiable diseases preventable by vaccination, United
States, weeks ending April 19, 1997, and April 20, 1996 (16th Week)
Hepatitis (Viral), by type Measles (Rubeola)
H. influenzae, --------------------------------------- ------------------------------------------------------------
invasive A B Indigenous Imported** Total
---------------- ----------------- ----------------- --------------- --------------- ---------------
Cum. Cum. Cum. Cum. Cum. Cum. Cum. Cum. Cum. Cum.
Reporting Area 1997* 1996 1997 1996 1997 1996 1997 1997 1997 1997 1997 1996
-----------------------------------------------------------------------------------------------------------------------------------------------------
UNITED STATES 354 372 7,592 8,186 2,389 2,734 2 19 3 11 30 93
NEW ENGLAND 20 9 154 93 60 61 - - - - - 6
Maine 2 - 18 9 4 2 - - - - - -
N.H. 2 7 9 3 5 3 - - - - - -
Vt. - - 5 1 1 2 - - - - - 1
Mass. 14 2 66 45 33 13 - - - - - 4
R.I. 1 - 11 3 6 4 - - - - - -
Conn. 1 - 45 32 11 37 - - - - - 1
MID. ATLANTIC 40 58 521 609 325 465 - 6 - 3 9 5
Upstate N.Y. 2 5 51 108 60 91 - 1 - 3 4 2
N.Y. City 15 9 199 272 103 205 - 4 - - 4 3
N.J. 16 24 115 121 80 94 - - - - - -
Pa. 7 20 156 108 82 75 - 1 - - 1 -
E.N. CENTRAL 50 68 684 738 267 341 - 4 - 2 6 5
Ohio 28 40 145 302 32 39 - - - - - 2
Ind. 4 2 89 106 25 38 - - - - - -
Ill. 11 18 163 166 51 104 - 4 - 1 5 -
Mich. 6 3 246 101 156 129 - - - 1 1 -
Wis. 1 5 41 63 3 31 U - U - - 3
W.N. CENTRAL 15 14 573 636 183 136 - 4 1 1 5 6
Minn. 7 7 35 23 5 3 - - 1 1 1 5
Iowa 3 3 82 152 38 19 - - - - - -
Mo. 1 3 306 308 118 91 - 4 - - 4 1
N. Dak. - - 6 9 1 - - - - - - -
S. Dak. 2 1 6 29 - - - - - - - -
Nebr. 1 - 42 71 7 8 U - U - - -
Kans. 1 - 96 44 14 15 - - - - - -
S. ATLANTIC 91 74 470 287 333 422 1 1 1 1 2 2
Del. - 1 10 5 1 1 - - - - - 1
Md. 29 24 106 61 52 95 - - 1 1 1 -
D.C. 2 - 11 9 18 11 - - - - - -
Va. 5 3 54 47 35 46 - - - - - -
W. Va. 2 3 5 6 6 9 - - - - - -
N.C. 12 12 61 36 72 116 - - - - - -
S.C. 4 3 35 29 28 28 U - U - - -
Ga. 16 24 41 2 15 5 - - - - - -
Fla. 21 4 147 92 106 111 1 1 - - 1 1
E.S. CENTRAL 25 12 250 598 232 217 - - - - - -
Ky. 4 3 24 9 10 27 - - - - - -
Tenn. 15 4 158 439 142 173 - - - - - -
Ala. 6 4 37 78 26 17 - - - - - -
Miss. - 1 31 72 54 U - - - - - -
W.S. CENTRAL 17 12 1,250 1,264 168 223 1 1 1 1 2 1
Ark. 1 - 100 153 19 29 - - - - - -
La. - - 64 20 39 13 - - - - - -
Okla. 13 11 543 565 8 16 - - - - - -
Tex. 3 1 543 526 102 165 1 1 1 1 2 1
MOUNTAIN 35 23 1,311 1,243 285 329 - - - - - 5
Mont. - - 39 41 2 4 - - - - - -
Idaho - 1 57 109 10 35 - - - - - -
Wyo. - - 14 10 11 8 - - - - - -
Colo. 2 5 149 126 58 44 - - - - - 1
N. Mex. 2 7 82 169 97 123 - - - - - -
Ariz. 12 6 611 390 58 56 - - - - - -
Utah 3 4 254 300 32 42 - - - - - -
Nev. 16 - 105 98 17 17 - - - - - 4
PACIFIC 61 102 2,379 2,718 536 540 - 3 - 3 6 63
Wash. 1 1 172 159 17 28 - - - - - 4
Oreg. 14 12 122 409 41 41 - - - - - -
Calif. 43 87 2,023 2,101 464 468 - - - 3 3 -
Alaska 1 - 15 23 10 1 - - - - - 58
Hawaii 2 2 47 26 4 2 - 3 - - 3 1
Guam - - - 2 - - U - U - - -
P.R. - - 104 21 382 54 - - - - - 1
V.I. - - - - - - U - U - - -
Amer. Samoa - - - - - - U - U - - -
C.N.M.I. 4 10 1 1 16 5 U 1 U - 1 -
-----------------------------------------------------------------------------------------------------------------------------------------------------
N: Not notifiable U: Unavailable -: no reported cases
* Of 72 cases among children aged <5 years, serotype was reported for 34 and of those, 16 were type b.
** For imported measles, cases include only those resulting from importation from other countries.
=======================================================================================================================================================
TABLE III. (page 2) Provisional cases of selected notifiable diseases preventable by vaccination, United
States, weeks ending April 19, 1997, and April 20, 1996 (16th Week)
Meningococcal
Disease Mumps Pertussis Rubella
----------------- -------------------------- --------------------------- ---------------------------
Cum. Cum. Cum. Cum. Cum. Cum. Cum. Cum.
Reporting Area 1997 1996 1997 1997 1996 1997 1997 1996 1997 1997 1996
------------------------------------------------------------------------------------------------------------------------------------------
UNITED STATES 1,276 1,196 12 181 194 134 1,397 858 1 12 63
NEW ENGLAND 81 49 - 6 - 6 345 185 - - 7
Maine 9 6 - - - - 6 8 - - -
N.H. 7 1 - - - 4 46 17 - - -
Vt. 2 2 - - - 2 133 7 - - 1
Mass. 46 18 - 1 - - 144 150 - - 4
R.I. 4 5 - 4 - - 11 - - - -
Conn. 13 17 - 1 - - 5 3 - - 2
MID. ATLANTIC 109 113 4 20 23 5 95 75 - 2 5
Upstate N.Y. 26 28 - 3 7 - 42 41 - 1 3
N.Y. City 19 19 - - 4 - 6 13 - 1 1
N.J. 26 25 - - 2 - - 3 - - 1
Pa. 38 41 4 17 10 5 47 18 - - -
E.N. CENTRAL 163 170 - 23 54 5 127 158 - 2 3
Ohio 69 53 - 8 19 1 55 52 - - -
Ind. 17 18 - 4 5 2 13 9 - - -
Ill. 50 58 - 7 10 2 18 48 - - 1
Mich. 14 20 - 4 19 - 23 10 - - 2
Wis. 13 21 U - 1 U 18 39 U 2 -
W.N. CENTRAL 100 97 - 8 2 15 95 37 - - -
Minn. 6 9 - 3 - 14 59 23 - - -
Iowa 24 17 - 3 - - 14 2 - - -
Mo. 52 45 - - - - 12 7 - - -
N. Dak. - 2 - - 2 1 2 - - - -
S. Dak. 3 3 - - - - 1 1 - - -
Nebr. 5 9 U 2 - U 2 1 U - -
Kans. 10 12 - - - - 5 3 - - -
S. ATLANTIC 232 172 1 26 19 22 146 72 - 2 10
Del. 4 2 - - - - - 9 - - -
Md. 26 20 - 4 9 1 53 30 - - -
D.C. 1 4 - - - - 2 - - - -
Va. 19 17 - 2 3 - 17 3 - 1 -
W. Va. 4 6 - - - - 3 2 - - -
N.C. 39 27 - 6 - - 28 9 - - -
S.C. 34 25 U 1 3 U 6 1 U 1 -
Ga. 41 61 - 2 1 - 2 2 - - -
Fla. 64 10 1 11 3 21 35 16 - - 10
E.S. CENTRAL 100 101 - 12 9 2 31 34 - - -
Ky. 21 13 - - - - 2 25 - - -
Tenn. 38 29 - 4 1 - 13 6 - - -
Ala. 26 31 - 4 3 1 8 1 - - -
Miss. 15 28 - 4 5 1 8 2 - - N
W.S. CENTRAL 116 133 2 22 16 1 21 28 1 1 6
Ark. 23 17 - - - - 3 2 - - -
La. 22 25 1 6 7 - 7 2 - - -
Okla. 13 9 - - - - 1 1 - - -
Tex. 58 82 1 16 9 1 10 23 1 1 6
MOUNTAIN 77 75 - 8 11 72 336 112 - - 3
Mont. 4 1 - - - - 2 4 - - -
Idaho 5 11 - 2 - 69 233 33 - - 2
Wyo. - - - - - - 3 - - - -
Colo. 22 12 - 2 - 3 75 21 - - -
N. Mex. 13 14 N N N - 12 25 - - -
Ariz. 16 22 - - 1 - 9 5 - - 1
Utah 11 8 - 2 1 - 1 3 - - -
Nev. 6 7 - 2 9 - 1 21 - - -
PACIFIC 298 286 5 56 60 6 201 157 - 5 29
Wash. 33 35 1 4 6 6 104 64 - - 1
Oreg. 64 53 - - - - 7 21 - - -
Calif. 200 192 4 42 43 - 85 64 - 1 26
Alaska - 4 - 1 2 - 1 - - - -
Hawaii 1 2 - 9 9 - 4 8 - 4 2
Guam - 1 U - 3 U - - U - -
P.R. 6 2 - 4 1 - - - - - -
V.I. - - U - - U - - U - -
Amer. Samoa - - U - - U - - U - -
C.N.M.I. - - U - - U - - U - -
------------------------------------------------------------------------------------------------------------------------------------------
N: Not notifiable U: Unavailable -: no reported cases
=======================================================================================================================================================
Return to top. Table_IV Note: To print large tables and graphs users may have to change their printer settings to landscape and use a small font size.
TABLE IV. Deaths in 122 U.S. cities,* week ending
April 19, 1997 (16th Week)
===================================================================================================================================
All Causes, By Age (Years)
------------------------------------------------------------------------ P&I**
Reporting Area All Ages >=65 45-64 25-44 1-24 <1 Total
---------------------------------------------------------------------------------------------------------------
NEW ENGLAND 615 434 117 46 11 7 44
Boston, Mass. 151 105 21 19 4 2 13
Bridgeport, Conn. 44 28 10 6 - - 2
Cambridge, Mass. 19 13 4 2 - - -
Fall River, Mass. 33 28 3 1 1 - -
Hartford, Conn. 53 29 16 5 2 1 1
Lowell, Mass. 26 21 3 2 - - 3
Lynn, Mass. 12 10 1 1 - - 1
New Bedford, Mass. 25 17 8 - - - 1
New Haven, Conn. 42 32 6 1 1 2 1
Providence, R.I. 66 48 12 2 2 2 2
Somerville, Mass. 2 2 - - - - -
Springfield, Mass. 46 26 15 5 - - 6
Waterbury, Conn. 34 26 6 1 1 - 4
Worcester, Mass. 62 49 12 1 - - 10
MID. ATLANTIC 2,410 1,695 425 199 47 44 122
Albany, N.Y. 46 35 8 2 1 - 7
Allentown, Pa. 34 27 6 1 - - 1
Buffalo, N.Y. 72 48 17 5 1 1 4
Camden, N.J. 57 40 9 6 1 1 1
Elizabeth, N.J. 22 11 4 4 1 2 -
Erie, Pa. 37 30 5 - - 2 2
Jersey City, N.J. 41 27 6 6 - 2 -
New York City, N.Y. 1,212 820 230 120 23 19 43
Newark, N.J. 50 27 11 8 3 1 2
Paterson, N.J. 16 9 4 2 1 - -
Philadelphia, Pa. 399 281 72 28 10 8 29
Pittsburgh, Pa.*** 81 62 11 6 1 1 6
Reading, Pa. 12 6 4 1 - 1 -
Rochester, N.Y. 116 95 14 3 - 4 9
Schenectady, N.Y. 35 29 4 1 1 - -
Scranton, Pa. 39 32 5 2 - - 2
Syracuse, N.Y. 78 64 10 2 1 1 9
Trenton, N.J. 22 17 1 1 2 1 1
Utica, N.Y. 16 12 3 1 - - 2
Yonkers, N.Y. 25 23 1 - 1 - 4
E.N. CENTRAL 2,235 1,538 453 159 45 38 175
Akron, Ohio 60 52 3 1 3 1 -
Canton, Ohio 44 28 11 3 - 2 6
Chicago, Ill. 439 275 106 37 14 7 44
Cincinnati, Ohio 70 49 15 5 - 1 8
Cleveland, Ohio 152 107 29 14 1 1 1
Columbus, Ohio 173 125 29 13 3 3 25
Dayton, Ohio 159 116 31 5 4 3 17
Detroit, Mich. 245 135 69 25 7 7 8
Evansville, Ind. 53 40 9 3 1 - 2
Fort Wayne, Ind. 69 54 11 2 - 2 3
Gary, Ind. U U U U U U U
Grand Rapids, Mich. 44 35 6 1 - 2 2
Indianapolis, Ind. 227 151 50 19 3 4 18
Lansing, Mich. 43 31 3 4 3 2 2
Milwaukee, Wis. 134 88 33 11 1 1 12
Peoria, Ill. 39 30 7 2 - - 5
Rockford, Ill. 45 34 6 3 1 1 4
South Bend, Ind. 50 43 7 - - - 7
Toledo, Ohio 118 90 18 6 4 - 10
Youngstown, Ohio 71 55 10 5 - 1 1
W.N. CENTRAL 707 509 103 45 20 16 48
Des Moines, Iowa 37 27 5 4 - 1 5
Duluth, Minn. 32 29 2 1 - - 7
Kansas City, Kans. 22 13 4 4 1 - -
Kansas City, Mo. 101 57 18 6 4 2 3
Lincoln, Nebr. 39 29 7 3 - - 2
Minneapolis, Minn. 139 107 20 7 3 2 10
Omaha, Nebr. 90 65 13 7 3 2 7
St. Louis, Mo. 140 101 22 6 6 5 8
St. Paul, Minn. 50 38 8 2 1 1 2
Wichita, Kans. 57 43 4 5 2 3 4
S. ATLANTIC 1,175 756 259 107 30 22 60
Atlanta, Ga. 217 133 48 29 4 3 11
Baltimore, Md. 153 102 26 18 3 3 12
Charlotte, N.C. 48 31 11 4 - 2 4
Jacksonville, Fla. 139 94 31 6 6 2 2
Miami, Fla. 105 66 15 15 6 3 2
Norfolk, Va. 58 39 12 5 2 - 4
Richmond, Va. U U U U U U U
Savannah, Ga. 44 30 11 1 1 1 3
St. Petersburg, Fla. 49 37 6 4 1 1 2
Tampa, Fla. 207 144 45 12 4 2 12
Washington, D.C. 137 72 44 13 3 5 8
Wilmington, Del. 18 8 10 - - - -
E.S. CENTRAL 808 552 161 59 20 16 53
Birmingham, Ala. U U U U U U U
Chattanooga, Tenn. 66 42 13 7 2 2 3
Knoxville, Tenn. 104 79 19 4 1 1 4
Lexington, Ky. 80 55 14 6 3 2 6
Memphis, Tenn. 291 199 60 23 7 2 21
Mobile, Ala. 69 47 16 4 - 2 1
Montgomery, Ala. 29 21 8 - - - 2
Nashville, Tenn. 169 109 31 15 7 7 16
W.S. CENTRAL 1,507 1,002 305 118 52 30 97
Austin, Tex. 84 57 16 7 3 1 8
Baton Rouge, La. 47 32 9 3 1 2 1
Corpus Christi, Tex. 47 35 7 3 2 - 3
Dallas, Tex. 176 113 37 17 4 5 5
El Paso, Tex. 111 83 19 5 3 1 16
Ft. Worth, Tex. 108 71 21 10 5 1 9
Houston, Tex. 355 228 83 27 14 3 22
Little Rock, Ark. 96 62 20 4 4 6 6
New Orleans, La. 101 58 20 13 6 4 -
San Antonio, Tex. 220 145 48 16 6 5 15
Shreveport, La. 57 49 6 2 - - 3
Tulsa, Okla. 105 69 19 11 4 2 9
MOUNTAIN 811 570 147 65 15 13 65
Albuquerque, N.M. 85 61 16 6 2 - 3
Boise, Idaho 48 36 7 5 - - 4
Colo. Springs, Colo. 53 43 8 1 - 1 3
Denver, Colo. 75 46 15 10 3 1 8
Las Vegas, Nev. 139 95 32 11 1 - 11
Ogden, Utah 15 12 1 1 1 - 1
Phoenix, Ariz. 146 95 21 18 4 7 15
Pueblo, Colo. 18 14 4 - - - 3
Salt Lake City, Utah 89 55 22 5 3 4 7
Tucson, Ariz. 143 113 21 8 1 - 10
PACIFIC 1,324 950 208 110 27 29 147
Berkeley, Calif. 21 17 4 - - - 2
Fresno, Calif. 63 41 12 7 3 - 4
Glendale, Calif. U U U U U U U
Honolulu, Hawaii 67 51 11 5 - - 6
Long Beach, Calif. 71 55 10 4 2 - 7
Los Angeles, Calif. U U U U U U U
Pasadena, Calif. 16 11 4 1 - - 2
Portland, Oreg. 121 93 17 8 2 1 11
Sacramento, Calif. 227 160 45 15 3 4 39
San Diego, Calif. 155 110 24 13 3 5 20
San Francisco, Calif. 151 103 25 16 2 5 18
San Jose, Calif. 209 151 26 19 5 8 27
Santa Cruz, Calif. 25 15 7 3 - - 4
Seattle, Wash. 145 108 12 15 6 4 4
Spokane, Wash. 53 35 11 4 1 2 3
Tacoma, Wash. U U U U U U U
TOTAL 11,592**** 8,006 2,178 908 267 215 811
---------------------------------------------------------------------------------------------------------------
U: Unavailable -: no reported cases
* Mortality data in this table are voluntarily reported from 122 cities in the United States, most of which have populations
of 100,000 or more. A death is reported by the place of its occurrence and by the week that the death certificate was
filed. Fetal deaths are not included.
** Pneumonia and influenza.
*** Because of changes in reporting methods in these 3 Pennsylvania cities, these numbers are partial counts for the current
week. Complete counts will be available in 4 to 6 weeks.
**** Total includes unknown ages.
===================================================================================================================================
Return to top. Disclaimer All MMWR HTML versions of articles are electronic conversions from ASCII text into HTML. This conversion may have resulted in character translation or format errors in the HTML version. Users should not rely on this HTML document, but are referred to the electronic PDF version and/or the original MMWR paper copy for the official text, figures, and tables. An original paper copy of this issue can be obtained from the Superintendent of Documents, U.S. Government Printing Office (GPO), Washington, DC 20402-9371; telephone: (202) 512-1800. Contact GPO for current prices. **Questions or messages regarding errors in formatting should be addressed to mmwrq@cdc.gov.Page converted: 09/19/98 |
|||||||||
This page last reviewed 5/2/01
|