 |
|
|
|
|
|
|
| ||||||||||
|
|
|
|
|
|
|
||||
| ||||||||||
|
|
|
|
|
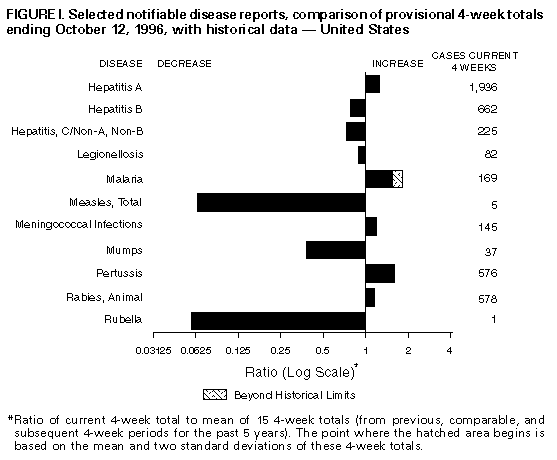
Persons using assistive technology might not be able to fully access information in this file. For assistance, please send e-mail to: mmwrq@cdc.gov. Type 508 Accommodation and the title of the report in the subject line of e-mail. Notifiable Diseases/Deaths in Selected Cities Weekly InformationFigure_I Selected notifiable disease reports, comparison of 4-week totals ending October 12, 1996, with historical data -- United States Table_I Summary -- provisional cases of selected notifiable diseases, United States, cumulative, week ending October 12, 1996 (41st Week) Table_II Provisional cases of selected notifiable diseases, United States, weeks ending October 12, 1996 and October 14, 1995 (41st Week) Table_III Provisional cases of selected notifiable diseases preventable by vaccination, United States, weeks ending October 12, 1996 and October 14, 1995 (41st Week) Table_IV Deaths in 121 U.S. cities, week ending
October 12, 1996 (41st Week)
TABLE I. Summary -- provisional cases of specified notifiable diseases, United
States, cumulative, week ending October 12, 1996 (41st Week)
==================================================================================
                                             Cum. 1996
------------------------------------------------------
Anthrax                                              -
Brucellosis                                         63
Cholera                                              3
Congenital rubella syndrome                          1
Cryptosporidiosis*                               1,683
Diphtheria                                           1
Encephalitis:  California*                          74
               eastern equine*                       1
               St. Louis*                            -
               western equine*                       -
Hansen Disease                                      84
Hantavirus pulmonary syndrome*+                     15
HIV infection, pediatric*&                         216
Plague                                               2
Poliomyelitis, paralytic@                            -
Psittacosis                                         34
Rabies, human                                        1
Rocky Mountain spotted fever (RMSF)                566
Streptococcal toxic-shock syndrome*                 13
Syphilis, congenital**                             225
Tetanus                                             22
Toxic-shock syndrome                               106
Trichinosis                                         16
Typhoid fever                                      282
------------------------------------------------------
 * Not notifiable in all states
 + Updated weekly from reports to the Division of Viral and Rickettsial
   Diseases, National Center for Infectious Diseases (NCID).
 & Updated monthly to the Division of HIV/AIDS Prevention, National Center
   for HIV, STD, and TB Prevention (NCHSTP), last update September 24, 1996.
 @ Three suspected cases of polio with onset in 1996 have been reported to date.
** Updated quarterly from reports to the Division of STD Prevention,
   NCHSTP.
-: no reported cases
==================================================================================
Return to top. Table_II Note: To print large tables and graphs users may have to change their printer settings to landscape and use a small font size.
TABLE II. (page 1) Provisional cases of selected notifiable diseases, United States, weeks ending
October 12, 1996, and October 14, 1995 (41st Week)
Escherichia
coli O157:H7
------------------- Hepatitis
AIDS* Chlamydia NETSS** PHLIS*** Gonorrhea C\NA,NB Legionellosis
----------------- --------- -------- -------- ------------------- ---------------- -----------------
Reporting Area Cum. Cum. Cum. Cum. Cum. Cum. Cum. Cum. Cum. Cum. Cum.
1996 1995 1996 1996 1996 1996 1995 1996 1995 1996 1995
------------------------------------------------------------------------------------------------------------------------------------------
UNITED STATES 51,611 55,190 285,193 2,129 1,116 222,015 310,841 2,626 3,131 690 946
NEW ENGLAND 2,065 2,741 13,120 289 67 5,441 6,000 94 102 42 29
Maine 32 82 707 21 - 49 72 - - 2 5
N.H. 66 77 397 36 31 80 91 8 12 3 2
Vt. 18 28 U 30 26 42 48 32 10 4 -
Mass. 997 1,235 5,529 136 10 1,769 2,106 48 73 24 18
R.I. 129 187 1,517 15 - 408 417 6 7 9 4
Conn. 823 1,132 4,970 51 - 3,093 3,266 - - N N
MID. ATLANTIC 14,243 15,014 34,298 185 39 26,142 34,499 241 364 172 162
Upstate N.Y. 1,855 1,779 N 127 12 5,290 7,410 190 184 58 43
N.Y. City 7,855 7,617 15,878 10 - 8,618 13,879 1 1 6 5
N.J. 2,905 3,716 4,161 48 5 3,971 3,325 - 143 12 24
Pa. 1,628 1,902 14,259 N 22 8,263 9,885 50 36 96 90
E.N. CENTRAL 4,076 4,197 48,428 504 326 32,875 62,303 360 261 183 279
Ohio 871 847 14,294 147 82 10,288 19,416 30 9 83 127
Ind. 498 423 7,933 72 47 5,160 7,147 8 4 38 69
Ill. 1,808 1,727 19,358 199 84 14,119 16,010 53 72 9 25
Mich. 685 914 U 86 65 U 14,473 269 176 36 27
Wis. 214 286 6,843 N 48 3,308 5,257 - - 17 31
W.N. CENTRAL 1,221 1,265 22,096 490 287 9,934 16,052 98 68 35 68
Minn. 226 284 2,702 224 202 U 2,430 2 4 4 6
Iowa 72 91 3,435 105 55 906 1,274 43 12 7 19
Mo. 626 559 9,654 53 - 6,553 9,081 33 18 8 14
N. Dak. 10 4 2 14 14 - 26 - 5 - 3
S. Dak. 10 14 739 20 - 104 172 - 1 2 3
Nebr. 83 84 2,049 45 4 783 945 5 15 11 16
Kans. 194 229 3,515 29 12 1,588 2,124 15 13 3 7
S. ATLANTIC 13,079 14,165 43,375 118 59 75,658 86,852 213 197 116 149
Del. 232 265 1,148 1 1 1,147 1,771 1 - 11 2
Md. 1,961 2,226 5,448 N 8 11,478 10,467 1 7 25 24
D.C. 1,001 828 N - - 3,386 3,668 - - 8 4
Va. 896 1,122 8,984 N 29 7,108 8,636 13 16 16 21
W. Va. 88 84 1 N 2 419 542 9 43 1 4
N.C. 677 835 - 37 12 14,440 19,208 41 47 9 31
S.C. 667 766 - 9 7 8,594 9,844 25 19 5 30
Ga. 1,867 1,791 9,315 30 - 14,685 16,399 U 15 3 14
Fla. 5,690 6,248 18,479 29 - 14,401 16,317 123 50 38 19
E.S. CENTRAL 1,749 1,760 24,075 55 50 25,724 32,109 453 810 39 50
Ky. 309 220 5,230 11 6 3,310 3,776 27 28 4 10
Tenn. 647 709 10,559 23 41 9,405 10,913 330 780 19 24
Ala. 470 483 6,690 10 3 10,622 13,242 5 2 3 6
Miss. 323 348 U 11 - 2,387 4,178 91 U 13 10
W.S. CENTRAL 5,138 4,686 32,045 61 12 24,199 43,695 371 259 18 20
Ark. 207 222 - 13 3 2,620 4,359 8 6 2 6
La. 1,177 792 5,935 6 4 6,341 8,779 175 148 1 3
Okla. 189 207 5,996 10 1 3,863 4,696 69 40 5 4
Tex. 3,565 3,465 20,114 32 4 11,375 25,861 119 65 10 7
MOUNTAIN 1,533 1,757 12,861 174 87 5,499 7,426 459 386 37 97
Mont. 33 17 - 23 - 25 55 14 13 1 4
Idaho 32 38 1,213 30 10 86 115 93 44 - 2
Wyo. 5 13 461 11 9 32 43 146 161 3 12
Colo. 406 523 - 62 35 1,077 2,281 47 57 7 35
N. Mex. 139 138 3,017 10 - 685 837 63 42 2 4
Ariz. 461 550 5,132 N 22 2,713 2,865 56 38 16 9
Utah 144 112 1,234 23 - 241 209 22 11 3 13
Nev. 313 366 1,804 15 11 640 1,021 18 20 5 18
PACIFIC 8,506 9,605 54,895 253 189 16,543 21,905 337 684 48 92
Wash. 538 712 7,287 79 72 1,606 2,172 46 161 6 20
Oreg. 359 348 U 65 37 475 610 6 34 1 -
Calif. 7,440 8,295 41,530 105 70 13,848 18,110 111 437 36 67
Alaska 28 60 946 4 2 340 544 3 1 1 -
Hawaii 141 190 1,031 N 8 274 469 171 51 4 5
Guam 4 - 168 N - 31 89 1 5 2 1
P.R. 1,792 1,951 N 16 U 296 470 81 185 - -
V.I. 17 27 N N U - - - - - -
Amer. Samoa - - - N U - 26 - - - -
C.N.M.I. 1 - N N U 11 51 - 5 - -
------------------------------------------------------------------------------------------------------------------------------------------
N: Not notifiable U: Unavailable -: no reported cases C.N.M.I.: Commonwealth of North Mariana Islands
* Updated monthly to the Division of HIV/AIDS Prevention, National Center for HIV, STD, and TB Prevention, last update September 24, 1996.
** National Electronic Telecommunications System for Surveillance.
*** Public Health Laboratory Information System.
=======================================================================================================================================================
TABLE II. (page 2) Provisional cases of selected notifiable diseases, United States, weeks ending
October 12, 1996, and October 14, 1995 (41st Week)
Meningococcal Syphilis
Lyme Malaria Disease (Primary & Secondary) Tuberculosis Rabies, Animal
---------------- ---------------- ---------------- --------------------- ----------------- ----------------
Reporting Area Cum. Cum. Cum. Cum. Cum. Cum. Cum. Cum. Cum. Cum. Cum. Cum.
1996 1995 1996 1995 1996 1995 1996 1995 1996 1995 1996 1995
-----------------------------------------------------------------------------------------------------------------------------------------------------
UNITED STATES 10,668 8,843 1,164 1,045 2,535 2,404 8,508 13,019 14,693 16,399 5,387 6,228
NEW ENGLAND 3,380 1,706 46 39 109 111 133 292 341 391 594 1,248
Maine 43 24 7 5 12 8 - 2 21 11 89 46
N.H. 38 20 2 1 5 19 1 1 11 15 51 125
Vt. 15 8 4 1 3 9 - - 1 2 122 149
Mass. 292 116 17 13 41 38 63 48 171 217 94 369
R.I. 428 285 6 4 13 5 2 3 27 40 33 269
Conn. 2,564 1,253 10 15 35 32 67 238 110 106 205 290
MID. ATLANTIC 6,288 5,785 321 282 227 302 342 667 2,641 3,407 1,140 1,583
Upstate N.Y. 3,323 2,888 70 53 68 82 57 72 325 407 849 934
N.Y. City 244 368 169 156 32 44 106 289 1,315 1,910 - -
N.J. 1,100 1,540 56 55 55 70 77 136 589 603 107 284
Pa. 1,621 989 26 18 72 106 102 170 412 487 184 365
E.N. CENTRAL 67 381 109 133 341 341 1,107 2,240 1,604 1,549 85 90
Ohio 41 24 13 11 128 96 466 709 238 213 11 10
Ind. 23 16 13 15 54 48 164 267 140 138 7 14
Ill. 3 16 35 68 89 89 339 866 840 799 23 15
Mich. - 5 35 18 38 62 U 232 297 330 31 37
Wis. U 320 13 21 32 46 138 166 89 69 13 14
W.N. CENTRAL 133 157 42 23 202 151 289 620 369 465 440 310
Minn. 59 80 19 4 25 25 51 37 81 113 25 24
Iowa 20 12 2 3 41 28 16 39 50 49 204 110
Mo. 22 42 9 7 85 56 189 507 155 179 17 28
N. Dak. - - 1 1 3 1 - - 6 3 56 24
S. Dak. - - - 2 9 5 - - 17 20 105 82
Nebr. 3 4 3 3 17 14 11 11 13 20 5 5
Kans. 29 19 8 3 22 22 22 26 47 81 28 37
S. ATLANTIC 558 552 244 207 516 401 2,970 3,257 2,832 2,903 2,226 1,728
Del. 78 38 3 1 2 6 34 14 20 46 61 79
Md. 328 364 66 55 66 35 521 370 241 314 504 347
D.C. 3 3 7 16 10 5 113 91 108 86 9 11
Va. 42 47 39 47 48 55 325 497 234 202 480 350
W. Va. 11 22 5 3 11 8 3 9 50 58 79 97
N.C. 62 49 25 15 65 68 836 894 400 335 581 392
S.C. 5 16 11 1 48 51 305 472 277 253 74 107
Ga. 1 10 23 27 117 78 524 610 502 571 240 233
Fla. 28 3 65 42 149 95 309 300 1,000 1,038 198 112
E.S. CENTRAL 56 62 26 23 184 169 1,992 2,686 1,014 1,132 173 238
Ky. 14 13 3 3 25 37 119 148 185 248 36 24
Tenn. 19 28 13 9 50 67 654 697 306 345 66 80
Ala. 6 7 3 8 62 34 448 520 337 324 68 125
Miss. 17 14 7 3 47 31 771 1,321 186 215 3 9
W.S. CENTRAL 95 93 38 48 289 283 1,175 2,593 1,763 2,228 322 534
Ark. 21 7 - 2 33 27 121 398 146 192 21 41
La. 2 5 6 5 47 43 429 803 59 217 13 24
Okla. 20 40 - 1 31 30 148 151 134 146 27 28
Tex. 52 41 32 40 178 183 477 1,241 1,424 1,673 U 441
MOUNTAIN 7 12 51 53 144 171 111 176 488 525 130 155
Mont. - - 7 3 4 2 - 4 14 10 20 41
Idaho 1 - - 1 22 8 4 - 7 12 - 3
Wyo. 2 3 7 - 3 8 2 - 6 3 26 23
Colo. - - 21 23 31 43 23 96 71 59 41 9
N. Mex. 1 1 2 5 22 30 1 6 64 66 6 6
Ariz. - 1 6 10 35 50 66 36 186 257 28 47
Utah 1 1 4 6 15 15 2 4 39 31 4 15
Nev. 2 6 4 5 12 15 13 30 101 87 5 11
PACIFIC 84 95 287 237 523 475 389 488 3,641 3,799 277 342
Wash. 14 10 20 19 82 76 5 12 211 217 6 13
Oreg. 13 15 18 15 93 86 11 19 134 103 1 2
Calif. 56 70 239 190 336 299 372 455 3,107 3,269 262 320
Alaska - - 3 3 8 10 - 2 50 61 8 7
Hawaii 1 - 7 10 4 4 1 - 139 149 - -
Guam - - - 1 1 2 3 8 35 86 - -
P.R. - - - 1 4 23 108 229 63 162 38 35
V.I. - - - 2 - - - - - - - -
Amer. Samoa - - - - - - - - - 4 - -
C.N.M.I. - - - 1 - - 1 9 - 31 - -
-----------------------------------------------------------------------------------------------------------------------------------------------------
N: Not notifiable U: Unavailable -: no reported cases
=======================================================================================================================================================
Return to top. Table_III Note: To print large tables and graphs users may have to change their printer settings to landscape and use a small font size.
TABLE III. (page 1) Provisional cases of selected notifiable diseases preventable by vaccination, United
States, weeks ending October 12, 1996, and October 14, 1995 (41st Week)
Hepatitis (Viral), by type Measles (Rubeola)
H. influenzae, --------------------------------------- -------------------------------------
invasive A B Indigenous Imported**
---------------- ----------------- ----------------- --------------- ---------------
Reporting Area Cum. Cum. Cum. Cum. Cum. Cum. Cum. Cum.
1996* 1995 1996 1995 1996 1995 1996 1996 1996 1996
------------------------------------------------------------------------------------------------------------------------------
UNITED STATES 823 894 21,574 23,319 7,568 7,794 - 399 - 44
NEW ENGLAND 24 33 302 239 155 184 - 11 - 4
Maine - 3 16 23 2 7 - - - -
N.H. 9 9 13 11 14 18 - - - -
Vt. 1 2 6 5 10 5 - 1 - 1
Mass. 12 10 156 102 51 70 - 9 - 3
R.I. 2 3 15 28 9 8 - - - -
Conn. - 6 96 70 69 76 - 1 - -
MID. ATLANTIC 147 133 1,476 1,430 1,173 1,104 - 23 - 5
Upstate N.Y. 43 36 347 360 261 299 - - - -
N.Y. City 31 32 475 676 485 332 - 9 - 3
N.J. 47 18 278 212 205 304 - 3 - -
Pa. 26 47 376 182 222 169 - 11 - 2
E.N. CENTRAL 134 150 1,790 2,630 783 887 - 5 - 7
Ohio 80 75 630 1,485 103 88 - 2 - 3
Ind. 10 19 255 147 128 182 - - - -
Ill. 32 38 413 533 195 231 - 2 - 1
Mich. 7 16 345 297 302 325 - - - 3
Wis. 5 2 147 168 55 61 - 1 - -
W.N. CENTRAL 41 68 1,929 1,552 349 508 - 20 - 2
Minn. 25 38 108 157 50 49 - 16 - 2
Iowa 5 3 300 67 60 40 - - - -
Mo. 7 20 916 1,101 171 349 - 3 - -
N. Dak. - - 100 22 2 4 U - U -
S. Dak. 1 1 41 49 5 2 - - - -
Nebr. 1 3 176 38 33 25 - - - -
Kans. 2 3 288 118 28 39 - 1 - -
S. ATLANTIC 161 174 1,133 899 1,174 1,006 - 4 - 9
Del. 2 - 15 9 7 7 - 1 - -
Md. 51 58 198 171 241 205 - - - 2
D.C. 5 - 30 21 28 15 U - U -
Va. 8 23 135 167 112 93 - - - 3
W. Va. 7 7 13 21 21 45 - - - -
N.C. 22 25 136 89 265 224 - 3 - 1
S.C. 4 2 44 40 72 40 - - - -
Ga. 42 54 149 51 30 62 - - - 2
Fla. 20 5 413 330 398 315 - - - 1
E.S. CENTRAL 26 10 1,037 1,543 662 692 - 2 - -
Ky. 5 4 38 41 52 60 - - - -
Tenn. 12 - 677 1,273 378 547 - 2 - -
Ala. 8 5 148 71 57 85 - - - -
Miss. 1 1 174 158 175 U U - U -
W.S. CENTRAL 33 56 4,507 3,420 999 1,074 - 26 - 2
Ark. - 6 401 455 63 51 - - - -
La. 3 1 150 102 116 157 - - - -
Okla. 27 21 1,897 878 59 138 - - - -
Tex. 3 28 2,059 1,985 761 728 - 26 - 2
MOUNTAIN 82 97 3,468 3,282 895 669 - 152 - 5
Mont. - - 97 118 12 19 - - - -
Idaho 1 3 178 258 76 76 - 1 - -
Wyo. 35 6 29 97 36 22 - 1 - -
Colo. 12 14 374 419 115 101 - 4 - 3
N. Mex. 9 12 314 691 312 254 - 16 - -
Ariz. 9 24 1,341 894 199 97 U 8 U -
Utah 8 10 809 589 81 53 - 117 - 2
Nev. 8 28 326 216 64 47 - 5 - -
PACIFIC 175 173 5,932 8,324 1,378 1,670 - 156 - 10
Wash. 3 8 433 682 77 150 - 51 - -
Oreg. 22 22 689 2,199 81 98 - 4 - -
Calif. 146 138 4,714 5,261 1,194 1,398 - 36 - 5
Alaska 2 1 36 40 14 11 - 63 - -
Hawaii 2 4 60 142 12 13 - 2 - 5
Guam - - 2 7 - 4 U - U -
P.R. 1 3 96 83 294 495 - 7 - -
V.I. - - - 7 - 14 U - U -
Amer. Samoa - - - 6 - - U - U -
C.N.M.I. 10 11 1 24 5 22 U - U -
------------------------------------------------------------------------------------------------------------------------------
N: Not notifiable U: Unavailable -: no reported cases
* Of 195 cases reported among children aged <5 years, serotype was reported for 43 and of those, 13 were type b.
** For imported measles, cases include only those resulting from importation from other countries.
============================================================================================================================================
TABLE III. (page 2) Provisional cases of selected notifiable diseases preventable by vaccination, United
States, weeks ending October 12, 1996, and October 14, 1995 (41st Week)
Measles (Rubeola), cont'd.
--------------------------
Total Mumps Pertussis Rubella
-------------------------- -------------------------- --------------------------- ---------------------------
Reporting Area Cum. Cum. Cum. Cum. Cum. Cum. Cum. Cum.
1996 1995 1996 1996 1995 1996 1996 1995 1996 1996 1995
------------------------------------------------------------------------------------------------------------------------------------------
UNITED STATES 443 277 8 508 674 135 4,058 3,424 - 202 107
NEW ENGLAND 15 9 - 2 11 23 848 465 - 27 44
Maine - - - - 4 - 20 28 - - -
N.H. - - - - 1 14 90 43 - - 1
Vt. 2 - - - - 6 91 62 - 2 -
Mass. 12 2 - 2 2 3 590 306 - 21 7
R.I. - 5 - - 1 - 30 3 - - -
Conn. 1 2 - - 3 - 27 23 - 4 36
MID. ATLANTIC 28 12 3 74 101 27 367 287 - 11 13
Upstate N.Y. - 1 - 22 24 17 210 133 - 4 3
N.Y. City 12 5 - 16 15 1 29 44 - 4 8
N.J. 3 6 - 2 17 - 16 17 - 2 2
Pa. 13 - 3 34 45 9 112 93 - 1 -
E.N. CENTRAL 12 15 - 86 122 6 414 439 - 3 3
Ohio 5 2 - 39 41 - 192 120 - - -
Ind. - - - 7 8 - 46 42 - - -
Ill. 3 2 - 19 33 6 137 88 - 1 -
Mich. 3 5 - 20 40 - 34 62 - 2 3
Wis. 1 6 - 1 - - 5 127 - - -
W.N. CENTRAL 22 2 - 14 38 10 307 232 - - -
Minn. 18 - - 5 2 9 243 120 - - -
Iowa - - - 1 9 - 15 7 - - -
Mo. 3 1 - 5 22 1 33 55 - - -
N. Dak. - - U 2 1 U 1 8 U - -
S. Dak. - - - - - - 4 11 - - -
Nebr. - - - - 4 - 7 10 - - -
Kans. 1 1 - 1 - - 4 21 - - -
S. ATLANTIC 13 12 2 87 97 20 479 291 - 91 9
Del. 1 - - - - - 12 10 - - -
Md. 2 1 1 25 30 10 177 37 - - 1
D.C. - - U - - U 1 6 U 1 -
Va. 3 - - 12 20 - 71 19 - 2 -
W. Va. - - - - - - 2 - - - -
N.C. 4 - - 19 16 - 79 110 - 77 1
S.C. - - - 5 10 4 36 22 - 1 -
Ga. 2 2 - 3 6 - 17 19 - - -
Fla. 1 9 1 23 15 6 84 68 - 10 7
E.S. CENTRAL 2 - - 21 9 - 75 265 - 2 1
Ky. - - - - - - 29 22 - - -
Tenn. 2 - - 3 2 - 19 206 - - 1
Ala. - - - 3 4 - 18 35 - 2 -
Miss. - - U 15 3 U 9 2 N N N
W.S. CENTRAL 28 29 - 28 47 3 96 254 - 3 7
Ark. - 2 - 2 7 - 10 33 - - -
La. - 18 - 13 12 - 8 17 - 1 -
Okla. - - - - - - 8 28 - - -
Tex. 28 9 - 13 28 3 70 176 - 2 7
MOUNTAIN 157 68 - 21 30 4 349 509 - 7 4
Mont. - - - - 1 1 28 3 - - -
Idaho 1 - - - 3 - 102 96 - 3 -
Wyo. 1 - - - - - 5 1 - - -
Colo. 7 26 - 3 2 1 91 85 - 2 -
N. Mex. 16 31 N N N - 50 92 - - -
Ariz. 8 10 U 1 2 U 27 153 U 1 3
Utah 119 - - 2 11 2 19 22 - - 1
Nev. 5 1 - 15 11 - 27 57 - 1 -
PACIFIC 166 130 3 175 219 42 1,123 682 - 58 26
Wash. 51 19 1 19 10 40 503 219 - 2 1
Oreg. 4 1 - - - 2 33 43 - 1 -
Calif. 41 108 1 127 188 - 557 372 - 52 20
Alaska 63 - - 2 12 - 3 - - - -
Hawaii 7 2 1 27 9 - 27 48 - 3 5
Guam - - U 5 4 U 1 2 U - 1
P.R. 7 3 - 1 2 - 1 1 - - -
V.I. - - U - 3 U - - U - -
Amer. Samoa - - U - - U - - U - -
C.N.M.I. - - U - 1 U - - U - -
------------------------------------------------------------------------------------------------------------------------------------------
N: Not notifiable U: Unavailable -: no reported cases
============================================================================================================================================
Return to top. Table_IV Note: To print large tables and graphs users may have to change their printer settings to landscape and use a small font size.
TABLE IV. Deaths in 121 U.S. cities* week ending
October 12, 1996 (41st Week)
===================================================================================================================================
All Causes, By Age (Years)
------------------------------------------------------------------------ P&I**
Reporting Area All Ages >=65 45-64 25-44 1-24 <1 Total
---------------------------------------------------------------------------------------------------------------
NEW ENGLAND 556 392 113 35 10 6 29
Boston, Mass. 130 89 26 10 3 2 4
Bridgeport, Conn. 40 32 3 4 - 1 1
Cambridge, Mass. 19 14 4 1 - - 3
Fall River, Mass. 34 28 4 1 1 - 1
Hartford, Conn. 54 32 17 2 2 1 3
Lowell, Mass. 17 8 8 1 - - 2
Lynn, Mass. 7 4 3 - - - 1
New Bedford, Mass. 27 19 6 2 - - -
New Haven, Conn. 41 27 8 3 2 1 1
Providence, R.I. 49 37 6 5 1 - 1
Somerville, Mass. 3 2 1 - - - -
Springfield, Mass. 44 30 12 1 1 - 1
Waterbury, Conn. 27 20 4 3 - - 1
Worcester, Mass. 64 50 11 2 - 1 10
MID. ATLANTIC 2,206 1,529 418 193 28 38 102
Albany, N.Y. 49 37 9 2 - 1 2
Allentown, Pa. 19 13 5 1 - - 2
Buffalo, N.Y. 74 51 16 5 1 1 9
Camden, N.J. 28 19 5 4 - - 1
Elizabeth, N.J. 20 15 5 - - - 1
Erie, Pa.*** 33 28 5 - - - 2
Jersey City, N.J. 38 19 11 6 1 1 3
New York City, N.Y. 1,236 831 250 119 17 19 41
Newark, N.J. U U U U U U U
Paterson, N.J. 27 18 5 3 - 1 1
Philadelphia, Pa. 300 207 50 35 6 2 17
Pittsburgh, Pa.*** 52 40 6 3 1 2 1
Reading, Pa. 7 5 1 1 - - 1
Rochester, N.Y. 121 94 19 6 1 1 8
Schenectady, N.Y. 27 22 5 - - - -
Scranton, Pa.*** 35 27 6 2 - - 1
Syracuse, N.Y. 91 73 15 2 - 1 10
Trenton, N.J. 33 18 2 4 - 9 1
Utica, N.Y. 16 12 3 - 1 - 1
Yonkers, N.Y. U U U U U U U
E.N. CENTRAL 1,947 1,287 389 169 63 39 95
Akron, Ohio 50 36 11 1 1 1 -
Canton, Ohio 36 31 5 - - - -
Chicago, Ill. 400 234 88 51 19 8 27
Cincinnati, Ohio 93 59 24 4 4 2 6
Cleveland, Ohio 147 86 40 11 8 2 3
Columbus, Ohio 160 108 35 10 4 3 5
Dayton, Ohio 139 101 21 10 2 5 10
Detroit, Mich. 213 127 41 29 10 6 6
Evansville, Ind. 43 33 6 3 1 - 2
Fort Wayne, Ind. 56 45 5 3 2 1 2
Gary, Ind. 13 9 2 1 1 - 2
Grand Rapids, Mich. 41 29 8 4 - - 3
Indianapolis, Ind. 171 105 40 15 8 3 9
Madison, Wis. U U U U U U U
Milwaukee, Wis. 130 94 20 9 1 6 9
Peoria, Ill. 29 22 6 - 1 - 5
Rockford, Ill. 47 38 9 - - - 1
South Bend, Ind. 46 36 7 3 - - 2
Toledo, Ohio 75 51 13 8 1 2 2
Youngstown, Ohio 58 43 8 7 - - 1
W.N. CENTRAL 637 443 114 39 13 11 37
Des Moines, Iowa U U U U U U U
Duluth, Minn. 14 12 2 - - - 2
Kansas City, Kans. 30 19 7 4 - - 1
Kansas City, Mo. 97 61 15 1 3 - 5
Lincoln, Nebr. 34 27 5 1 - 1 1
Minneapolis, Minn. 147 94 35 11 5 2 13
Omaha, Nebr. 84 65 14 4 - 1 7
St. Louis, Mo. 114 81 18 8 4 3 -
St. Paul, Minn. 62 45 7 6 1 3 7
Wichita, Kans. 55 39 11 4 - 1 1
S. ATLANTIC 1,158 677 285 125 38 32 61
Atlanta, Ga. 134 71 35 20 6 2 8
Baltimore, Md. 196 98 59 29 5 5 17
Charlotte, N.C. 80 52 21 6 1 - 3
Jacksonville, Fla. 130 80 33 7 3 6 8
Miami, Fla. 105 64 16 13 8 4 1
Norfolk, Va. 65 40 17 5 2 1 2
Richmond, Va. 65 34 16 13 - 2 5
Savannah, Ga. 34 21 8 4 1 - 5
St. Petersburg, Fla. 37 30 5 - 2 - 1
Tampa, Fla. 169 104 43 10 1 11 7
Washington, D.C. 126 77 29 12 7 1 4
Wilmington, Del. 17 6 3 6 2 - -
E.S. CENTRAL 749 479 167 62 21 19 62
Birmingham, Ala. 130 75 28 15 5 7 4
Chattanooga, Tenn. 78 50 18 5 2 3 7
Knoxville, Tenn. 65 43 14 5 3 - 4
Lexington, Ky. 42 22 12 3 2 3 3
Memphis, Tenn. 220 142 48 21 6 3 24
Mobile, Ala. 46 22 15 5 - 3 1
Montgomery, Ala. 28 21 5 2 - - -
Nashville, Tenn. 140 104 27 6 3 - 19
W.S. CENTRAL 1,369 888 264 146 43 28 82
Austin, Tex. 64 45 13 5 - 1 3
Baton Rouge, La. 51 32 9 8 - 2 2
Corpus Christi, Tex. 53 36 11 2 2 2 3
Dallas, Tex. 180 111 31 29 7 2 4
El Paso, Tex. 87 59 12 10 1 5 7
Ft. Worth, Tex. 84 56 16 6 5 1 2
Houston, Tex. 355 220 79 42 9 5 25
Little Rock, Ark. 65 47 14 - 3 1 3
New Orleans, La. 90 49 19 18 3 1 -
San Antonio, Tex. 183 127 32 15 8 1 23
Shreveport, La. 51 29 13 4 2 3 3
Tulsa, Okla. 106 77 15 7 3 4 7
MOUNTAIN 871 591 159 75 21 24 56
Albuquerque, N.M. 104 75 18 7 3 1 3
Colo. Springs, Colo. 46 35 4 4 2 1 4
Denver, Colo. 119 73 21 13 2 10 8
Las Vegas, Nev. 157 98 44 11 3 1 8
Ogden, Utah 21 16 4 1 - - -
Phoenix, Ariz. 180 113 31 23 5 7 10
Pueblo, Colo. 22 17 4 - 1 - 2
Salt Lake City, Utah 104 76 13 10 4 1 11
Tucson, Ariz. 118 88 20 6 1 3 10
PACIFIC 925 632 151 93 24 25 66
Berkeley, Calif. 15 10 2 2 1 - 1
Fresno, Calif. 58 38 8 3 6 3 1
Glendale, Calif. U U U U U U U
Honolulu, Hawaii 69 54 7 5 - 3 6
Long Beach, Calif. 81 51 17 9 3 1 7
Los Angeles, Calif. U U U U U U U
Pasadena, Calif. U U U U U U U
Portland, Oreg. 116 71 24 15 2 4 1
Sacramento, Calif. U U U U U U U
San Diego, Calif. 135 98 20 11 4 2 12
San Francisco, Calif. 145 90 27 23 2 3 16
San Jose, Calif. U U U U U U U
Santa Cruz, Calif. 40 30 5 4 1 - 6
Seattle, Wash. 114 80 16 13 2 3 4
Spokane, Wash. 63 50 9 2 1 1 6
Tacoma, Wash. 89 60 16 6 2 5 6
TOTAL 10,418**** 6,918 2,060 937 261 222 590
---------------------------------------------------------------------------------------------------------------
U: Unavailable -: no reported cases
* Mortality data in this table are voluntarily reported from 121 cities in the United States, most of which have populations
of 100,000 or more. A death is reported by the place of its occurrence and by the week that the death certificate was
filed. Fetal deaths are not included.
** Pneumonia and influenza.
*** Because of changes in reporting methods in these 3 Pennsylvania cities, these numbers are partial counts for the current
week. Complete counts will be available in 4 to 6 weeks.
**** Total includes unknown ages.
===================================================================================================================================
Return to top. Disclaimer All MMWR HTML versions of articles are electronic conversions from ASCII text into HTML. This conversion may have resulted in character translation or format errors in the HTML version. Users should not rely on this HTML document, but are referred to the electronic PDF version and/or the original MMWR paper copy for the official text, figures, and tables. An original paper copy of this issue can be obtained from the Superintendent of Documents, U.S. Government Printing Office (GPO), Washington, DC 20402-9371; telephone: (202) 512-1800. Contact GPO for current prices. **Questions or messages regarding errors in formatting should be addressed to mmwrq@cdc.gov.Page converted: 09/19/98 |
|||||||||
This page last reviewed 5/2/01
|