 |
|
|
|
|
|
|
| ||||||||||
|
|
|
|
|
|
|
||||
| ||||||||||
|
|
|
|
|
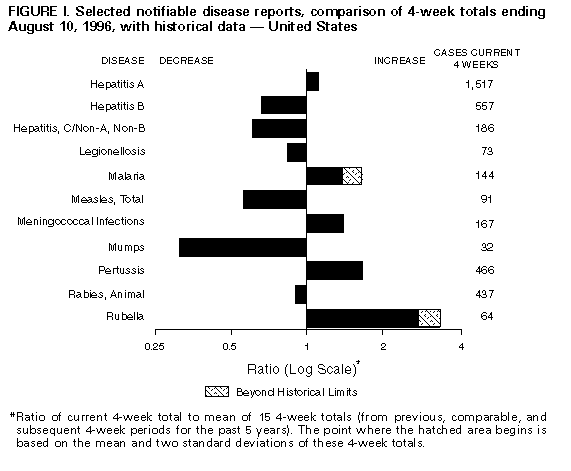
Persons using assistive technology might not be able to fully access information in this file. For assistance, please send e-mail to: mmwrq@cdc.gov. Type 508 Accommodation and the title of the report in the subject line of e-mail. Notifiable Diseases/Deaths in Selected Cities Weekly InformationFigure_I Selected notifiable disease reports, comparison of 4-week totals ending August 10, 1996, with historical data -- United States Table_I Summary -- cases of selected notifiable diseases, United States, cumulative, week ending August 10, 1996 (32nd Week) Table_II Cases of selected notifiable diseases, United States, weeks ending August 10, 1996 and August 12, 1995 (32nd Week) Table_III Cases of selected notifiable diseases preventable by vaccination, United States, weeks ending August 10, 1996 and August 12, 1995 (32nd Week) Table_IV Deaths in 121 U.S. cities, week ending
August 10, 1996 (32nd Week)
TABLE I. Summary -- cases of specified notifiable diseases, United States,
cumulative, week ending August 10, 1996 (32nd Week)
==================================================================================
                                             Cum. 1996
------------------------------------------------------
Anthrax                                              -
Brucellosis                                         53
Cholera                                              2
Congenital rubella syndrome                          1
Cryptosporidiosis*                               1,075
Diphtheria                                           1
Encephalitis:  California*                          16
               eastern equine*                       2
               St. Louis*                            -
               western equine*                       -
Hansen Disease                                      63
Hantavirus pulmonary syndrome*+                      9
HIV infection, pediatric*&                         170
Plague                                               -
Poliomyelitis, paralytic@                            -
Psittacosis                                         22
Rabies, human                                        -
Rocky Mountain spotted fever (RMSF)                357
Streptococcal toxic-shock syndrome*                 10
Syphilis, congenital**                               -
Tetanus                                             17
Toxic-shock syndrome                                89
Trichinosis                                         14
Typhoid fever                                      200
------------------------------------------------------
 * Not notifiable in all states
 + Updated weekly from reports to the Division of Viral and Rickettsial
   Diseases, National Center for Infectious Diseases (NCID).
 & Updated monthly to the Division of HIV/AIDS Prevention, National Center
   for HIV, STD, and TB Prevention (NCHSTP), last update July 30, 1996.
 @ Three suspected cases of polio with onset in 1996 have been reported to date.
** Updated quarterly from reports to the Division of STD Prevention,
   NCHSTP. First quarter 1996 is not yet available.
-: no reported cases
==================================================================================
Return to top. Table_II Note: To print large tables and graphs users may have to change their printer settings to landscape and use a small font size.
TABLE II. (page 1) Cases of selected notifiable diseases, United States, weeks ending
August 10, 1996, and August 12, 1995 (32nd Week)
Escherichia
coli O157:H7
------------------- Hepatitis
AIDS* Chlamydia NETSS** PHLIS*** Gonorrhea C\NA,NB Legionellosis
----------------- --------- -------- -------- ------------------- ---------------- -----------------
Reporting Area Cum. Cum. Cum. Cum. Cum. Cum. Cum. Cum. Cum. Cum. Cum.
1996 1995 1996 1996 1996 1996 1995 1996 1995 1996 1995
------------------------------------------------------------------------------------------------------------------------------------------
UNITED STATES 39,982 42,926 200,725 1,220 560 171,884 238,200 2,118 2,418 472 733
NEW ENGLAND 1,589 2,182 10,662 177 33 4,480 4,582 72 81 25 15
Maine 29 75 547 16 - 29 52 - - 1 4
N.H. 50 70 397 19 12 80 71 6 12 - 1
Vt. 14 21 - 12 11 37 34 27 7 3 -
Mass. 740 996 4,068 79 10 1,346 1,647 33 58 14 9
R.I. 113 144 1,237 8 - 314 304 6 4 7 1
Conn. 643 876 4,413 43 - 2,674 2,474 - - N N
MID. ATLANTIC 11,159 11,231 23,236 115 34 17,736 27,041 186 266 101 121
Upstate N.Y. 1,378 1,439 N 76 12 3,694 5,854 152 134 36 32
N.Y. City 6,277 5,655 9,512 6 - 4,931 10,942 1 1 3 3
N.J. 2,130 2,745 2,482 33 5 2,853 2,226 - 107 8 19
Pa. 1,374 1,392 11,242 N 17 6,258 8,019 33 24 54 67
E.N. CENTRAL 3,225 3,350 25,882 291 132 25,813 47,684 294 196 131 212
Ohio 696 723 11,986 75 36 8,836 14,972 22 7 55 98
Ind. 433 335 6,187 32 23 4,041 5,703 7 1 29 49
Ill. 1,397 1,394 2,502 130 16 10,486 11,960 46 58 9 22
Mich. 528 668 U 54 38 U 10,992 219 130 29 21
Wis. 171 230 5,207 N 19 2,450 4,057 - - 9 22
W.N. CENTRAL 935 1,017 14,527 268 163 7,091 12,345 80 48 26 49
Minn. 170 218 - 101 94 U 1,890 1 2 3 -
Iowa 63 54 2,588 66 50 663 798 40 8 6 16
Mo. 469 472 7,640 38 - 4,927 7,049 21 15 6 13
N. Dak. 10 4 2 9 7 1 17 - 4 - 3
S. Dak. 8 9 689 9 - 95 120 - 1 2 -
Nebr. 65 75 898 21 3 161 707 4 10 7 11
Kans. 150 185 2,710 24 9 1,244 1,764 14 8 2 6
S. ATLANTIC 9,735 10,759 32,946 64 34 59,226 65,849 147 149 86 115
Del. 193 219 1,148 - 1 875 1,303 1 - 8 2
Md. 1,149 1,416 3,813 N 5 8,127 7,471 1 6 15 20
D.C. 638 640 N - - 2,758 2,732 - - 6 4
Va. 647 880 6,532 N 16 5,800 6,437 8 9 13 11
W. Va. 73 62 1 N 2 313 470 7 36 1 3
N.C. 539 587 - 17 7 11,263 14,920 30 36 6 25
S.C. 500 569 - 6 3 6,743 7,710 17 15 4 21
Ga. 1,421 1,459 7,137 20 - 12,366 12,269 U 15 3 14
Fla. 4,575 4,927 14,315 14 - 10,981 12,537 83 32 30 15
E.S. CENTRAL 1,311 1,391 18,268 32 29 19,564 24,817 394 699 31 44
Ky. 212 179 4,083 7 4 2,518 2,825 20 22 3 8
Tenn. 497 561 7,998 13 22 6,924 8,379 303 675 15 21
Ala. 365 375 5,289 8 3 8,515 10,290 4 2 3 5
Miss. 237 276 U 4 - 1,607 3,323 67 U 10 10
W.S. CENTRAL 3,970 3,694 29,081 35 9 21,281 33,400 288 168 15 13
Ark. 170 166 - 11 3 2,263 3,089 3 4 - 5
La. 923 602 4,264 5 3 4,717 7,465 130 104 1 2
Okla. 165 173 4,703 6 1 2,926 3,343 69 30 4 3
Tex. 2,712 2,753 20,114 13 2 11,375 19,503 86 30 10 3
MOUNTAIN 1,198 1,330 9,673 91 48 4,480 5,578 396 289 24 87
Mont. 22 14 - 12 - 17 43 12 10 1 4
Idaho 25 31 944 20 5 67 86 88 34 - 2
Wyo. 3 10 350 - 2 16 33 122 120 3 8
Colo. 335 454 - 34 21 1,077 1,797 35 42 7 33
N. Mex. 114 111 U 5 - 540 636 42 35 1 4
Ariz. 342 350 3,934 N 13 2,287 2,024 44 24 8 7
Utah 117 87 921 12 - 182 136 44 10 2 12
Nev. 240 273 1,031 8 7 294 823 9 14 2 17
PACIFIC 6,859 7,972 36,450 147 78 12,213 16,904 261 522 33 77
Wash. 447 576 5,859 31 5 1,282 1,575 36 133 3 15
Oreg. 311 275 U 47 29 331 468 4 33 - -
Calif. 5,964 6,910 25,872 66 36 10,105 14,059 99 346 28 57
Alaska 16 50 680 3 2 264 425 2 1 1 -
Hawaii 121 161 780 N 6 231 377 120 9 1 5
Guam 4 - 168 N - 31 77 1 4 2 1
P.R. 1,352 1,692 N 12 U 157 363 71 141 - -
V.I. 16 25 N N U - - - - - -
Amer. Samoa - - - N U - 15 - - - -
C.N.M.I. 1 - N N U 11 32 - 5 - -
------------------------------------------------------------------------------------------------------------------------------------------
N: Not notifiable U: Unavailable -: no reported cases C.N.M.I.: Commonwealth of North Mariana Islands
* Updated monthly to the Division of HIV/AIDS Prevention, National Center for HIV, STD, and TB Prevention, last update July 30, 1996.
** National Electronic Telecommunications System for Surveillance.
*** Public Health Laboratory Information System.
=======================================================================================================================================================
TABLE II. (page 2) Cases of selected notifiable diseases, United States, weeks ending
August 10, 1996, and August 12, 1995 (32nd Week)
Meningococcal Syphilis
Lyme Malaria Disease (Primary & Secondary) Tuberculosis Rabies, Animal
---------------- ---------------- ---------------- --------------------- ----------------- ----------------
Reporting Area Cum. Cum. Cum. Cum. Cum. Cum. Cum. Cum. Cum. Cum. Cum. Cum.
1996 1995 1996 1995 1996 1995 1996 1995 1996 1995 1996 1995
-----------------------------------------------------------------------------------------------------------------------------------------------------
UNITED STATES 5,310 6,015 794 705 2,216 2,073 6,663 9,988 11,118 12,242 3,413 4,862
NEW ENGLAND 1,817 1,221 33 29 96 96 109 230 242 295 425 988
Maine 13 10 6 3 12 6 - 2 4 11 56 21
N.H. 21 18 1 1 3 16 1 1 8 9 41 109
Vt. 9 7 2 1 3 6 - - 1 2 106 123
Mass. 103 70 11 9 36 33 50 39 113 162 65 314
R.I. 204 189 5 3 10 4 1 2 24 28 30 195
Conn. 1,467 927 8 12 32 31 57 186 92 83 127 226
MID. ATLANTIC 2,935 3,883 181 190 196 268 259 533 1,936 2,642 448 1,262
Upstate N.Y. 1,863 1,908 52 37 59 74 47 54 234 298 241 742
N.Y. City 182 292 91 94 30 36 71 231 1,068 1,518 - -
N.J. 211 1,029 28 45 53 66 77 114 433 442 84 236
Pa. 679 654 10 14 54 92 64 134 201 384 123 284
E.N. CENTRAL 38 253 85 97 300 297 851 1,714 1,200 1,149 40 50
Ohio 25 20 9 6 118 86 310 546 176 161 6 5
Ind. 12 11 9 12 46 41 139 184 112 109 1 9
Ill. 1 13 35 54 77 80 284 678 689 610 7 6
Mich. - 5 22 13 31 54 U 177 161 217 15 22
Wis. U 204 10 12 28 36 118 129 62 52 11 8
W.N. CENTRAL 83 68 27 18 179 123 221 497 298 368 339 242
Minn. 18 5 9 3 23 21 27 29 70 93 18 11
Iowa 16 7 2 2 36 23 13 28 43 44 165 88
Mo. 22 35 7 6 74 46 159 422 127 135 15 23
N. Dak. - - 1 1 3 1 - - 3 3 46 22
S. Dak. - - - 1 8 5 - - 14 13 76 66
Nebr. 1 4 3 3 16 10 6 9 13 17 3 4
Kans. 26 17 5 2 19 17 16 9 28 63 16 28
S. ATLANTIC 272 413 176 135 484 341 2,282 2,522 2,064 2,169 1,686 1,320
Del. 36 30 3 1 2 5 23 8 20 37 43 70
Md. 138 278 39 37 48 29 368 269 186 242 399 265
D.C. 1 2 7 11 8 4 98 73 82 65 8 10
Va. 25 30 24 30 35 45 279 380 178 146 349 253
W. Va. 9 18 3 1 11 8 1 8 40 51 67 77
N.C. 43 35 15 11 58 57 643 709 301 255 438 306
S.C. 3 9 9 - 44 44 254 376 221 204 57 95
Ga. 1 8 16 14 111 66 381 470 395 405 191 175
Fla. 16 3 60 30 167 83 235 229 641 764 134 69
E.S. CENTRAL 42 35 18 12 125 136 1,489 2,002 812 850 133 174
Ky. 8 8 3 1 20 35 83 113 155 186 32 15
Tenn. 16 17 8 4 16 48 525 507 237 280 45 65
Ala. 5 2 3 5 50 29 371 395 269 247 54 90
Miss. 13 8 4 2 39 24 510 987 151 137 2 4
W.S. CENTRAL 70 72 20 17 244 248 1,056 1,966 1,434 1,500 41 495
Ark. 19 6 - 2 28 25 113 301 118 146 14 33
La. 1 3 2 2 45 39 343 657 59 148 13 22
Okla. 5 28 - 1 23 25 123 116 116 128 14 26
Tex. 45 35 18 12 148 159 477 892 1,141 1,078 U 414
MOUNTAIN 5 6 35 39 123 153 89 147 350 395 81 91
Mont. - - 5 3 4 2 - 4 14 10 15 30
Idaho 2 - - 1 19 7 2 - 6 8 - -
Wyo. 2 3 3 - 3 5 2 - 3 1 20 21
Colo. - - 16 17 22 40 23 85 45 37 22 -
N. Mex. - 1 1 4 21 29 1 5 52 56 3 3
Ariz. - - 4 6 33 45 56 21 146 194 16 27
Utah 1 - 4 5 12 12 2 4 34 19 2 7
Nev. - 2 2 3 9 13 3 28 50 70 3 3
PACIFIC 48 64 219 168 469 411 307 377 2,782 2,874 220 240
Wash. 5 4 13 14 67 69 4 10 144 167 - 4
Oreg. 9 9 15 11 82 73 8 18 57 74 - 1
Calif. 33 51 182 132 312 259 294 348 2,436 2,477 212 228
Alaska - - 3 1 5 6 - 1 43 47 8 7
Hawaii 1 - 6 10 3 4 1 - 102 109 - -
Guam - - - 1 1 2 3 8 35 72 - -
P.R. - - - 1 4 18 81 173 63 120 31 32
V.I. - - - 2 - - - - - - - -
Amer. Samoa - - - - - - - - - 3 - -
C.N.M.I. - - - 1 - - 1 1 - 23 - -
-----------------------------------------------------------------------------------------------------------------------------------------------------
N: Not notifiable U: Unavailable -: no reported cases
=======================================================================================================================================================
Return to top. Table_III Note: To print large tables and graphs users may have to change their printer settings to landscape and use a small font size.
TABLE III. (page 1) Cases of selected notifiable diseases preventable by vaccination, United
States, weeks ending August 10, 1996, and August 12, 1995 (32nd Week)
Hepatitis (Viral), by type Measles (Rubeola)
H. influenzae, --------------------------------------- -------------------------------------
invasive A B Indigenous Imported**
---------------- ----------------- ----------------- --------------- ---------------
Reporting Area Cum. Cum. Cum. Cum. Cum. Cum. Cum. Cum.
1996* 1995 1996 1995 1996 1995 1996 1996 1996 1996
------------------------------------------------------------------------------------------------------------------------------
UNITED STATES 755 747 16,259 17,197 5,706 6,192 37 367 4 29
NEW ENGLAND 20 30 199 163 110 151 - 8 1 4
Maine - 3 13 17 2 6 - - - -
N.H. 8 7 10 7 9 16 - - - -
Vt. 1 2 4 4 10 2 - 1 1 1
Mass. 10 10 103 68 35 56 - 6 - 3
R.I. 1 3 9 20 7 8 - - - -
Conn. - 5 60 47 47 63 - 1 - -
MID. ATLANTIC 117 104 980 1,068 858 875 1 19 - 5
Upstate N.Y. 37 25 265 251 225 227 - - - -
N.Y. City 20 26 378 527 396 288 1 9 - 3
N.J. 36 11 205 146 155 223 - - - -
Pa. 24 42 132 144 82 137 - 10 - 2
E.N. CENTRAL 116 133 1,354 2,052 586 710 - 6 - 3
Ohio 70 68 536 1,166 85 78 - 2 - -
Ind. 7 17 192 98 102 139 - - - -
Ill. 27 30 262 419 129 187 - 2 - 1
Mich. 7 16 264 235 232 256 - 1 - 2
Wis. 5 2 100 134 38 50 - 1 - -
W.N. CENTRAL 33 55 1,314 1,192 260 418 - 17 1 2
Minn. 20 28 77 118 35 33 - 14 1 2
Iowa 5 3 237 61 59 31 - - - -
Mo. 5 17 621 853 127 304 - 2 - -
N. Dak. - - 28 19 - 4 - - - -
S. Dak. 1 1 37 33 - 2 - - - -
Nebr. 1 3 144 31 16 20 - - - -
Kans. 1 3 170 77 23 24 - 1 - -
S. ATLANTIC 176 150 749 691 900 816 - 6 - 5
Del. 2 - 9 8 6 6 - 1 - -
Md. 42 53 127 128 191 161 - 2 - 1
D.C. 5 - 20 16 27 14 - - - -
Va. 6 19 99 118 90 65 - - - 2
W. Va. 6 6 12 12 14 34 - - - -
N.C. 20 24 87 73 227 193 - 3 - 1
S.C. 4 1 37 29 49 33 - - - -
Ga. 72 43 61 50 8 62 - - - 1
Fla. 19 4 297 257 288 248 - - - -
E.S. CENTRAL 19 6 925 1,033 495 566 - - - -
Ky. 4 1 19 33 36 51 - - - -
Tenn. 8 - 628 847 285 441 - - - -
Ala. 6 4 125 55 39 74 - - - -
Miss. 1 1 153 98 135 - - - - -
W.S. CENTRAL 31 39 3,373 2,070 756 735 3 23 - 2
Ark. - 5 314 265 50 34 - - - -
La. 3 1 107 61 75 118 - - - -
Okla. 25 20 1,398 510 59 97 - - - -
Tex. 3 13 1,554 1,234 572 486 3 23 - 2
MOUNTAIN 76 84 2,574 2,604 662 538 33 145 2 5
Mont. - - 80 69 6 16 - - - -
Idaho 1 2 148 225 67 64 - 1 - -
Wyo. 35 4 26 83 29 17 - - - -
Colo. 11 10 278 321 82 78 - 4 - 3
N. Mex. 9 12 271 544 222 198 2 10 - -
Ariz. 9 21 1,031 737 162 85 - 8 - -
Utah 6 9 585 494 65 46 31 117 2 2
Nev. 5 26 155 131 29 34 - 5 - -
PACIFIC 167 146 4,791 6,324 1,079 1,383 - 143 - 3
Wash. 2 8 321 494 60 118 - 45 - -
Oreg. 22 20 562 1,610 39 83 - 4 - -
Calif. 140 114 3,828 4,084 963 1,161 - 30 - 2
Alaska 1 - 30 27 9 9 - 63 - -
Hawaii 2 4 50 109 8 12 - 1 - 1
Guam - - 2 5 - 4 U - U -
P.R. 1 3 61 57 228 377 - 7 - -
V.I. - - - 6 - 12 U - U -
Amer. Samoa - - - 5 - - U - U -
C.N.M.I. 10 11 1 21 5 10 U - U -
------------------------------------------------------------------------------------------------------------------------------
N: Not notifiable U: Unavailable -: no reported cases
* Of 175 cases reported among children aged <5 years, serotype was reported for 37 and of those, 10 were type b.
** For imported measles, cases include only those resulting from importation from other countries.
============================================================================================================================================
TABLE III. (page 2) Cases of selected notifiable diseases preventable by vaccination, United
States, weeks ending August 10, 1996, and August 12, 1995 (32nd Week)
Measles (Rubeola), cont'd.
--------------------------
Total Mumps Pertussis Rubella
-------------------------- -------------------------- --------------------------- ---------------------------
Reporting Area Cum. Cum. Cum. Cum. Cum. Cum. Cum. Cum.
1996 1995 1996 1996 1995 1996 1996 1995 1996 1996 1995
------------------------------------------------------------------------------------------------------------------------------------------
UNITED STATES 396 258 3 397 558 130 2,296 2,095 3 185 92
NEW ENGLAND 12 8 - - 10 9 470 305 - 24 35
Maine - - - - 4 - 18 19 - - -
N.H. - - - - 1 - 40 23 - - 1
Vt. 2 - - - - - 13 41 - 2 -
Mass. 9 2 - - 2 9 394 211 - 20 7
R.I. - 5 - - - - - 1 - - -
Conn. 1 1 - - 3 - 5 10 - 2 27
MID. ATLANTIC 24 11 - 57 82 10 169 168 - 7 12
Upstate N.Y. - 1 - 18 19 3 89 78 - 4 3
N.Y. City 12 5 - 13 9 - 21 27 - 1 7
N.J. - 5 - 2 13 - 5 11 - 2 2
Pa. 12 - - 24 41 7 54 52 - - -
E.N. CENTRAL 9 13 2 74 95 15 225 254 - 3 3
Ohio 2 1 2 32 29 9 110 79 - - -
Ind. - - - 5 7 - 19 18 - - -
Ill. 3 1 - 18 28 5 69 45 - 1 -
Mich. 3 5 - 18 31 1 22 35 - 2 3
Wis. 1 6 - 1 - - 5 77 - - -
W.N. CENTRAL 19 2 - 9 32 34 127 124 - 1 -
Minn. 16 - - 3 2 30 89 42 - - -
Iowa - - - 1 8 - 4 6 - 1 -
Mo. 2 1 - 2 18 1 20 36 - - -
N. Dak. - - - 2 - - 1 6 - - -
S. Dak. - - - - - 1 3 8 - - -
Nebr. - - - - 4 2 6 7 - - -
Kans. 1 1 - 1 - - 4 19 - - -
S. ATLANTIC 11 11 1 65 85 9 290 173 - 89 8
Del. 1 - - - - 1 11 9 - - -
Md. 3 1 - 19 27 6 105 21 - - 1
D.C. - - - - - - - 4 - 1 -
Va. 2 - 1 10 16 - 26 10 - 2 -
W. Va. - - - - - - 2 - - - -
N.C. 4 - - 14 16 - 49 81 - 75 1
S.C. - - - 5 7 1 22 16 - 1 -
Ga. 1 2 - 2 6 - 13 13 - - -
Fla. - 8 - 15 13 1 62 19 - 10 6
E.S. CENTRAL - - - 18 7 2 62 96 1 3 1
Ky. - - - - - - 26 11 - - -
Tenn. - - - 1 - - 17 55 1 1 1
Ala. - - - 3 4 2 12 30 - 2 -
Miss. - - - 14 3 - 7 - N N N
W.S. CENTRAL 25 20 - 16 38 2 59 163 - 2 7
Ark. - 2 - - 5 1 4 27 - - -
La. - 18 - 11 8 - 6 11 - 1 -
Okla. - - - - - - 8 17 - - -
Tex. 25 - - 5 25 1 41 108 - 1 7
MOUNTAIN 150 68 - 22 25 13 242 401 - 6 4
Mont. - - - - 1 1 12 3 - - -
Idaho 1 - - - 2 11 85 85 - 2 -
Wyo. - - - - - - 3 1 - - -
Colo. 7 26 - 2 - 1 64 64 - 2 -
N. Mex. 10 31 N N N - 34 63 - - -
Ariz. 8 10 - 1 2 - 11 146 - 1 3
Utah 119 - - 2 11 - 11 17 - - 1
Nev. 5 1 - 17 9 - 22 22 - 1 -
PACIFIC 146 125 - 136 184 36 652 411 2 50 22
Wash. 45 19 - 18 10 7 235 96 - 1 -
Oreg. 4 1 - - - - 29 27 - 1 -
Calif. 32 103 - 99 158 29 374 250 2 45 18
Alaska 63 - - 2 12 - 2 - - - -
Hawaii 2 2 - 17 4 - 12 38 - 3 4
Guam - - U 5 3 U 1 2 U - 1
P.R. 7 3 - 1 2 - 1 1 - - -
V.I. - - U - 3 U - - U - -
Amer. Samoa - - U - - U - - U - -
C.N.M.I. - - U - - U - - U - -
------------------------------------------------------------------------------------------------------------------------------------------
N: Not notifiable U: Unavailable -: no reported cases
============================================================================================================================================
Return to top. Table_IV Note: To print large tables and graphs users may have to change their printer settings to landscape and use a small font size.
TABLE IV. Deaths in 121 U.S. cities* week ending
August 10, 1996 (32nd Week)
===================================================================================================================================
All Causes, By Age (Years)
------------------------------------------------------------------------ P&I**
Reporting Area All Ages >=65 45-64 25-44 1-24 <1 Total
---------------------------------------------------------------------------------------------------------------
NEW ENGLAND 533 386 82 43 13 9 37
Boston, Mass. 145 94 28 12 6 5 9
Bridgeport, Conn. 38 29 6 1 2 - 2
Cambridge, Mass. 9 9 - - - - -
Fall River, Mass. 18 12 5 1 - - 2
Hartford, Conn. 48 32 7 8 - 1 1
Lowell, Mass. 30 25 4 - 1 - 3
Lynn, Mass. 13 9 2 2 - - -
New Bedford, Mass. 27 24 1 2 - - 2
New Haven, Conn. 49 30 7 8 2 2 3
Providence, R.I. 41 32 6 1 2 - 1
Somerville, Mass. 3 - 2 1 - - -
Springfield, Mass. 37 35 2 - - - 1
Waterbury, Conn. 28 23 3 2 - - 4
Worcester, Mass. 47 32 9 5 - 1 9
MID. ATLANTIC 2,313 1,516 455 259 46 37 101
Albany, N.Y. 45 31 5 6 3 - 3
Allentown, Pa. 15 12 2 1 - - -
Buffalo, N.Y. 85 71 10 2 1 1 3
Camden, N.J. 30 13 11 2 - 4 1
Elizabeth, N.J. 10 5 3 1 - 1 -
Erie, Pa.*** 33 29 4 - - - 3
Jersey City, N.J. 35 22 7 4 2 - 3
New York City, N.Y. 1,152 743 230 144 18 17 24
Newark, N.J. 65 29 21 10 3 2 4
Paterson, N.J. 34 11 9 13 - 1 1
Philadelphia, Pa. 400 250 87 44 15 4 13
Pittsburgh, Pa.*** 46 32 5 5 - 4 5
Reading, Pa. 15 12 - 2 1 - 3
Rochester, N.Y. 139 99 28 9 2 1 19
Schenectady, N.Y. 10 6 3 1 - - 1
Scranton, Pa.*** 25 21 3 1 - - 1
Syracuse, N.Y. 109 84 15 8 1 1 10
Trenton, N.J. 20 11 4 4 - 1 1
Utica, N.Y. 19 16 2 1 - - 1
Yonkers, N.Y. 26 19 6 1 - - 5
E.N. CENTRAL 2,066 1,323 397 191 87 65 106
Akron, Ohio 38 26 10 1 - 1 -
Canton, Ohio 33 28 3 1 - 1 2
Chicago, Ill. 513 275 108 69 30 28 34
Cincinnati, Ohio 147 103 25 14 2 3 10
Cleveland, Ohio 154 97 36 14 6 1 3
Columbus, Ohio 212 136 42 12 13 9 13
Dayton, Ohio 108 68 31 6 2 1 8
Detroit, Mich. 181 97 35 35 11 3 -
Evansville, Ind. 39 30 5 2 1 1 1
Fort Wayne, Ind. 65 46 12 3 4 - 5
Gary, Ind. U U U U U U U
Grand Rapids, Mich. 66 45 10 5 4 2 5
Indianapolis, Ind. 137 96 21 9 9 2 3
Madison, Wis. U U U U U U U
Milwaukee, Wis. 99 64 21 8 1 5 4
Peoria, Ill. 33 24 5 4 - - 3
Rockford, Ill. 45 28 12 2 3 - 4
South Bend, Ind. 52 45 4 2 1 - 4
Toledo, Ohio 95 73 12 2 - 8 6
Youngstown, Ohio 49 42 5 2 - - 1
W.N. CENTRAL 710 486 119 43 26 25 24
Des Moines, Iowa U U U U U U U
Duluth, Minn. 35 26 6 3 - - 2
Kansas City, Kans. 49 37 5 2 3 2 3
Kansas City, Mo. 108 60 23 10 1 3 8
Lincoln, Nebr. 26 19 4 1 1 1 -
Minneapolis, Minn. 131 95 19 8 4 5 6
Omaha, Nebr. 73 58 9 2 2 2 2
St. Louis, Mo. 117 77 23 6 4 7 -
St. Paul, Minn. 58 46 8 3 1 - 2
Wichita, Kans. 113 68 22 8 10 5 1
S. ATLANTIC 1,388 821 307 176 46 36 60
Atlanta, Ga. 176 92 49 21 7 7 1
Baltimore, Md. 272 158 55 42 8 9 26
Charlotte, N.C. 67 47 9 7 2 2 3
Jacksonville, Fla. 116 72 22 19 3 - 2
Miami, Fla. 116 70 25 15 3 3 2
Norfolk, Va. 52 30 12 3 4 3 3
Richmond, Va. 67 42 16 6 1 1 3
Savannah, Ga. 38 27 6 4 1 - 3
St. Petersburg, Fla. 36 27 9 - - - -
Tampa, Fla. 159 104 33 17 2 2 11
Washington, D.C. 273 146 61 42 15 9 6
Wilmington, Del. 16 6 10 - - - -
E.S. CENTRAL 774 497 171 60 21 23 59
Birmingham, Ala. 103 59 26 7 4 5 4
Chattanooga, Tenn. 92 60 21 6 1 4 8
Knoxville, Tenn. 94 73 12 4 5 - 11
Lexington, Ky. 69 39 21 5 - 4 4
Memphis, Tenn. 182 123 42 12 5 - 22
Mobile, Ala. 77 46 15 8 4 4 4
Montgomery, Ala. 28 16 8 2 1 1 -
Nashville, Tenn. 129 81 26 16 1 5 6
W.S. CENTRAL 1,458 948 280 146 44 40 75
Austin, Tex. 53 38 7 5 2 1 5
Baton Rouge, La. 60 38 10 10 2 - 3
Corpus Christi, Tex. 59 37 16 5 1 - 3
Dallas, Tex. 178 105 30 29 4 10 4
El Paso, Tex. 77 55 14 4 3 1 5
Ft. Worth, Tex. 121 75 23 15 5 3 -
Houston, Tex. 322 212 67 27 9 7 29
Little Rock, Ark. 66 47 12 4 2 1 2
New Orleans, La. 138 93 23 17 3 2 -
San Antonio, Tex. 180 118 34 15 8 5 8
Shreveport, La. 94 62 19 6 3 4 12
Tulsa, Okla. 110 68 25 9 2 6 4
MOUNTAIN 873 597 153 74 32 15 54
Albuquerque, N.M. 89 69 12 7 1 - -
Colo. Springs, Colo. 53 38 9 4 2 - 4
Denver, Colo. 106 80 10 12 2 2 10
Las Vegas, Nev. 155 104 26 12 9 3 5
Ogden, Utah 29 22 2 3 2 - 1
Phoenix, Ariz. 207 119 52 22 8 5 14
Pueblo, Colo. 20 19 - 1 - - 4
Salt Lake City, Utah 95 56 20 9 5 5 6
Tucson, Ariz. 119 90 22 4 3 - 10
PACIFIC 1,703 1,137 320 156 44 43 155
Berkeley, Calif. 16 9 4 1 1 1 -
Fresno, Calif. 82 49 14 9 6 3 9
Glendale, Calif. 17 13 2 2 - - 1
Honolulu, Hawaii 74 53 14 5 2 - 11
Long Beach, Calif. 64 43 13 5 3 - 15
Los Angeles, Calif. 340 232 72 25 7 4 17
Pasadena, Calif. 32 19 6 3 - 4 4
Portland, Oreg. 123 90 16 9 6 2 4
Sacramento, Calif. 153 106 28 14 3 2 22
San Diego, Calif. 136 85 21 14 7 9 17
San Francisco, Calif. 144 87 30 21 1 3 21
San Jose, Calif. 167 110 37 12 1 7 15
Santa Cruz, Calif. 21 14 4 3 - - 2
Seattle, Wash. 154 97 27 24 3 3 3
Spokane, Wash. 67 45 15 3 1 3 5
Tacoma, Wash. 113 85 17 6 3 2 9
TOTAL 11,818**** 7,711 2,284 1,148 359 293 671
---------------------------------------------------------------------------------------------------------------
U: Unavailable -: no reported cases
* Mortality data in this table are voluntarily reported from 121 cities in the United States, most of which have populations
of 100,000 or more. A death is reported by the place of its occurrence and by the week that the death certificate was
filed. Fetal deaths are not included.
** Pneumonia and influenza.
*** Because of changes in reporting methods in these 3 Pennsylvania cities, these numbers are partial counts for the current
week. Complete counts will be available in 4 to 6 weeks.
**** Total includes unknown ages.
===================================================================================================================================
Return to top. Disclaimer All MMWR HTML versions of articles are electronic conversions from ASCII text into HTML. This conversion may have resulted in character translation or format errors in the HTML version. Users should not rely on this HTML document, but are referred to the electronic PDF version and/or the original MMWR paper copy for the official text, figures, and tables. An original paper copy of this issue can be obtained from the Superintendent of Documents, U.S. Government Printing Office (GPO), Washington, DC 20402-9371; telephone: (202) 512-1800. Contact GPO for current prices. **Questions or messages regarding errors in formatting should be addressed to mmwrq@cdc.gov.Page converted: 09/19/98 |
|||||||||
This page last reviewed 5/2/01
|