 |
|
|
|
|
|
|
| ||||||||||
|
|
|
|
|
|
|
||||
| ||||||||||
|
|
|
|
|
Persons using assistive technology might not be able to fully access information in this file. For assistance, please send e-mail to: mmwrq@cdc.gov. Type 508 Accommodation and the title of the report in the subject line of e-mail. Clinical Laboratory Performance on Proficiency Testing Samples -- United States, 1994Regulation of laboratory testing for human health is mandated by law in the United States; the most recently enacted regulatory law is the Clinical Laboratory Improvement Amendments of 1988 (CLIA) *. In accordance with this law, as of August 1995, a total of 154,721 laboratories ** had registered with the Health Care Financing Administration (HCFA), which is responsible for implementing the CLIA regulations. Of these laboratories, only 11% were subject to the federal laboratory practice regulations that existed before the enactment of CLIA. Under CLIA regulations, all laboratories were required to begin participation in a U.S. Department of Health and Human Services (DHHS)-approved proficiency testing (PT) program by January 1, 1994, for a prescribed group of tests (e.g., hematocrit), analytes (e.g., glucose), and testing specialties (e.g., bacteriology) if performed routinely. This report summarizes an assessment of the performance of laboratories participating in PT programs with a certificate of registration from HCFA *** in 1994 (n=40,711) and indicates that physician office laboratories (POLs) and other newly regulated testing sites (OTSs) had higher rates of unsatisfactory PT performance than previously regulated hospital and independent laboratories (HIs). Laboratories participating in PT receive simulated patient specimens, test the specimens, and report their results back to the PT program. Participants receive notification of the accuracy of their test results from the PT program after results from all participant laboratories are evaluated. Three times a year, CLIA-regulated laboratories that perform certain moderate- or high-complexity assays for regulated tests, analytes, and testing specialties submit results from PT challenges to either HCFA or their accrediting organizations. For this analysis, data are presented for the 17,058 laboratories enrolled in the seven largest DHHS-approved PT programs **** and whose PT results were reported to HCFA in compliance with their certificates of registration. These laboratories represent 42% of all laboratories whose PT performance is monitored by HCFA. PT scores were merged with the HCFA Online Survey, Certification, and Reporting (OSCAR) administrative data set to create three groups by laboratory type: HIs, POLs, and OTSs. Satisfactory and unsatisfactory PT performance ratings were calculated for the three study groups according to CLIA criteria. ***** Chi-square test statistics and logit odds ratios were calculated for each analyte using SAS statistical software. In 1994, of the 154,721 laboratories in the United States, 57% were POLs, and 10% were HIs; the 33% OTSs were a combination of 20 other types (e.g., ambulatory surgery centers, community clinics, comprehensive outpatient rehabilitation facilities, ancillary testing sites in a health-care facility, end-stage renal disease dialysis facilities, and health fairs). In this analysis, the OTS group is considered as a unit because these laboratories previously had not been subject to federal regulatory oversight. ****** In 1994, the 17,058 laboratories in this sample reported to HCFA approximately 1.2 million PT scores. The distribution of the reporting laboratories among the HI, POL, and OTS study groups was 43%, 36%, and 21%, respectively. Rates of overall satisfactory event performance for all regulated tests, analytes, and specialties for the three groups were 97% for the HIs; 89% for the POLs; and 94% for the OTSs. Data were analyzed for the 10 most common tests, analytes, or testing specialties performed by POLs. PT failure rates ranged from 1.2%-5.3% for the HIs, 4.1%-15.9% for the POLs, and 2.1%-11.6% for the OTSs (Figure_1). Compared with HIs, logit odds ratios of unsatisfactory PT performance for the 10 most common tests, analytes, and specialties ranged from 2.4 to 6.0 for the POLs and from 1.4 to 3.6 for the OTSs (Table_1). In addition, odds ratios were calculated for the next 10 tests, analytes, and specialties most commonly performed in POLs (creatinine, potassium, white blood cell count, aspartate aminotransferase, alanine aminotransferase, white blood cell differential, total bilirubin, platelet count, alkaline phosphatase, and prothrombin time). All odds ratios were greater than 1.0, and the odds ratios for POLs were consistently higher than for OTSs. Reported by: Laboratory Practice Assessment Br, Div of Laboratory Systems, Public Health Practice Program Office, CDC. Editorial NoteEditorial Note: Personnel, quality-control and quality-assurance standards, and PT comprise the basis for the CLIA regulatory model, with PT serving as the surrogate laboratory-performance measure. PT performance is a useful indicator of the quality of a laboratory's analytic performance on patient samples and may reflect the quality of routine testing (1). Previous assessments have established the usefulness of PT for identifying laboratories with performance deficiencies and specific analytic testing problems and for providing standards for laboratory improvement in test performance (2). Performance levels have been directly related to experience with PT (3-5), and satisfactory laboratory performance has been associated with the number of patient samples routinely tested, daily quality control, and participation in a PT program (6). In this report, PT failure rates for the POL and OTS groups were higher than those for the HI group, possibly reflecting lack of laboratory practice expertise or experience with PT. For example, some OTS laboratories may perform complex tests more consistent with the functions of a traditional, previously regulated laboratory, while others perform tests more consistent with those of a previously unregulated POL. The findings in this report are subject to at least three limitations. First, although this assessment included results from the two largest DHHS-approved PT programs (the American Association of Bioanalysts and the College of American Pathologists), the findings may not be representative because scores from all DHHS-approved PT programs were not available for analysis. Second, because processing of PT samples differs from the routine processing of patient samples, PT performance cannot directly assess the reliability of some important preanalytic and postanalytic steps. Finally, the relation between PT performance and overall daily laboratory performance is complex. Although PT is sensitive to poor daily laboratory performance, some false positives occur. Therefore, poor PT performance may be attributable to human errors in processing PT samples or in reporting the results rather than poor analytic technique. Most deficiencies in PT are the result of methodologic or technical problems (7). Participation in PT can assist in alerting laboratories to potential problems in testing and provides opportunities for corrective action. Monitoring and disseminating information about trends in PT performance during the ongoing implementation of the CLIA regulations can assist individual laboratories in assessing their performance relative to other laboratories. In addition, PT performance trends can be used by public and private laboratory professional organizations to plan training and educational programs for improving the quality of clinical laboratory testing. References
* Public Law 100-578 (42 USC 201 note). ** Data were obtained in August 1995 from the Health Care Financing Administration Online Survey, Certification, and Reporting (OSCAR) database. *** CLIA regulations allow laboratories and testing sites to select monitoring of their PT performance by either HCFA or a DHHS-approved accrediting body. Those laboratories and testing sites that choose to have HCFA monitor their PT performance are issued a certificate of registration. Those laboratories and testing sites that choose to have an approved accrediting body monitor their PT performance are issued a certificate of accreditation from HCFA. **** The American Academy of Family Physicians, the American Academy of Pediatrics, the American Association of Bioanalysts, the American Osteopathic Association, the College of American Pathologists, the External Comparative Evaluation, and the Medical Laboratory Evaluation program sponsored by the American Society for Internal Medicine. ***** Failure to attain an overall testing event score of at least 80% is considered unsatisfactory performance for all specialties and subspecialties with the following exceptions: gynecologic cytology (90%), ABO group and D (Rho) typing (100%), and compatibility testing (100%). * ***** Before passage of the CLIA legislation in 1988, some states (California, Florida, Idaho, Maryland, Massachusetts, Michigan, Nevada, New Jersey, Oregon, Pennsylvania, West Virginia, Wisconsin, and Wyoming) enacted regulatory legislation that encompassed some alternative testing sites; requirements varied by state. Most of these laws (except in California, Idaho, and Pennsylvania) exempted most POLs from regulation. Figure_1 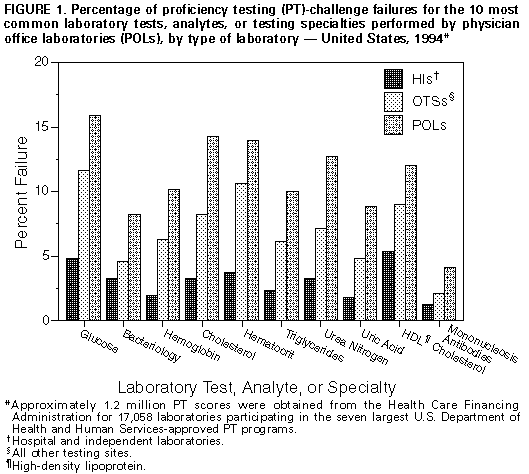 Return to top. Table_1 Note: To print large tables and graphs users may have to change their printer settings to landscape and use a small font size.
TABLE 1. Odds ratios of unsatisfactory proficiency testing performance for
POLs * and OTSs + compared with HIs & for the 10 most common tests, analytes,
or testing specialties performed by POLs -- United States, 1994
==============================================================================
                                POLs                      OTSs
Test, analyte         ------------------------    ----------------------------
  or specialty        Odds ratio    (95% CI @)    Odds ratio    (95% CI)
------------------------------------------------------------------------------
Glucose                   3.8       (3.4-4.1)        2.6      (2.3-2.9)
Bacteriology              2.7       (2.4-3.0)        1.4      (1.2-1.7)
Hemoglobin                6.0       (5.3-6.8)        3.6      (3.1-4.2)
Cholesterol               4.9       (4.4-5.5)        2.6      (2.3-3.1)
Hematocrit                4.2       (3.9-4.7)        3.1      (2.7-3.4)
Triglycerides             4.8       (4.2-5.5)        2.8      (2.3-3.4)
Urea nitrogen             4.2       (3.8-4.7)        2.2      (1.9-2.6)
Uric acid                 5.3       (4.6-6.1)        2.8      (2.2-3.5)
High-density lipoprotein
 cholesterol              2.4       (2.2-2.7)        1.8      (1.5-2.1)
Mononucleosis antibodies  3.7       (3.0-4.6)        1.8      (1.3-2.4)
------------------------------------------------------------------------------
* Physician office laboratories.
+ All other testing sites.
& Hospital and independent laboratories.
@ Confidence interval.
==============================================================================
Return to top. Disclaimer All MMWR HTML versions of articles are electronic conversions from ASCII text into HTML. This conversion may have resulted in character translation or format errors in the HTML version. Users should not rely on this HTML document, but are referred to the electronic PDF version and/or the original MMWR paper copy for the official text, figures, and tables. An original paper copy of this issue can be obtained from the Superintendent of Documents, U.S. Government Printing Office (GPO), Washington, DC 20402-9371; telephone: (202) 512-1800. Contact GPO for current prices. **Questions or messages regarding errors in formatting should be addressed to mmwrq@cdc.gov.Page converted: 09/19/98 |
|||||||||
This page last reviewed 5/2/01
|