 |
|
|
|
|
|
|
| ||||||||||
|
|
|
|
|
|
|
||||
| ||||||||||
|
|
|
|
|
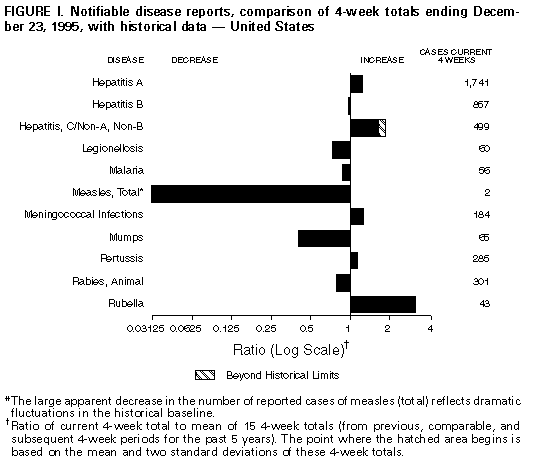
Persons using assistive technology might not be able to fully access information in this file. For assistance, please send e-mail to: mmwrq@cdc.gov. Type 508 Accommodation and the title of the report in the subject line of e-mail. Notifiable Diseases/Deaths in Selected Cities Weekly InformationFigure_I Notifiable disease reports, comparison of 4-week totals ending December 23, 1995, with historical data -- United States Table_I Summary -- cases of specified notifiable diseases, United States, cumulative, week ending December 23, 1995 (51st Week) Table_II Cases of selected notifiable diseases, United States, weeks ending December 23, 1995 and December 24, 1994 (51st Week) Table_III Deaths in 121 U.S. cities, week ending
December 23, 1995 (51st Week)
TABLE I. Summary -- cases of specified notifiable diseases, United States,
cumulative, week ending December 23, 1995 (51st Week)
============================================================================
                                             Cum. 1995
------------------------------------------------------
Anthrax                                              -
Brucellosis                                         87
Cholera                                             16
Congenital rubella syndrome                          7
Diphtheria                                           -
Haemophilus influenzae*                          1,139
Hansen Disease                                     135
Plague                                               7
Poliomyelitis, Paralytic                             -
Psittacosis                                         67
Rabies, human                                        2
Rocky Mountain Spotted Fever                       572
Syphilis, congenital, age less than 1 year**       469
Tetanus                                             33
Toxic shock syndrome                               179
Trichinosis                                         27
Typhoid fever                                      324
------------------------------------------------------
 * Of 1,108 cases of known age, 266 (24) were reported among children
   less than 5 years of age.
** Updated quarterly from reports to the Division of STD Prevention,
   National Center for Prevention Services. This total through third
   quarter 1995.
-: no reported cases
============================================================================
Return to top. Table_II Note: To print large tables and graphs users may have to change their printer settings to landscape and use a small font size.
TABLE II. (page 1) Cases of selected notifiable diseases, United States, weeks ending
December 23, 1995, and December 24, 1994 (51st Week)
Hepatitis (Viral), by type
--------------------------------------------------------------
AIDS* Gonorrhea A B C/NA,NB Legionellosis
------ ------------------- ----------------- ----------------- ---------------- ----------------
Reporting Area Cum. Cum. Cum. Cum. Cum. Cum. Cum. Cum. Cum. Cum. Cum.
1995 1995 1994 1995 1994 1995 1994 1995 1994 1995 1994
------------------------------------------------------------------------------------------------------------------------------------------
UNITED STATES 65,705 341,288 397,271 28,470 25,056 9,873 11,357 4,305 3,993 1,152 1,507
NEW ENGLAND 3,119 6,230 8,253 310 284 206 328 125 146 39 75
Maine 81 87 91 30 24 12 11 - - 6 5
N.H. 87 112 107 11 17 21 27 15 11 2 -
Vt. 30 69 35 6 14 5 12 10 16 1 1
Mass. 1,339 2,803 3,182 142 104 93 178 93 99 23 52
R.I. 214 537 463 35 29 9 8 7 20 7 17
Conn. 1,368 2,622 4,375 86 96 66 92 - - N N
MID. ATLANTIC 17,668 33,675 44,696 1,736 1,705 1,263 1,534 477 457 191 254
Upstate N.Y. 2,127 3,852 10,662 478 521 393 364 263 212 55 60
N.Y. City 9,225 11,818 15,808 779 679 386 398 1 4 5 7
N.J. 4,158 5,592 5,089 267 294 305 385 172 198 31 47
Pa. 2,158 12,413 13,137 212 211 179 387 41 43 100 140
E.N. CENTRAL 4,940 71,046 81,811 3,007 2,706 1,068 1,210 350 318 327 427
Ohio 1,017 19,483 23,323 1,756 1,153 111 163 15 24 150 192
Ind. 499 8,223 9,130 187 361 266 214 21 9 85 47
Ill. 2,054 20,443 24,163 526 605 230 309 72 80 27 43
Mich. 1,039 17,521 17,502 362 348 398 430 242 205 35 82
Wis. 331 5,376 7,693 176 239 63 94 - - 30 63
W.N. CENTRAL 1,555 18,732 22,275 1,831 1,179 598 672 129 94 112 103
Minn. 347 2,821 3,412 180 233 64 64 4 17 6 3
Iowa 94 1,475 1,557 85 64 46 26 14 13 21 33
Mo. 713 10,840 12,277 1,245 608 405 515 71 31 55 41
N. Dak. 5 28 37 24 6 5 1 9 1 4 4
S. Dak. 18 220 224 84 37 2 4 1 - 4 1
Nebr. 101 854 1,060 55 122 31 31 12 14 14 15
Kans. 277 2,494 3,708 158 109 45 31 18 18 8 6
S. ATLANTIC 16,629 101,955 105,557 1,328 1,315 1,611 2,029 600 432 174 355
Del. 279 2,189 1,979 9 22 8 14 - 2 2 31
Md. 2,409 9,651 17,894 224 195 254 350 4 21 32 80
D.C. 976 4,645 6,975 21 27 19 53 - 2 5 8
Va. 1,400 10,045 13,444 222 184 114 131 21 25 20 14
W. Va. 116 631 835 24 22 53 45 44 45 4 4
N.C. 951 23,357 27,740 108 140 286 280 63 54 33 27
S.C. 868 11,780 12,807 44 40 49 33 19 10 30 16
Ga. 2,144 19,414 U 61 42 73 545 15 203 14 110
Fla. 7,486 20,243 23,883 615 643 755 578 434 70 34 65
E.S. CENTRAL 2,093 40,313 45,385 1,848 735 803 1,195 922 929 46 82
Ky. 267 4,727 5,083 42 201 65 77 33 31 10 9
Tenn. 843 13,576 15,104 1,500 328 629 1,029 887 878 25 44
Ala. 562 16,144 14,133 89 131 109 89 2 20 8 13
Miss. 421 5,866 11,065 217 75 - - - - 3 16
W.S. CENTRAL 5,626 34,641 47,698 4,834 3,156 1,518 1,341 394 323 20 45
Ark. 243 4,693 6,497 634 208 84 37 5 8 3 9
La. 972 10,436 11,753 151 154 214 173 186 185 3 14
Okla. 256 5,115 4,554 1,380 373 236 132 91 59 6 11
Tex. 4,155 14,397 24,894 2,669 2,421 984 999 112 71 8 11
MOUNTAIN 2,071 8,438 9,939 4,033 5,145 822 676 464 435 113 95
Mont. 22 68 87 168 24 23 21 17 13 4 16
Idaho 43 138 92 343 374 97 75 57 68 3 2
Wyo. 15 50 87 103 32 27 24 185 163 12 5
Colo. 631 2,678 3,551 507 573 139 96 64 77 41 19
N. Mex. 155 998 1,048 796 1,089 313 211 52 45 6 4
Ariz. 635 3,566 3,154 1,233 2,155 105 102 50 31 12 17
Utah 143 131 301 666 651 80 88 18 18 17 7
Nev. 427 809 1,619 217 247 38 59 21 20 18 25
PACIFIC 12,004 26,258 31,657 9,543 8,831 1,984 2,372 844 859 130 71
Wash. 855 2,524 2,834 800 1,044 188 229 208 258 21 12
Oreg. 426 364 1,022 2,198 1,172 109 152 31 44 - -
Calif. 10,441 21,836 26,210 6,341 6,349 1,647 1,950 485 552 104 55
Alaska 62 672 902 53 209 11 13 3 - - -
Hawaii 220 862 689 151 57 29 28 117 5 5 4
Guam - 77 131 6 23 1 5 - - 1 1
P.R. 2,189 550 499 89 86 489 408 185 210 - -
V.I. 30 6 41 - 3 2 9 - 1 - -
Amer. Samoa - 41 31 6 11 - - - - - -
C.N.M.I. - 42 46 18 12 13 1 - - - -
------------------------------------------------------------------------------------------------------------------------------------------
N: Not nofifiable U: Unavailable -: no reported cases C.N.M.I.: Commonwealth of North Mariana Islands
*Updated monthly to the Division of HIV/AIDS Prevention, National Center for Prevention Services, last update November 30, 1995.
=============================================================================================================================================================================
TABLE II. (page 2) Cases of selected notifiable diseases, United States, weeks ending
December 23, 1995, and December 24, 1994 (51st Week)
Measles (Rubeola)
------------------------------------------------------------
Lyme Malaria Indigenous Imported* Total Meningococcal Mumps
Disease Infections
---------------- --------------- --------------- --------------- --------------- --------------- ---------------
Reporting Area Cum. Cum. Cum. Cum. Cum. Cum. Cum. Cum. Cum. Cum. Cum. Cum.
1995 1994 1995 1994 1995 1995 1995 1995 1995 1994 1995 1994 1995 1994
---------------------------------------------------------------------------------------------------------------------------------------------------------------------------
UNITED STATES 9,124 12,343 1,229 1,114 2 261 - 27 288 925 2,868 2,658 826 1,400
NEW ENGLAND 2,021 2,753 48 73 1 9 - 3 12 27 143 130 11 26
Maine 34 27 7 6 - - - - - 5 15 23 4 3
N.H. 29 30 2 3 - - - - - 1 24 8 1 4
Vt. 9 16 1 3 - - - - - 3 11 5 - -
Mass. 196 217 19 34 1 3 - 2 5 7 49 61 2 3
R.I. 285 471 4 9 - 5 - - 5 7 - - 1 4
Conn. 1,468 1,992 15 18 - 1 - 1 2 4 44 33 3 12
MID. ATLANTIC 5,899 7,697 341 236 - 7 - 5 12 225 311 293 119 114
Upstate N.Y. 2,890 4,729 66 55 - 1 - - 1 26 100 94 28 31
N.Y. City 231 42 183 89 - 2 - 3 5 15 45 33 16 12
N.J. 1,366 1,512 65 55 - 4 - 2 6 175 76 64 17 13
Pa. 1,412 1,414 27 37 - - - - - 9 90 102 58 58
E.N. CENTRAL 77 526 137 109 - 13 - 4 17 103 377 384 172 263
Ohio 37 44 13 15 - 1 - 1 2 17 113 118 53 75
Ind. 22 18 19 15 - - - - - 1 55 52 10 7
Ill. 13 23 63 45 - 4 - 2 6 56 92 119 48 108
Mich. 5 33 26 31 - 6 - 1 7 26 72 58 61 59
Wis. - 408 16 3 - 2 - - 2 3 45 37 - 14
W.N. CENTRAL 275 287 30 45 - 2 - - 2 171 192 168 49 68
Minn. 191 150 10 14 - - - - - - 29 20 8 4
Iowa 16 17 2 5 - - - - - 7 31 21 11 16
Mo. 43 101 8 13 - 1 - - 1 161 79 76 24 43
N. Dak. - - 2 1 - - - - - - 2 1 1 4
S. Dak. - - 2 - - - - - - - 9 9 - -
Nebr. 3 3 3 5 - - - - - 2 16 13 4 1
Kans. 22 16 3 7 - 1 - - 1 1 26 28 1 -
S. ATLANTIC 548 811 239 228 - 11 - 1 12 73 531 387 124 201
Del. 23 106 1 3 - - - - - - 6 5 - -
Md. 313 315 61 82 - - - 1 1 4 41 35 20 64
D.C. 2 9 17 15 U - U - - - 7 7 - -
Va. 54 129 54 37 - - - - - 3 62 66 25 46
W. Va. 23 27 4 - - - - - - 37 9 14 - 3
N.C. 83 77 18 11 - - - - - 3 83 54 41 36
S.C. 17 7 3 5 - - - - - - 57 35 11 8
Ga. 14 121 37 34 - 2 - - 2 4 110 78 10 9
Fla. 19 20 44 41 - 9 - - 9 22 156 93 17 35
E.S. CENTRAL 57 43 27 32 - - - - - 28 187 194 24 30
Ky. 10 24 3 12 - - - - - - 63 41 - -
Tenn. 28 13 10 10 - - - - - 28 42 40 5 8
Ala. 12 6 11 9 - - - - - - 45 77 4 12
Miss. 7 - 3 1 - - - - - - 37 36 15 10
W.S. CENTRAL 118 131 49 75 - 31 - 3 34 19 361 326 54 242
Ark. 10 9 2 3 - 2 - - 2 1 34 45 10 6
La. 7 2 6 10 - 17 - 1 18 1 56 42 14 35
Okla. 48 76 1 7 - - - - - - 45 35 - 23
Tex. 53 44 40 55 - 12 - 2 14 17 226 204 30 178
MOUNTAIN 11 18 61 40 - 66 - 2 68 198 199 175 26 162
Mont. - - 3 - - - - - - - 4 6 1 -
Idaho - 3 1 2 - 1 - 1 2 1 13 17 4 10
Wyo. 3 5 - 1 - - - - - - 8 9 - 3
Colo. - 1 26 18 - 24 - - 24 46 48 40 2 4
N. Mex. 1 5 8 3 - 30 - 1 31 - 37 17 N N
Ariz. 1 - 13 10 - 10 - - 10 8 60 57 2 99
Utah 1 3 6 4 - - - - - 134 18 19 11 28
Nev. 5 1 4 2 - 1 - - 1 9 11 10 6 18
PACIFIC 118 77 297 276 1 122 - 9 131 81 567 601 247 294
Wash. 10 4 21 41 1 17 - 4 21 4 97 93 15 22
Oreg. 15 6 21 17 - - - 1 1 2 107 139 N N
Calif. 93 67 238 201 - 105 - 3 108 61 342 356 206 250
Alaska - - 5 2 - - - - - 10 17 5 13 4
Hawaii - - 12 15 - - - 1 1 4 4 8 13 18
Guam - - - - U - U - - 228 3 - 4 7
P.R. - - 1 5 U 11 U - 11 11 23 7 2 2
V.I. - - - - U - U - - - - - 2 4
Amer. Samoa - - - - U - U - - - - - - 3
C.N.M.I. - - 1 1 U - U - - 29 - - - 2
---------------------------------------------------------------------------------------------------------------------------------------------------------------------------
*For imported measles, cases include only those resulting from importation from other countries.
N: Not notifiable U: Unavailable -: no reported cases
=============================================================================================================================================================================
TABLE II. (page 3) Cases of selected notifiable diseases, United States, weeks ending
December 23, 1995, and December 24, 1994 (51st Week)
Pertussis Rubella Syphilis Tuberculosis Rabies,
(Primary & Animal
Secondary)
--------------------------- -------------------------- ----------------- ----------------- ----------------
Reporting Area Cum. Cum. Cum. Cum. Cum. Cum. Cum. Cum. Cum. Cum.
1995 1995 1994 1995 1995 1994 1995 1994 1995 1994 1995 1994
-----------------------------------------------------------------------------------------------------------------------------------------------------
UNITED STATES 70 4,151 4,248 30 199 219 14,922 20,332 19,541 21,841 6,563 7,508
NEW ENGLAND 15 632 635 1 50 131 251 216 519 514 1,437 1,847
Maine 2 50 18 - 1 - 2 4 24 27 45 -
N.H. 2 56 90 - 1 - 1 4 21 17 148 216
Vt. 1 74 46 - - - - - 4 10 173 140
Mass. 6 416 434 1 8 125 70 90 284 264 398 718
R.I. - 4 7 - - 3 4 16 48 52 317 40
Conn. 4 32 40 - 40 3 174 102 138 144 356 733
MID. ATLANTIC 3 396 654 - 15 7 819 1,374 3,982 4,399 1,242 2,030
Upstate N.Y. 2 223 234 - 5 6 42 162 497 591 491 1,512
N.Y. City - 40 211 - 8 - 368 583 2,100 2,509 - -
N.J. - 16 15 - 2 1 175 234 782 799 325 272
Pa. 1 117 194 - - - 234 395 603 500 426 246
E.N. CENTRAL 11 506 579 - 6 10 2,511 3,032 1,901 2,087 92 69
Ohio 9 181 158 - - - 875 1,136 273 340 12 4
Ind. - 77 68 - 1 - 280 270 189 190 13 14
Ill. 2 136 110 - 1 1 897 1,059 971 1,045 15 21
Mich. - 100 94 - 4 9 292 278 386 447 41 14
Wis. - 12 149 - - - 167 289 82 65 11 16
W.N. CENTRAL - 248 224 - 1 2 695 1,169 580 572 352 219
Minn. - 127 100 - - - 37 52 140 130 26 19
Iowa - 12 23 - - - 44 71 65 62 131 85
Mo. - 54 45 - - 2 577 980 233 245 23 27
N. Dak. - 8 5 - - - - 1 5 10 28 14
S. Dak. - 12 26 - - - - 2 26 25 96 39
Nebr. - 12 12 - - - 11 11 21 19 5 -
Kans. - 23 13 - 1 - 26 52 90 81 43 35
S. ATLANTIC - 322 410 29 80 16 3,852 5,298 3,248 3,829 2,075 1,978
Del. - 10 3 - - - 19 27 49 40 88 71
Md. - 40 74 - - - 421 331 293 339 316 515
D.C. U 6 11 U - - 100 211 99 112 11 3
Va. - 31 36 - - - 573 788 283 328 448 421
W. Va. - - 5 - - - 10 9 70 80 112 80
N.C. - 110 140 - 1 - 1,118 1,620 519 549 456 172
S.C. - 27 14 - 1 - 554 798 301 386 119 173
Ga. - 30 30 29 54 2 675 790 319 678 274 361
Fla. - 68 97 - 24 14 382 724 1,315 1,317 251 182
E.S. CENTRAL 1 274 129 - 2 - 3,654 3,862 1,407 1,545 283 224
Ky. - 24 60 - - - 197 206 296 322 28 28
Tenn. 1 209 22 - 1 - 911 1,020 411 519 98 71
Ala. - 38 35 - - - 656 631 414 429 148 121
Miss. - 3 12 N N N 1,890 2,005 286 275 9 4
W.S. CENTRAL 1 280 202 - 8 13 2,354 4,275 2,874 2,940 574 652
Ark. - 41 28 - 1 - 472 465 313 261 50 36
La. 1 18 12 - - - 994 1,635 111 193 45 69
Okla. - 30 32 - - 4 187 151 346 231 29 39
Tex. - 191 130 - 7 9 701 2,024 2,104 2,255 450 508
MOUNTAIN 5 558 590 - 5 5 204 234 572 583 164 148
Mont. - 9 12 - - - 4 3 10 9 44 22
Idaho - 101 161 - - - - 2 14 12 3 3
Wyo. - 1 - - 1 - 1 2 5 9 25 19
Colo. 3 113 223 - - - 99 119 17 92 9 18
N. Mex. 2 147 35 - - - 31 21 79 66 6 8
Ariz. - 151 119 - 3 - 36 45 311 221 50 56
Utah - 31 37 - 1 4 4 11 37 55 15 13
Nev. - 5 3 - - 1 29 31 99 119 12 9
PACIFIC 34 935 825 - 32 35 582 872 4,458 5,372 344 341
Wash. 1 352 116 - 2 - 15 32 239 251 7 15
Oreg. - 61 106 - 2 4 9 39 66 90 1 13
Calif. 33 463 584 - 24 27 556 794 3,905 4,706 332 279
Alaska - 1 - - - - 2 3 75 89 4 34
Hawaii - 58 19 - 4 4 - 4 173 236 - -
Guam U 1 2 U - 1 8 3 53 85 - -
P.R. U 15 3 U - - 289 315 195 189 47 75
V.I. U - - U - - 2 28 - - - -
Amer. Samoa U - 1 U - - - 1 5 4 - -
C.N.M.I. U - - U - - 12 2 16 30 - -
-----------------------------------------------------------------------------------------------------------------------------------------------------
U: Unavailable -: no reported cases
=============================================================================================================================================================================
Return to top. Table_III Note: To print large tables and graphs users may have to change their printer settings to landscape and use a small font size.
TABLE III. Deaths in 121 U.S. cities* week ending
December 23, 1995 (51st Week)
===================================================================================================================================
All Causes, By Age (Years)
------------------------------------------------------------------------ P&I**
Reporting Area All Ages >=65 45-64 25-44 1-24 <1 Total
---------------------------------------------------------------------------------------------------------------
NEW ENGLAND 575 411 96 45 13 10 29
Boston, Mass. 169 110 33 18 4 4 8
Bridgeport, Conn. 40 33 4 2 1 - -
Cambridge, Mass. 19 15 2 2 - - -
Fall River, Mass. 30 27 2 - 1 - -
Hartford, Conn. 48 29 14 2 2 1 4
Lowell, Mass. 31 21 6 4 - - 2
Lynn, Mass. 10 6 2 1 1 - 1
New Bedford, Mass. 21 21 - - - - 1
New Haven, Conn. 56 38 11 4 2 1 4
Providence, R.I. U U U U U U U
Somerville, Mass. 6 4 2 - - - -
Springfield, Mass. 41 29 5 3 1 3 3
Waterbury, Conn. 40 28 6 6 - - 2
Worcester, Mass. 64 50 9 3 1 1 4
MID. ATLANTIC 2,382 1,555 467 283 39 38 113
Albany, N.Y. 49 38 7 2 - 2 4
Allentown, Pa. 19 17 2 - - - -
Buffalo, N.Y. U U U U U U U
Camden, N.J. 39 24 9 5 1 - 1
Elizabeth, N.J. 32 18 6 8 - - 1
Erie, Pa.*** 30 25 3 2 - - 3
Jersey City, N.J. U U U U U U U
New York City, N.Y. 1,350 845 284 178 22 21 53
Newark, N.J. 84 41 19 19 3 2 6
Paterson, N.J. 15 6 3 5 1 - 3
Philadelphia, Pa. 299 193 61 32 8 5 17
Pittsburgh, Pa.*** 74 56 12 4 - 2 1
Reading, Pa. 15 12 - 2 1 - 2
Rochester, N.Y. 134 103 21 6 2 2 7
Schenectady, N.Y. 25 17 4 4 - - -
Scranton, Pa.*** 24 22 1 1 - - -
Syracuse, N.Y. 94 65 21 4 1 3 6
Trenton, N.J. 38 30 5 2 - 1 3
Utica, N.Y. 27 19 4 4 - - 3
Yonkers, N.Y. 34 24 5 5 - - 3
E.N. CENTRAL 2,264 1,528 409 195 62 50 150
Akron, Ohio 51 36 13 2 - - -
Canton, Ohio 38 30 6 1 1 - 3
Chicago, Ill. 462 295 85 52 19 11 41
Cincinnati, Ohio 139 67 29 12 6 5 7
Cleveland, Ohio 153 93 35 14 4 7 2
Columbus, Ohio 222 157 39 18 4 4 24
Dayton, Ohio 93 67 19 5 2 - 3
Detroit, Mich. 201 124 39 29 4 5 7
Evansville, Ind. 30 27 1 - 1 1 1
Fort Wayne, Ind. 71 49 15 5 2 - 4
Gary, Ind. 14 11 2 - - 1 -
Grand Rapids, Mich. 66 47 11 2 4 2 11
Indianapolis, Ind. 221 150 39 23 5 4 12
Madison, Wis. 53 40 6 5 2 - 4
Milwaukee, Wis. 116 85 14 13 1 3 11
Peoria, Ill. 50 37 5 4 1 3 2
Rockford, Ill. 47 38 7 - 1 1 9
South Bend, Ind. 45 36 6 1 1 1 1
Toledo, Ohio 110 84 19 3 3 1 5
Youngstown, Ohio 82 55 19 6 1 1 3
W.N. CENTRAL 744 555 113 38 15 13 50
Des Moines, Iowa U U U U U U U
Duluth, Minn. 29 24 4 1 - - 2
Kansas City, Kans. 65 48 13 1 3 - 4
Kansas City, Mo. 107 71 16 5 2 3 4
Lincoln, Nebr. 22 22 - - - - 2
Minneapolis, Minn. 205 151 28 17 6 3 18
Omaha, Nebr. 101 73 18 5 4 1 9
St. Louis, Mo. 101 77 15 5 - 4 1
St. Paul, Minn. 41 29 11 - - 1 7
Wichita, Kans. 73 60 8 4 - 1 3
S. ATLANTIC 1,105 720 216 117 26 25 57
Atlanta, Ga. 226 135 50 27 6 8 6
Baltimore, Md. 170 102 26 30 7 5 11
Charlotte, N.C. 57 38 11 6 1 1 4
Jacksonville, Fla. 142 97 24 12 5 4 11
Miami, Fla. 110 59 27 22 1 1 -
Norfolk, Va. 45 30 9 3 1 1 1
Richmond, Va. 35 19 8 5 2 1 2
Savannah, Ga. 54 42 11 - - 1 7
St. Petersburg, Fla. 70 55 10 2 1 2 1
Tampa, Fla. 190 142 35 10 2 1 14
Washington, D.C. U U U U U U U
Wilmington, Del. 6 1 5 - - - -
E.S. CENTRAL 771 527 153 65 17 9 56
Birmingham, Ala. 120 82 26 9 3 - 4
Chattanooga, Tenn. 89 63 11 10 3 2 9
Knoxville, Tenn. 82 62 11 5 1 3 12
Lexington, Ky. 4 4 - - - - -
Memphis, Tenn. 183 131 31 14 5 2 16
Mobile, Ala. 93 65 21 6 1 - 2
Montgomery, Ala. 49 33 13 3 - - 1
Nashville, Tenn. 151 87 40 18 4 2 12
W.S. CENTRAL 1,485 959 295 154 51 25 128
Austin, Tex. 87 50 20 13 3 1 8
Baton Rouge, La. 61 43 13 4 1 - 2
Corpus Christi, Tex. 42 25 10 6 1 - 1
Dallas, Tex. 188 119 40 20 8 1 10
El Paso, Tex. 97 73 13 5 1 5 9
Ft. Worth, Tex. 126 86 20 13 4 2 18
Houston, Tex. 417 255 100 48 13 1 45
Little Rock, Ark. 86 52 20 6 4 4 6
New Orleans, La. U U U U U U U
San Antonio, Tex. 200 131 31 28 6 4 14
Shreveport, La. 107 72 17 6 6 6 9
Tulsa, Okla. 74 53 11 5 4 1 6
MOUNTAIN 788 560 139 60 17 12 72
Albuquerque, N.M. 102 72 16 10 4 - 8
Colo. Springs, Colo. 56 43 7 3 3 - 8
Denver, Colo. 91 65 9 8 2 7 6
Las Vegas, Nev. 232 154 60 14 3 1 20
Ogden, Utah 24 17 4 2 1 - 2
Phoenix, Ariz. U U U U U U U
Pueblo, Colo. 13 10 3 - - - 2
Salt Lake City, Utah 110 82 13 10 1 4 9
Tucson, Ariz. 160 117 27 13 3 - 17
PACIFIC 1,488 998 282 145 28 34 146
Berkeley, Calif. 19 11 6 2 - - -
Fresno, Calif. 120 83 14 13 8 2 6
Glendale, Calif. U U U U U U U
Honolulu, Hawaii 79 52 20 4 2 1 10
Long Beach, Calif. 68 43 16 3 2 4 11
Los Angeles, Calif. U U U U U U U
Pasadena, Calif. U U U U U U U
Portland, Oreg. 165 113 29 19 1 3 12
Sacramento, Calif. 209 148 37 14 3 7 28
San Diego, Calif. 161 99 30 21 7 4 22
San Francisco, Calif. 156 95 29 27 1 3 16
San Jose, Calif. 195 144 35 12 1 3 28
Santa Cruz, Calif. 29 21 5 3 - - 5
Seattle, Wash. 144 85 36 18 2 3 3
Spokane, Wash. 59 45 10 2 1 1 2
Tacoma, Wash. 84 59 15 7 - 3 3
TOTAL 11,602 7,813 2,170 1,102 268 216 801
---------------------------------------------------------------------------------------------------------------
* Mortality data in this table are voluntarily reported from 121 cities in the United States, most of which have populations
of 100,000 or more. A death is reported by the place of its occurrence and by the week that the death certificate was
filed. Fetal deaths are not included.
** Pneumonia and influenza.
*** Because of changes in reporting methods in these 3 Pennsylvania cities, these numbers are partial counts for the current
week. Complete counts will be available in 4 to 6 weeks.
**** Total includes unknown ages.
U: Unavailable -: no reported cases
===================================================================================================================================
Return to top. Disclaimer All MMWR HTML versions of articles are electronic conversions from ASCII text into HTML. This conversion may have resulted in character translation or format errors in the HTML version. Users should not rely on this HTML document, but are referred to the electronic PDF version and/or the original MMWR paper copy for the official text, figures, and tables. An original paper copy of this issue can be obtained from the Superintendent of Documents, U.S. Government Printing Office (GPO), Washington, DC 20402-9371; telephone: (202) 512-1800. Contact GPO for current prices. **Questions or messages regarding errors in formatting should be addressed to mmwrq@cdc.gov.Page converted: 09/19/98 |
|||||||||
This page last reviewed 5/2/01
|