 |
|
|
|
|
|
|
| ||||||||||
|
|
|
|
|
|
|
||||
| ||||||||||
|
|
|
|
|
Persons using assistive technology might not be able to fully access information in this file. For assistance, please send e-mail to: mmwrq@cdc.gov. Type 508 Accommodation and the title of the report in the subject line of e-mail. Use of Mammography Services by Women Aged greater than or equal to 65 Years Enrolled in Medicare -- United States, 1991-1993The incidence of invasive breast cancer among women aged greater than or equal to 65 years is twice that among those aged 35-44 years (1), and the death rate from breast cancer is approximately three times higher among women aged greater than or equal to 65 years than among women aged 35-64 years (2). Although routine screening mammography among women aged greater than or equal to 50 years can reduce breast cancer mortality by greater than or equal to 30% by detecting tumors at early, more treatable stages (3), older women are less likely to receive screening mammograms (4). The Health Care Financing Admininistration (HCFA) routinely examines trends in the use of health services by age, race, and sex to monitor access to medical care for Medicare beneficiaries. Using Medicare claims data, HCFA estimated rates of mammography use among women aged greater than or equal to 65 years during 1991-1993. This report presents the findings of this analysis. Women enrolled in Medicare are eligible for diagnostic and screening mammograms under the Medicare Part B program, which enrolls approximately 96% of U.S. residents aged greater than or equal to 65 years. Biennial screening mammography for women aged greater than or equal to 65 years has been a Medicare benefit since January 1, 1991; previously, only diagnostic mammograms were covered under Medicare Part B. Both screening and diagnostic mammography are reimbursed at 80% of allowed charges after an annual deductible of $100 for all Part B services. For this analysis, Medicare claims data for services provided during 1991-1993, were used to calculate annual rates of mammography use for enrolled women aged greater than or equal to 65 years; age- and race-specific rates also were calculated. Race-specific rates are presented for blacks and whites only because identification of other racial groups is incomplete in the Medicare administrative data system. Because claims are not submitted for the Medicare population enrolled in managed-care plans (approximately 7% in 1993) (5), rates are based on women enrolled in fee-for-service Medicare. Three cohorts of women were established using the Medicare denominator files for 1991, 1992, and 1993. Each annual cohort consisted of approximately 16 million women (Table_1) who were continuously enrolled in fee-for-service Medicare parts A and B. Women excluded from this analysis were those aged less than 65 years as of January 1 of the year, those enrolled in a health maintenance organization at any time during the year, and those who died during the year. Rates of mammography use represent the percentage of women in each cohort who had one or more mammograms (screening or diagnostic) during that year. Because providers do not uniformly apply the codes used to bill Medicare for mammograms, Medicare claims cannot reliably distinguish screening and diagnostic mammograms; therefore, both types of mammography are included in this analysis. During 1991-1993, of each annual cohort of approximately 16 million women aged greater than or equal to 65 years who were continuously enrolled in fee-for-service Medicare, 3.8-4.0 million (approximately 25%) had one or more mammography claims (Table_1). During this period, rates of mammography use varied inversely with age of the beneficiary (Figure_1); in all years, the rate for women aged 80-84 years was less than half that for women aged 65-69 years. For all age groups, black women were less likely than white women to have received mammograms, although this difference declined during each of the 3 years: in 1991, the black-to-white ratio of mammography rates was 0.64:1, compared with 0.71:1 in 1993 (Table_2). Reported by: AE Trontell, MD, Div of Health Information and Outcomes, Office of Research and Demonstrations; EW Franey, Institutional Payment and Studies Br, Div of Provider Data, Office of Health Care Information Systems, Bur of Data Management and Strategy, Health Care Financing Administration. Epidemiology and Statistics Br, Div of Cancer Prevention and Control, National Center for Chronic Disease Prevention and Health Promotion, CDC. Editorial NoteEditorial Note: The findings in this report are consistent with previous studies that indicate a low rate of mammography use among women aged greater than or equal to 65 years (4). In this analysis, black women and women aged greater than or equal to 85 years were least likely to have received mammograms under Medicare. A national health objective for the year 2000 is to increase to 60% the percentage of women aged greater than or equal to 50 years who received a mammogram and clinical breast examination during the previous 2 years (objective 16.11) (6). Among Medicare beneficiaries, the biennial rate of mammography use for 1992-1993 was 37% for women aged greater than or equal to 65 years (7). In addition to the patient and physician attributes known to influence screening mammography use (8), three additional factors may explain the low rate of use among this elderly Medicare population. First, for women aged greater than or equal to 75 years, low rates of use may be a consequence of variations in recommendations by professional associations to perform screening mammography for women in this age group (9). Second, for black women, low rates may reflect financial barriers (e.g., the Part B deductible or copayments) and other obstacles in the delivery of health services to women of lower socioeconomic status. Finally, overall low use of mammography by Medicare benificiaries also may reflect limited awareness of this health benefit: in 1992, approximately two thirds of elderly women were unaware that mammography was a Medicare benefit (10). In response to the low awareness and low use of the Medicare mammography benefit, HCFA has organized multimedia outreach efforts through its national and regional offices. Since May 1995, approximately 50 major organizations have participated in campaigns to publicize mammography as a Medicare benefit; participating organizations have included CDC and other federal agencies, health-care provider associations, senior citizen groups, voluntary organizations, major corporations, and trade associations. These outreach efforts also are being promoted during National Breast Cancer Awareness Month in October. In addition to informational efforts aimed at elderly women enrolled in Medicare and their families, county-level and race-specific annual and biennial mammography rates were made available to local and national health organizations to assist in developing interventions to increase mammography use (7). References
TABLE 1. Number of women aged >=65 years who were enrolled in Medicare, * by year, and percentage of those who had
one or more mammography claims + during the year, by race, age group, and year -- United States, 1991-1993
=====================================================================================================================================
                              1991                          1992                          1993
                  -----------------------------   --------------------------   ----------------------------
                                 % Women with                   % Women >=1                  % Women with
Race &/Age          No. women   >=1 mammography    No. women   mammography      No. women   >=1 mammography
group (yrs)        in cohort +       claim         in cohort      claim         in cohort        claim
-----------------------------------------------------------------------------------------------------------
White
 65-69             3,801,318         34.3          3,702,946        34.4        3,651,436         35.1
 70-74             3,428,770         30.4          3,496,483        30.8        3,508,097         31.6
 75-79             2,778,679         23.7          2,803,397        24.2        2,805,740         25.0
 80-84             1,947,766         15.5          1,982,701        16.0        2,009,368         16.7
  >=85             1,677,000          6.4          1,729,097         6.7        1,765,866          7.0
 Total            13,633,533         25.0         13,714,624        25.3       13,740,507         25.9

Black
 65-69               340,119         21.1            338,684        22.5          337,010         24.3
 70-74               291,684         18.9            298,836        20.1          303,665         21.7
 75-79               231,693         15.1            236,692        16.1          233,149         17.4
 80-84               154,291         10.7            157,559        11.6          161,218         12.3
  >=85               136,148          5.6            141,769         5.8          146,570          6.1
 Total             1,153,935         16.1          1,173,540        17.1        1,181,612         18.4

All races @
 65-69             4,455,911         33.0          4,395,045        33.1        4,362,734         33.9
 70-74             3,923,110         29.3          4,014,482        29.8        4,051,938         30.6
 75-79             3,151,318         22.9          3,188,427        23.5        3,192,607         24.3
 80-84             2,190,889         15.1          2,234,131        15.6        2,269,042         16.3
  >=85             1,869,301          6.3          1,930,032         6.6        1,976,235          6.9
Total             15,590,529         24.3         15,762,117        24.6       15,852,556         25.2
-----------------------------------------------------------------------------------------------------------
* Enrollees in Medicare parts A and B who were not in health maintenance organizations and who were aged >=65 years as of January 1
  and alive on December 31 of the indicated year.
+ For a screening or diagnostic mammogram. Because Medicare providers do not uniformly apply the codes used to bill Medicare for
  mammograms, Medicare claims cannot reliably distinguish screening and diagnostic mammograms.
& Identification of races other than white and black is incomplete in the Medicare administrative data system.
@ Includes women of other and unknown race.
=====================================================================================================================================
Return to top. Figure_1 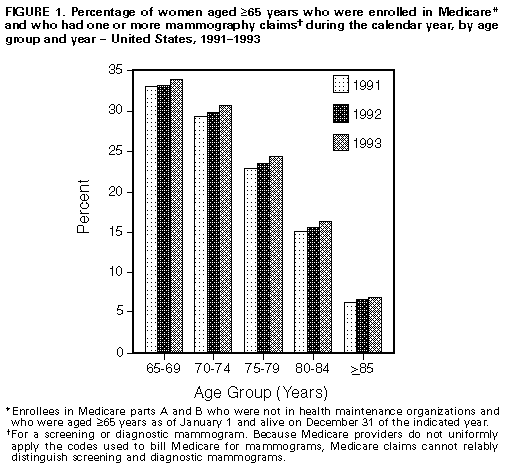 Return to top. Table_2 Note: To print large tables and graphs users may have to change their printer settings to landscape and use a small font size. TABLE 2. Black-to-white ratio of mammography rates * for women aged >=65 years who were enrolled in Medicare +, by age group and year -- United States, 1991-1993 ============================================================================================ Age group (yrs) 1991 1992 1993 ------------------------------------------------ 65-69 0.62:1 0.66:1 0.69:1 70-74 0.62:1 0.65:1 0.69:1 75-79 0.63:1 0.67:1 0.69:1 80-84 0.69:1 0.72:1 0.74:1 >=85 0.88:1 0.86:1 0.88:1 Total 0.64:1 0.68:1 0.71:1 ------------------------------------------------ * Rates are for diagnostic and screening mammography. Because Medicare providers do not uniformly apply the codes used to bill Medicare for mammograms, Medicare claims cannot reliably distinguish screening and diagnostic mammograms. + Enrollees in Medicare parts A and B who were not in health maintenance organizations and who were aged >=65 years as of January 1 and alive on December 31 of the indicated year. ============================================================================================ Return to top. Disclaimer All MMWR HTML versions of articles are electronic conversions from ASCII text into HTML. This conversion may have resulted in character translation or format errors in the HTML version. Users should not rely on this HTML document, but are referred to the electronic PDF version and/or the original MMWR paper copy for the official text, figures, and tables. An original paper copy of this issue can be obtained from the Superintendent of Documents, U.S. Government Printing Office (GPO), Washington, DC 20402-9371; telephone: (202) 512-1800. Contact GPO for current prices. **Questions or messages regarding errors in formatting should be addressed to mmwrq@cdc.gov.Page converted: 09/19/98 |
|||||||||
This page last reviewed 5/2/01
|