 |
|
|
|
|
|
|
| ||||||||||
|
|
|
|
|
|
|
||||
| ||||||||||
|
|
|
|
|
Persons using assistive technology might not be able to fully access information in this file. For assistance, please send e-mail to: mmwrq@cdc.gov. Type 508 Accommodation and the title of the report in the subject line of e-mail. State and National Vaccination Coverage Levels Among Children Aged 19-35 Months -- United States, April-December 1994The National Immunization Survey (NIS) is a single survey providing state and national estimates of vaccination coverage levels among children aged 19-35 months. CDC implemented the NIS in April 1994 as one element of the five-part Childhood Immunization Initiative (CII) (1), a national strategy to achieve and maintain high vaccination levels among children during the first 2 years of life. NIS collects quarterly data from the 50 states, the District of Columbia, and 27 urban areas considered to have populations at high risk for undervaccination. This report of initial NIS findings provides the results of both national and state vaccination coverage levels for April-December 1994. The NIS uses a two-phase sample design. For the first phase, a quarterly random sample of telephone numbers for each survey area is called, and a screening questionnaire is administered to locate households with one or more children aged 19-35 months. Vaccination information is collected for age-eligible children. All respondents are requested to refer to written records. During April-December 1994, approximately 1.2 million telephone numbers were called, and 25,247 interviews were completed (an average of 110 interviews per area per quarter). The overall response rate for eligible households was 71% (range: 60%-88% among the individual states). In the second phase, vaccination information is requested from health-care providers of children in surveyed households because parents tend to underestimate the number of doses received for multiple-dose vaccines and to overestimate coverage for single-dose vaccines (2,3). Households excluded from phase two include those that use records indicating their children received all of the recommended doses for at least four vaccines * because such recorded histories are highly accurate (CDC, unpublished data, 1995). Based on these exclusions, 18,479 (73%) households were eligible for phase two. Of these, vaccination information was obtained from providers for 7594 (41%) children. The demographic characteristics and the reported vaccination histories were similar for children in households with provider information and households with parental reports only. Overall, 57% of the children in the survey had either written records of having received all of the required doses for at least four vaccines, or had vaccination information based on provider records. The data obtained from provider records were used to improve the accuracy of the vaccination coverage estimates for the entire sample. Standard two-phase estimation procedures (4) were used to estimate vaccination coverage for each surveyed area. The estimates were adjusted using natality data to create a weighted sample representative of children aged 19-35 months in the United States; in addition, adjustments were made for nonresponse and for exclusion of households without a telephone to account for the finding that children in households without telephones are less likely to be vaccinated than children in households with a telephone (CDC, unpublished data, 1995) (5). Based on the NIS, among children who were born during May 1991-May 1993 and who were aged 19-35 months (median: 27 months) when surveyed, estimated vaccination coverage was 75% (confidence interval {CI}= plus or minus 1.2%) for receipt of at least four doses of diphtheria and tetanus toxoids and pertussis vaccine (DTP), three doses of poliovirus vaccine, and one dose of measles-mumps-rubella vaccine (MMR) (4:3:1 series) Table_1. However, except for hepatitis B, coverage levels for each of the vaccines individually were substantially higher: coverage with three or more doses of DTP was greater than 90%; coverage for one dose of MMR, three or more doses of polio, and three or more doses of Haemophilus influenzae type B vaccine (Hib) ranged from 83% to 89%. The lower overall coverage for the 4:3:1 series was accounted for primarily by low coverage for the fourth dose of DTP (77%). State-specific estimated coverage levels for the 4:3:1 series ranged from 61% (CI= plus or minus 6.2%) to 88% (CI= plus or minus 4.6%) Table_2. Coverage levels were less than 65% in three states, greater than or equal to 85% in three states, and were higher in the northeastern and southeastern regions Figure_1. To assess the validity of estimates from the NIS, findings were compared with previously reported data from the National Health Interview Survey (NHIS) (6,7), a national household survey of the U.S. civilian, noninstitutionalized population. For January-June 1994, NH supplemented with provider information in the same manner as in the NIS survey. The estimated coverage level of 75% in the NIS survey was similar to the 72% estimate obtained from the NHIS, and vaccine coverage levels for each individual vaccine (except for hepatitis B) were nearly identical Table_1. In addition, estimates of vaccination coverage derived independently by selected states for 1994 were similar to those reported in the NIS (CDC, unpublished data, 1995). Reported by: National Center for Health Statistics; Assessment Br, Data Management Div, National Immunization Program, CDC. Editorial NoteEditorial Note: The NIS data provide the first current, population-based, state-specific estimates of vaccination coverage produced by a standard methodology for the United States. These findings enable valid comparisons of state efforts to deliver vaccination services. The NIS has obtained the most reliable estimates of vaccination coverage through the use of health-care provider records and the use of data from the NHIS to adjust for households without telephones. The estimate of the coverage for the 4:3:1 series based on NIS (75%) was substantially higher than that previously reported through the NHIS (67%), probably reflecting improvements in the accuracy of both NIS and NHIS data with the inclusion of information from providers rather than a true increase in coverage. CDC will continue to assess and improve the quality of national vaccination data. The vaccination coverage rates reported in the NIS and in recent reports from the NHIS are the highest ever recorded in the United States. In particular, the findings in the NIS indicate that the CII goal for 90% coverage with three doses of DTP was exceeded, and that the 90% coverage goals for polio, measles, and Hib were nearly attained (1). Coverage for hepatitis B, the vaccine most recently added to the pediatric schedule, was the lowest because many children were born before the recommendations for vaccination were made. Coverage for four doses of DTP is the lowest of the three vaccines included in the combined series. The Advisory Committee on Immunization Practices recently reaffirmed its recommendation for a fourth dose of DTP for all children aged 12-18 months (8). Efforts to ensure timely administration of the fourth dose of DTP vaccine must be intensified to further reduce the incidence of pertussis and should include simultaneous administration with other vaccines recommended for children aged 12-18 months. The substantial variation in state-specific coverage levels for the 4:3:1 series underscores the need for vaccination efforts targeted at children aged less than 2 years; in addition, more than one million children still lack one or more doses of the recommended vaccines. One of the national health objectives for the year 2000 is to achieve series-complete coverage for at least 90% of 2-year-old children for all recommended vaccines ** (objective 20.11) (9). Implementation of the five-part CII strategy will be essential to meet this goal and to build a national system that maintains high coverage levels. Potential limitations of NIS include the possible biases associated with exclusion of households without telephones, household nonresponse, and inaccurate reporting from households and small sample sizes for some states. An adjustment for exclusion of households without telephones was made to account for findings in the 1992-1993 NHIS that coverage levels for the 4:3:1 series are approximately 10 percentage points lower among children in households without telephones (CDC, unpublished data, 1995). Although provider information was not available for all children, those children whose providers were not included in the survey were similar to children whose provider was included, suggesting that use of provider data did not introduce a bias. In addition, estimates based on small sample sizes have a larger variance; future analyses will include data for four quarters, thereby reducing the size of the sampling error. CDC will use the NIS, with data from the NHIS, to evaluate progress toward national vaccination goals and, because of the comparability of the information in the NIS, to identify states with the highest rates (whose programs may be models for other states) and states with lower rates (which may need special attention). These coverage estimates are being used to distribute $33 million in incentive funds, with the greatest funding per fully vaccinated child to states that achieve the highest levels of coverage. References
* Vaccines in this series include four doses of diphtheria and tetanus toxoids and pertussis vaccine (DTP), three doses of poliovirus vaccine, one dose of measles-mumps-rubella vaccine (MMR), and three doses of Haemophilus influenzae type B vaccine (Hib). Children may or may not have received three doses of hepatitis B vaccine. ** Series-complete coverage of all currently recommended vaccines include four doses of DTP, three doses of polio, one dose of MMR, and three doses each of Hib and hepatitis B vaccine. Table_1 Note: To print large tables and graphs users may have to change their printer settings to landscape and use a small font size.
TABLE 1. Vaccination coverage levels among children aged 19-35 months, by selected
vaccines -- United States, 1994
======================================================================================
                                   NHIS *       NHIS provider +       NIS &
                       1996   ---------------  -----------------  --------------
Vaccine/Dose           Goal    %  (95% CI @)     %   (95% CI)      %   (95% CI)
--------------------------------------------------------------------------------------
DTP/DT **
  >=3 Doses            90%     89  (+/-2.4)     93    (+/-2.2)    93   (+/-0.7)
  >=4 Doses            --      69  (+/-3.0)     76    (+/-3.4)    77   (+/-1.1)

Poliovirus
  >=3 Doses            90%     78  (+/-2.7)     83    (+/-3.0)    83   (+/-1.0)

Haemophilus influenzae
  type b
  >=3 Doses            90%     73  (+/-3.1)     89    (+/-2.6)    86   (+/-0.9)

Measles-containing
 (MCV)                 90%     91  (+/-1.8)     88    (+/-3.8)    89   (+/-0.9)

Hepatitis B ++
  >=3 Doses            70%     27  (+/-3.5)     17    (+/-2.8)    37   (+/-1.2)

Combined series
4 DTP/3 Polio/1 MCV && --      67  (+/-3.1)     72    (+/-3.4)    75   (+/-1.2)
--------------------------------------------------------------------------------------
  * 1994 National Health Interview Survey, January-June.
  + 1994 National Health Interview Survey, January-June, with provider data.
  & 1994 National Immunization Survey, April-December.
  @ Confidence interval.
**  Diphtheria and tetanus toxoids and pertussis vaccine/Diphtheria and tetanus
    toxoids.
++  The difference between the NIS and NHIS provider estimates for hepatitis B is
    primarily because of different time periods for the surveys and the rapid
    improvement in hepatitis B coverage during 1994.
&&  Four doses of DTP/DT, three doses of poliovirus vaccine, and one dose of MCV.
======================================================================================
Return to top. Table_2 Note: To print large tables and graphs users may have to change their printer settings to landscape and use a small font size.
TABLE 2. Estimated vaccination coverage with the 4:3:1
series, * by state -- National Immunization Survey,
United States, April-December
========================================================
                               4:3:1 Series coverage
                    Sample     -----------------------
State                size          %   (95% CI +)
--------------------------------------------------------
Alabama                622        75   (+/-6.1)
Alaska                 318        73   (+/-6.9)
Arizona                649        77   (+/-4.8)
Arkansas               345        71   (+/-6.9)
California           1,304        74   (+/-4.9)
Colorado               331        75   (+/-7.2)
Connecticut            329        86   (+/-5.6)
Delaware               309        81   (+/-6.6)
District
  of Columbia          277        73   (+/-8.8)
Florida                915        76   (+/-6.2)
Georgia                620        79   (+/-5.7)
Hawaii                 340        86   (+/-5.7)
Idaho                  313        64   (+/-7.4)
Illinois               644        68   (+/-6.0)
Indiana                642        74   (+/-5.7)
Iowa                   309        81   (+/-6.0)
Kansas                 309        82   (+/-5.6)
Kentucky               342        80   (+/-6.1)
Louisiana              636        71   (+/-6.6)
Maine                  302        82   (+/-6.0)
Maryland               633        79   (+/-5.4)
Massachusetts          633        82   (+/-5.3)
Michigan               624        61   (+/-6.2)
Minnesota              318        81   (+/-5.6)
Mississippi            331        83   (+/-6.1)
Missouri               317        64   (+/-7.5)
Montana                321        75   (+/-6.3)
Nebraska               325        72   (+/-6.6)
Nevada                 322        69   (+/-8.0)
New Hampshire          295        83   (+/-6.0)
New Jersey             603        71   (+/-7.2)
New Mexico             326        73   (+/-7.4)
New York               639        77   (+/-5.1)
North Carolina         355        84   (+/-5.8)
North Dakota           326        81   (+/-5.0)
Ohio                   970        73   (+/-5.2)
Oklahoma               319        76   (+/-7.2)
Oregon                 321        71   (+/-6.9)
Pennsylvania           640        77   (+/-5.1)
Rhode Island           316        82   (+/-5.9)
South Carolina         328        84   (+/-5.7)
South Dakota           329        74   (+/-6.7)
Tennessee              972        74   (+/-4.6)
Texas                1,733        71   (+/-4.3)
Utah                   472        70   (+/-5.6)
Vermont                312        88   (+/-4.6)
Virginia               327        81   (+/-6.4)
Washington             712        74   (+/-4.9)
West Virginia          312        66   (+/-8.3)
Wisconsin              647        76   (+/-5.1)
Wyoming                313        78   (+/-5.7)

Total               25,247        75   (+/-1.2)
--------------------------------------------------------
* Four doses of diphtheria and tetanus toxoids and
  pertussis vaccine, three doses of poliovirus vaccine,
  and one dose of measles-mumps-rubella vaccine.
+ Confidence interval.
========================================================
Return to top. Figure_1 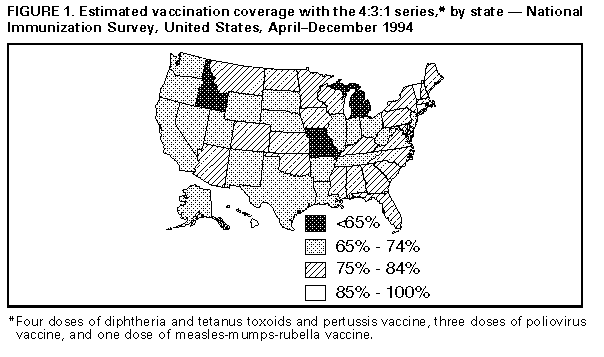 Return to top. Disclaimer All MMWR HTML versions of articles are electronic conversions from ASCII text into HTML. This conversion may have resulted in character translation or format errors in the HTML version. Users should not rely on this HTML document, but are referred to the electronic PDF version and/or the original MMWR paper copy for the official text, figures, and tables. An original paper copy of this issue can be obtained from the Superintendent of Documents, U.S. Government Printing Office (GPO), Washington, DC 20402-9371; telephone: (202) 512-1800. Contact GPO for current prices. **Questions or messages regarding errors in formatting should be addressed to mmwrq@cdc.gov.Page converted: 09/19/98 |
|||||||||
This page last reviewed 5/2/01
|