 |
|
|
|
|
|
|
| ||||||||||
|
|
|
|
|
|
|
||||
| ||||||||||
|
|
|
|
|
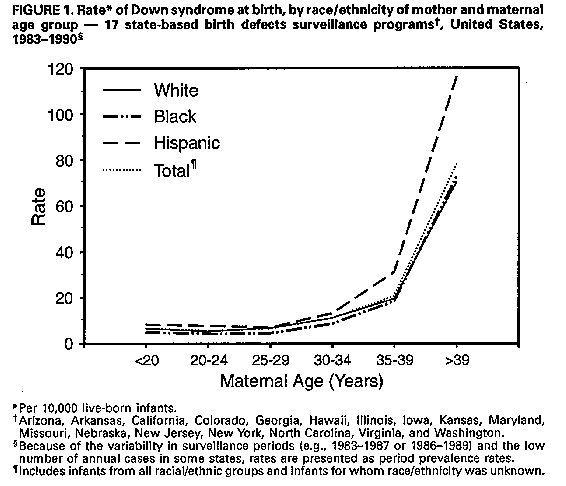
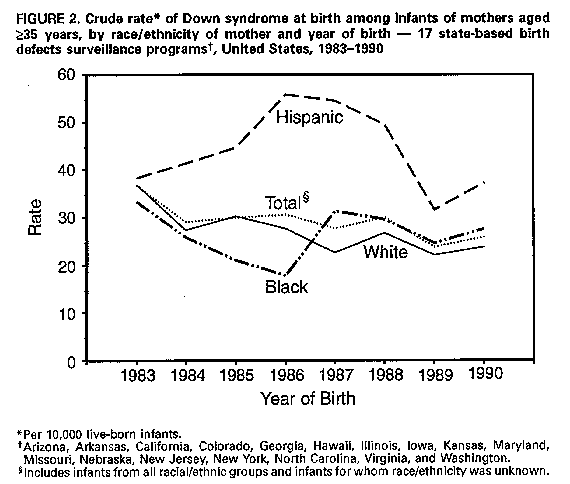
Persons using assistive technology might not be able to fully access information in this file. For assistance, please send e-mail to: mmwrq@cdc.gov. Type 508 Accommodation and the title of the report in the subject line of e-mail. Down Syndrome Prevalence at Birth -- United States, 1983-1990Down syndrome * (DS) (trisomy 21) is one of the most serious and frequently reported birth defects among live-born infants and an important cause of mental retardation (1). The prevalence of DS at birth increases with increasing maternal age (2). Because national population-based estimates of DS have been limited, CDC analyzed data from 17 states with population-based birth defects surveillance programs to determine the birth prevalence of DS and describe trends in DS in the United States during 1983-1990. This report summarizes the findings of the analysis. All 17 state surveillance programs obtained data for live-born infants with DS (gestational age: greater than or equal to 20 weeks). Fourteen states also obtained data for stillborn infants with DS (gestational age: greater than or equal to 20 weeks); in three states, data for stillborn infants were not available. Data for all infants were categorized by 5-year maternal age groups. For 10 (Colorado, Illinois, Kansas, Maryland, Missouri, Nebraska, New Jersey, New York, North Carolina, and Virginia) of the 17 state surveillance programs, cases were identified from reports (based on birth certificates and medical records) submitted by physicians or other employees of hospitals, clinics, and other health-care facilities. For the other seven programs (Arizona, Arkansas, California, Georgia, Hawaii, Iowa, and Washington), trained surveillance staff identified cases by systematic review of medical and other records at hospitals, clinics, and other health-care facilities. State DS rates were calculated for the surveillance period 1983-1990; however, the number of years for which data were available during the period varied by state. Because of this variability and the low number of annual cases in some states, tabular rates are presented as period prevalence rates. Data are presented for black, white, and Hispanic infants only; numbers for other racial groups were too small for meaningful analysis. To compensate for differing distributions of maternal age among racial/ethnic groups, rates were adjusted to the age distribution of the mothers of all infants born in the 17 states. Chronologic trends in rates were analyzed by linear regression on the natural logarithms of the annual rates. During 1983-1990, these 17 states reported a total of 7.8 million live-born infants, representing 25% of all U.S. live-born infants. Overall, the birth prevalence rate of DS during 1983-1990 for these states was 9.2 cases per 10,000 live-born infants (Table_1); rates varied widely among the states (range: 5.9 {Kansas} to 12.3 {Colorado}). Rates differed significantly by racial/ethnic group (p less than 0.001, Chi-square test): for Hispanic infants, the rate of DS was 11.8; for white infants, 9.2; and for black infants, 7.3. For all racial/ethnic groups, the prevalence of DS increased with increasing maternal age (Figure_1). Maternal-age- specific rates for black infants were significantly lower than those for white infants for all 5-year maternal age groups less than 35 years (p less than 0.01, Chi-square test); the rates for blacks and whites were similar for all maternal age groups greater than or equal to 35 years. The maternal-age-specific rates for Hispanic infants were significantly higher (p less than 0.05, Chi-square test) than the rates for white and black infants of all mothers except those in the 25-29-year age group; in this age group, rates for Hispanics and whites were similar. From 1983 to 1990, the crude prevalence of DS for all races combined was virtually unchanged for infants of mothers aged less than 35 years. The rate for white infants was stable, while the rates decreased significantly for black infants (from 7.1 in 1983 to 5.3 in 1990 {p less than 0.05}) and Hispanic infants (from 9.4 in 1983 to 6.4 in 1990 {p less than 0.05}). For infants of mothers aged greater than or equal to 35 years, the crude prevalence of DS for all races combined declined significantly from 36.6 in 1983 to 25.9 in 1990 (p less than 0.05) (Figure_2). The rate for white infants declined significantly from 36.8 in 1983 to 23.9 in 1990 (p less than 0.05). Although the rates declined for black infants (from 33.2 in 1983 to 27.4 in 1990) and Hispanic infants (from 38.3 in 1983 to 37.2 in 1990), these trends were not statistically significant. Reported by: T Flood, MD, Office of Chronic Disease Epidemiology, Arizona Dept of Health Svcs. M Brewster, PhD, Arkansas Reproductive Health Monitoring System. J Harris, MD, California Birth Defects Monitoring Program, California State Dept of Health Svcs. S Keefer, MS, Colorado Dept of Health. R Merz, MS, Hawaii Birth Defects Monitoring Program, Hawaii Dept of Health. H Howe, PhD, Div of Epidemiologic Studies, Illinois Dept of Public Health. D Krishnamurti, MS, Dept of Pediatrics, Univ of Iowa Hospitals and Clinics, Iowa City. C Domingo, MS, Kansas Svcs for Children with Special Health Care Needs, Topeka. S Panny, MD, Div of Hereditary Disorders, Maryland Dept of Health and Mental Hygiene. J Bakewell, Bur of Health Data Analysis, Missouri Dept of Health. M Seeland, Health Data Support Div, Nebraska State Dept of Health. P Costa, MA, Birth Defects Surveillance Program, Special Child Health Svcs, New Jersey State Dept of Health. C Olsen, PhD, Bur of Environmental Epidemiology and Occupational Health, New York State Dept of Health. R Meyer, PhD, State Center for Health and Environmental Statistics, North Carolina Dept of Environment, Health, and Natural Resources. L Ploughman, PhD, Dept of Human Genetics, Medical College of Virginia, Richmond. C Hill, Birth Defects Registry, Washington Dept of Health. Birth Defects and Genetic Diseases Br, Div of Birth Defects and Developmental Disabilities, National Center for Environmental Health, CDC. Editorial NoteEditorial Note: The primary sources of information about the national birth prevalence of DS in the United States have been CDC's national Birth Defects Monitoring Program (BDMP) and birth certificate data from CDC's National Center for Health Statistics (NCHS); both sources have important limitations. The BDMP, a hospital-based surveillance system, monitors birth defects in newborns using information obtained from discharge abstracts of participating hospitals (3); because some types of birth defects may not be diagnosed until after the neonatal period, case reporting is sometimes incomplete. NCHS reports population-based DS rates derived from U.S. birth certificates (4) (which often represent false-negative and false-positive DS cases); rates based on birth certificates generally are underestimated (5). The state-based birth defects surveillance systems described in this report provide population-based data that can be used to monitor national trends in major birth defects. Although the findings in this report were calculated for only 17 states, the combined DS rate for 1983-1990 was similar to the national rate reported by the BDMP (9.1 cases per 10,000 births) for the same period. In comparison, the DS rate reported by NCHS based on 1990 birth certificates was 5.4 (4). In 1989, reporting of birth certificate data was standardized based on recommendations from NCHS. Differences in state-specific DS rates are related in part to differences between active and passive case ascertainment. In the states that used trained surveillance staff to identify cases (active case ascertainment), the combined rate of DS was 10.5 cases per 10,000 live-born infants, compared with 8.7 in states that relied on submission of cases by physicians and hospitals (passive case ascertainment). Some of the variability in state DS rates also may be related to differences in the use of prenatal diagnosis services (6). Racial and ethnic differences in DS rates may be related to differential use of prenatal diagnosis services. A recent U.S. study indicated that the racial composition of women who use prenatal screening services varies from the racial composition of women aged 15-54 in the U.S. population (7); however, no data on ethnicity were presented. In contrast, an Ohio study found no significant difference between black and white women in usage rates of prenatal diagnosis services (8). A study in metropolitan Atlanta indicated that use of prenatal diagnosis services and abortion significantly reduced the birth prevalence of DS among white women but not among women of other races (9). The substantially higher rates of DS among Hispanic infants of mothers aged greater than or equal to 35 years during 1983-1990 may reflect less frequent use of prenatal diagnosis services among Hispanic mothers. A study in a Hispanic population in Los Angeles County found a high birth prevalence of DS (16.9 cases per 10,000 births) among Hispanic infants and relatively low usage rate of prenatal diagnosis services (12%) among Hispanic women aged greater than 34 years with DS infants or fetuses (10). In addition, variations in the DS rate for Hispanics during 1983-1990 reflect fluctuations in annual rates for New York and California -- states that reported 75% of DS cases among Hispanics during this period. The lower rate of DS among black infants may reflect differential underdiagnosis of the defect at birth. States with birth defects surveillance programs based on physician or hospital reports (often from the neonatal period only) generally had greater differences in DS rates between blacks and whites compared with states that used trained surveillance staff to examine medical records after the neonatal period, when the diagnosis is more likely to be accurate. The significant decline in crude DS rates among infants of women aged greater than or equal to 35 years during 1983-1990 may be attributed to the increasing use of prenatal diagnosis since 1972 (7) to detect DS and other major birth defects. However, research is needed to measure the true impact of prenatal diagnosis on DS birth prevalence rates. Factors that contributed to the significant decline in crude DS rates for infants of black and Hispanic women aged less than 35 years are unknown; women in this age group generally use prenatal diagnosis services less frequently than older women, and the maternal age distribution within this group varied only slightly during 1983-1990. The findings in this report are subject to at least three limitations. First, because data were not available from all 50 states, these rates may not be nationally representative. However, because the 17 states in this report are from all regions of the country and represent one fourth of all U.S. infants born during 1983-1990, the aggregated prevalence rate should be similar to the true national prevalence rate during that period. Second, although DS is usually readily diagnosed at birth, some underreporting probably occurs during the neonatal period. Therefore, the true birth prevalence rate for DS is probably slightly higher than the rate in this report. Third, only five (29%) of the 17 states reported data for the complete 8-year surveillance period; however, the aggregated prevalence rates for all racial/ethnic groups except Hispanics were only slightly affected by individual state trends in DS rates. This report demonstrates that aggregated data from state-based birth defects surveillance programs can be used to monitor national population-based trends in DS and other serious birth defects. A national health objective for the year 2000 (objective 22.2) is to identify and create national data sources to measure progress toward each of the year 2000 national health objectives, including those for birth defects and developmental disabilities. State health departments and other health organizations also can use data from such surveillance programs to plan and evaluate service delivery for infants with DS or other birth defects. References
AE, Rimoin DL, eds. Principles and practice of medical genetics. Vol 1. 2nd ed. Edinburgh: Churchill Livingstone, 1990:495- 511. 2. Hook EB. Epidemiology of Down syndrome. In: Pueschel SM, Rynders JE, eds. Down syndrome: advances in biomedicine and the behavioral sciences. Cambridge, Massachusetts: Ware Press, 1982:11- 88. 3. Edmonds LD, Layde PM, James LM, Flynt JW, Erickson JD, Oakley GP Jr. Congenital malformations surveillance: two American systems. Int J Epidemiol 1981;10:247-52. 4. NCHS. Advance report of maternal and infant health data from the birth certificate, 1990. Hyattsville, Maryland: US Department of Health and Human Services, Public Health Service, CDC, 1993; DHHS publication no. (PHS)93-1120. (Monthly vital statistics report; vol 42, no. 2, suppl). 5. Hexter AC, Harris JA, Roeper P, Croen LA, Krueger P, Gant D. Evaluation of the hospital discharge diagnoses index and the birth certificate as sources of information on birth defects. Public Health Rep 1990;105:296-306. 6. Crandall BF, Lebherz TB, Tabsh K. Maternal age and amniocentesis: should this be lowered to 30 years? Prenat Diagn 1986;6:237-42. 7. Meaney FJ, Riggle SM, Cunningham GC, Stern KS, Davis JG. Prenatal genetic services: toward a national data base. Clin Obstet Gynecol 1993;36:510-20. 8. Naber JM, Huether CA, Goodwin BA. Temporal changes in Ohio amniocentesis utilization during the first twelve years (1972- 1983), and frequency of chromosome abnormalities observed. Prenat Diagn 1987;7:51-65. 9. Krivchenia E, Huether CA, Edmonds LD, May DS, Guckenberger S.
Comparative epidemiology of Down syndrome in two United States
populations, 1970-1989. Am J Epidemiol 1993;137:815-28.
10. Wilson MG, Chan LS, Herbert WS. Birth prevalence of Down
syndrome in a predominantly Latino population: a 15-year study.
Teratology 1992;45:285-92.
TABLE 1. Maternal-age--adjusted prevalence * of Down syndrome (DS) at birth, by region/state and race/ethnicity of mother
-- 17 state-based birth defects surveillance programs, United States, 1983-1990 +
============================================================================================================================================
                                              White        Black       Hispanic       Total
                                            -----------  -----------  ------------  -----------
                Surveillance  No. live-born  No.          No.           No.          No.
Region/State       period       infants &   cases  Rate  cases  Rate   cases  Rate  cases  Rate
-----------------------------------------------------------------------------------------------
Northeast
  New Jersey     1985-1990       687,387      389   8.3    74    6.5    78    9.0    625   9.1
  New York       1983-1990     2,157,413    1,315   9.4   332    8.0   400   11.6  2,121   9.8
  Total                        2,844,800    1,704   9.1   406    7.6   478   11.1  2,746   9.6

North Central
  Illinois       1989-1990       375,896      179   6.8    32     4.5   35    8.1    246   6.5
  Iowa           1983-1990       319,696      316  11.2    10    14.2   NA @  NA     344  10.8
  Kansas         1983-1990       313,570      161   6.6    10     4.2    9    8.3    184   5.9
  Missouri       1983-1987       379,277      287  10.3    29     6.7   NA    NA     321   8.5
  Nebraska       1983-1990       198,601      172  10.4     2     2.1    5   11.3    181   9.1
  Total                        1,587,040    1,115   9.1    83     5.5   49    8.4  1,276   8.0

South
  Arkansas       1983-1989       106,497       62   8.9    24    10.4   NA    NA       88   8.3
  Georgia        1983-1990       269,332      167   9.8   100    10.1   NA    NA      272  10.1
  Maryland       1984-1990       437,704      247   8.1    60     5.8   NA    NA      327   7.5
  North Carolina 1984-1990       661,577      370   8.8   107     6.8    3    9.7     500   7.6
  Virginia       1987-1989       264,565      167   8.6    40     7.9   NA    NA      211   8.0
  Total                        1,739,675    1,013   8.7   331     7.6    3    9.7   1,398   8.0

West
  Arizona        1986-1989       256,749      138   9.7     9    10.6   75   11.5     253   9.8
  California     1983-1988     1,028,266      548   9.4    46     7.0  321   13.4   1,111  10.8
  Colorado       1989-1990       106,172       97  11.5     1     1.5   29   19.4     131  12.3
  Hawaii **      1989-1990        39,768        7   5.7     0     0      0    0        29   7.3
  Washington     1987-1989       217,808      210  11.9     6     8.8   12   13.3     246  11.3
  Total                        1,648,763    1,000  10.0    62     7.1  437   13.3   1,770  10.7

Total                          7,820,278    4,832   9.2   882     7.3  967   11.8   7,190   9.2
-----------------------------------------------------------------------------------------------
 * Per 10,000 live-born infants. Data for racial/ethnic groups were adjusted to the age distribution of the mothers of all infants born in
   the 17 states; rates for all races combined were not adjusted.
 + Because of the variability in surveillance periods and the low number of annual cases in some states, data are presented as period
   prevalence rates.
 & Includes infants from all racial/ethnic groups and infants for whom race/ethnicity was unknown. Infants of women with unknown
   maternal age were excluded.
 @ Not available.
** For 1989 and 1990, data were available only for the number of DS cases by race/ethnicity and the number of live-born infants.  Period
   prevalence rates were estimated using the proportion of live-born infants by race/ethnicity in 1988.
============================================================================================================================================
Return to top. Disclaimer All MMWR HTML versions of articles are electronic conversions from ASCII text into HTML. This conversion may have resulted in character translation or format errors in the HTML version. Users should not rely on this HTML document, but are referred to the electronic PDF version and/or the original MMWR paper copy for the official text, figures, and tables. An original paper copy of this issue can be obtained from the Superintendent of Documents, U.S. Government Printing Office (GPO), Washington, DC 20402-9371; telephone: (202) 512-1800. Contact GPO for current prices. **Questions or messages regarding errors in formatting should be addressed to mmwrq@cdc.gov.Page converted: 09/19/98 |
|||||||||
This page last reviewed 5/2/01
|