 |
|
|
|
|
|
|
| ||||||||||
|
|
|
|
|
|
|
||||
| ||||||||||
|
|
|
|
|
Persons using assistive technology might not be able to fully access information in this file. For assistance, please send e-mail to: mmwrq@cdc.gov. Type 508 Accommodation and the title of the report in the subject line of e-mail. Medical-Care Spending -- United StatesOne aspect of health-care reform is the role of prevention in controlling costs. To evaluate data on medical spending by disease category, the National Public Services Research Institute examined data from the 1987 National Medical Expenditure Survey (NMES-2), with emphasis on the Medical Provider Survey supplement. This report presents the findings of that analysis. The NMES-2 was a population-based longitudinal survey in which data were gathered for the civilian, noninstitutionalized U.S. population for January 1-December 31, 1987 (the most recent year for which complete data were available), about sociodemographic factors; use of medical care; and medical-care expenditures for hospital inpatient, outpatient, and emergency department care; physician and allied health professional services; prescribed medication; emergency transport; and medical supplies and equipment (1). The Medical Provider Survey supplement provided confirmation of self-reported medical-care costs and information about costs that survey respondents were unable to report. The analysis presented in this report was restricted to the household survey sample of the NMES-2, a subset of the data that included face-to-face interviews of approximately 35,000 persons in 14,000 households regarding use of and expenses for health services during 1987. Not included in this analysis were dental costs, mental health services without a medical component, and administrative costs and overhead for insurance claims. All medical expenditure estimates were adjusted to December 1993 dollars using medical-care spending per capita for all medical treatment as the inflator. Cardiovascular disease accounted for $80 billion (14%) of the $572 billion (in 1993 dollars) in medical spending for services other than nursing-home care, dental care, and insurance claims processing (Table_1). Injuries accounted for $69 billion (12%), including spending attributed to longer term musculoskeletal deterioration resulting from injury. Spending for each of these categories exceeded that for cancer and for genitourinary disease (including kidney disease) ($49 billion each). Medical spending for well care, including preventive care, was 3% of the total costs ($17 billion). Excluding live births, injury was the largest contributor to health-care expenditures for persons aged 5-49 years (Figure_1). Injury was the second largest contributor to health-care costs among persons aged less than 5 years and greater than 85 years; cardiovascular disease and cancer were the two largest contributors for those aged 50-85 years. Medical spending on injury treatment averaged $284 per person. Injury costs increased for those aged greater than 65 years, with the highest per capita spending for injury being for those aged greater than or equal to 70 years (Figure_2). However, increases in spending for cardiovascular disease and cancer for those age groups were higher than those for injury. Inpatient hospital costs were the largest component of medical spending ($329 billion {57%}), with ambulatory-care visits contributing $90 billion (16%) and hospital outpatient services, $66 billion (11%). Prescriptions were the fourth largest component ($38 billion {7%}). Home-health-care ($20 billion), emergency department ($15 billion), and other medical ($15 billion) costs each contributed approximately 3%. By type of care, cardiovascular disease accounted for 15% of the hospital costs; cancer, 11%; and injury, 10% (Table_2). Cardiovascular disease also contributed the most in prescription costs (27%) and home-health-care costs (27%) (Table_2). Injury costs were the largest component of spending for emergency department visits (46%), hospital outpatient visits (16%), and ambulatory care (16%). Of the ambulatory-care visit costs, 14% were for well care. Reported by: TR Miller, PhD, DC Lestina, MS Galbraith, Children's Safety Network Economics and Insurance Resource Center, National Public Svcs Research Institute, Landover, Maryland. DC Viano, PhD, Biomedical Science Dept, General Motors Research Laboratories, Warren, Michigan. Div of Unintentional Injury Prevention, National Center for Injury Prevention and Control, CDC. Editorial NoteEditorial Note: The findings in this report indicate that the largest source of health-care spending in the U.S. population is cardiovascular disease. This reflects the high prevalence of coronary or ischemic heart disease, which is the leading cause of death in the United States. However, the influences and risk factors for cardiovascular disease potentially can be modified through public policy and preventive practice (e.g., smoking and diet). Injury, the leading cause of death for persons in all age groups from 1 year through 44 years (2), is also a large contributor to health-care costs. The data in this report corroborate the finding that medical-care payments for injury are the second leading source of direct medical costs in the noninstitutionalized U.S. population (3). In addition, the cost burden for injuries is spread across all age groups (4). Because direct medical costs do not include the reduced or lost productivity in the working-age population, this analysis does not adequately present the total economic burden attributable to injury. This study is subject to at least four limitations. First, the data underestimate total direct medical costs because institutionalized persons, military members and their families, and homeless persons were excluded. Second, nursing home costs -- approximately $60 billion annually across all disease categories (5) -- also were omitted from this analysis. Third, the unitary, systems-based categorization of each illness or injury used in this analysis masks the potential importance of some categories, such as infectious diseases. Infectious diseases were subsumed under the injury or system category that they affect; for example, pulmonary infections tended to be classified in the respiratory category, urinary tract infections in the genitourinary category, and human immunodeficiency virus (HIV) infection and acquired immunodeficiency syndrome (AIDS) in the categories of affected systems or as miscellaneous. Similarly, spending for outpatient visits for complications of diabetes mellitus may appear as cardiovascular disease costs. Fourth, the direct costs related to infectious diseases are underestimated because the incidence of HIV infection and AIDS resulted in substantially increased spending after 1987 (6). Numerous prevention measures reduce direct medical costs while saving lives. For example, approximately $2 are saved in medical-care costs for every $1 spent on child-safety seats (7); from 1982 through 1990, child-safety seats and safety belts saved the lives of approximately 1300 infants and toddlers in the United States (8). The data in this report underscore the impact of different disease categories and the need to evaluate the relative effectiveness and the cost-effectiveness of interventions that prevent and control the effects of disease; such data can assist in making decisions regarding treatment and prevention programs (9). References
Table_1 Note: To print large tables and graphs users may have to change their printer settings to landscape and use a small font size. TABLE 1. Medical expenditures, by diagnostic category, * -- United States, 1987 + ===================================================================================================== Diagnostic category Medical expenditures & % Total costs @ ----------------------------------------------------------------------- Cardiovascular $ 79.6 13.9 Injury and long-term effects 69.1 12.1 Neoplasm 49.6 8.7 Genitourinary 49.3 8.7 Pregnancy/ Birth-related 39.7 6.9 Respiratory 38.3 6.7 Digestive 35.9 6.3 Musculoskeletal ** 27.7 4.8 Other circulatory diagnosis 20.2 3.5 Mental health ++ 19.3 3.4 Well care 17.4 3.0 Congenital anomalies 8.7 1.5 Medical misadventure 6.9 1.2 Miscellaneous && 110.6 19.3 Total 572.3 100.0 ----------------------------------------------------------------------- * International Classification of Diseases, Ninth Revision, Clinical Modification (ICD-9-CM) codes used to define diagnostic categories: Cardiovascular: 390-429, 451-459; Injury and long-term effects: 800-994, 294.0, 304.6, 310.2, 344.0, 344.1, 366.2, 507.1, 508.0, 521.2, 525.1, 719.0, 719.5, 722.0-722.2, 724.2, 724.3, 724.5, 724.6, 724.8, 780.0, 799.0, V71.3-V71.5; Neoplasms: 140-239, V58.0, V58.1; Genitourinary: 580-629, 250.0, V56; Pregnancy and birth- related conditions, including live births and normal delivery: 630-674, V22.2; Respiratory: 460-519, 786.0 (excluding codes used for the injury diagnostic category); Digestive: 520-579 (excluding codes used for the injury diagnostic category); Musculoskeletal: 710-739 (excluding codes used for the injury diagnostic category); Other Circulatory: 430-450; Mental disease: 290-319 (excluding codes used for the injury diagnostic category); Well care: V40-V49, V70-V82 (excluding codes used for the injury diagnostic category); Congenital anomalies: 740-779; Medical misadventure: 995-999; and Miscellaneous: all other ICD-9-CM codes. + Adjusted to December 1993 dollars. Excludes nursing home, dental, and insurance claims processing costs. & In billions. @ Costs of incidents without diagnoses were allocated in proportion to cost of known diagnoses. ** Musculoskeletal problems traceable to earlier injury were classified as injury. ++ Excludes mental health services without a medical component. && Miscellaneous includes carpal tunnel syndrome, endocrine disorders other than diabetes, anemia, conditions that were not clearly attributable to an underlying cause (e.g., unconscious, headache, and fitting and adjustment of prostheses), cataracts, and glaucoma. ===================================================================================================== Return to top. Figure_1 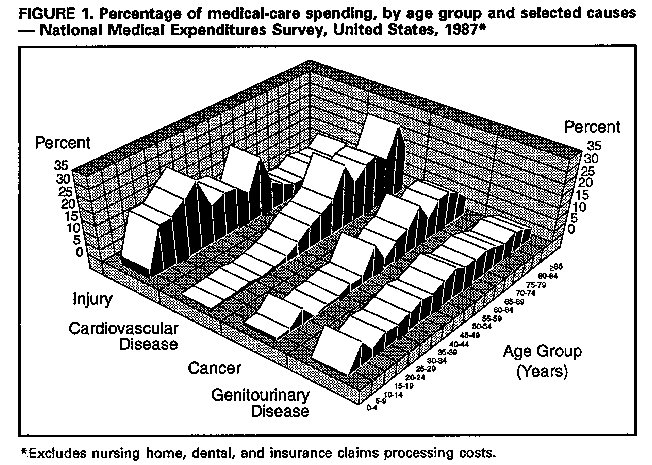 Return to top. Figure_2 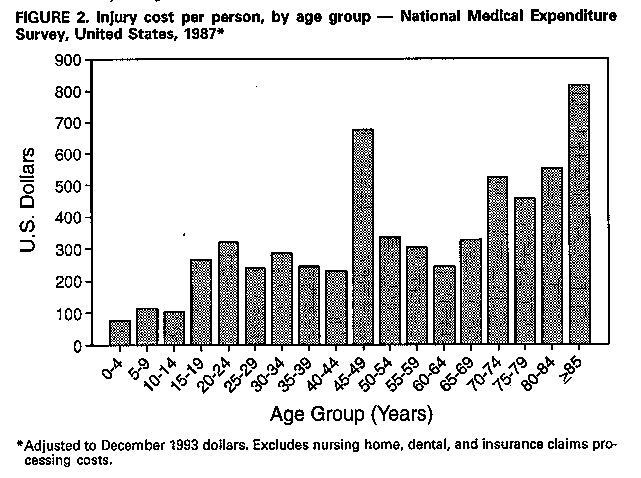 Return to top. Table_2 Note: To print large tables and graphs users may have to change their printer settings to landscape and use a small font size.
TABLE 2. Percentage of expenditures for different types of care, by diagnostic
category * -- United States, 1987 +
=========================================================================================================
                       Hospital
                       inpatient    Emergency   Outpatient    Ambulatory    Home
Diagnostic category      care      department      care         visits      care  Prescriptions   Other
-------------------------------------------------------------------------------------------------------
Cardiovascular           15.1          4.6          9.6           7.3        27.3      3.5         27.1
Injury and
  long-term effects      10.1         45.9         16.1          16.4         7.3      7.7          3.4
Neoplasm                 10.7         10.2         11.3           4.4         7.7      1.8          3.0
Genitourinary             8.8          5.7         12.6           6.4        10.4      4.9          7.5
Pregnancy/
  Birth-related          10.2          1.2          0.5           4.1         0.0      0.1          0.2
Respiratory               6.2         10.7          6.2           7.7         3.0      5.0         10.5
Digestive                 8.4          4.4          4.2           2.8         1.0      0.8          4.9
Musculoskeletal &         3.3          2.7          7.8           6.4        11.9      3.5          7.3
Other circulatory         5.1          0.9          1.2           1.0         3.4      0.9          1.6
Mental health @           3.2          1.2          2.6           5.5         3.1      0.1          3.8
Well care                 0.1         <0.1          1.5          13.6         1.8      1.0          1.4
Congenital anomalies      2.1          0.2          1.0           0.5         0.3      0.4          1.2
Medical misadventure      1.3          2.1          1.4           1.0         0.3      0.5          1.1
Miscellaneous **         14.5         18.8         24.1          22.9        22.5     69.8         27.0

Total                   100.0        100.0        100.0         100.0       100.0    100.0        100.0
-------------------------------------------------------------------------------------------------------

 * International Classification of Diseases, Ninth Revision, Clinical Modification (ICD-9-CM)
   codes used to define diagnostic categories: Cardiovascular: 390-429, 451-459; Injury and
   long-term effects: 800-994, 294.0, 304.6, 310.2, 344.0, 344.1, 366.2, 507.1, 508.0, 521.2, 525.1,
   719.0, 719.5, 722.0-722.2, 724.2, 724.3, 724.5, 724.6, 724.8, 780.0, 799.0, V71.3-V71.5;
   Neoplasms: 140-239, V58.0, V58.1; Genitourinary: 580-629, 250.0, V56; Pregnancy and birth-
   related conditions, including live births and normal delivery: 630-674, V22.2; Respiratory:
   460-519, 786.0 (excluding codes used for the injury diagnostic category); Digestive: 520-579
   (excluding codes used for the injury diagnostic category); Musculoskeletal: 710-739
   (excluding codes used for the injury diagnostic category); Other Circulatory: 430-450; Mental\
   disease: 290-319 (excluding codes used for the injury diagnostic category); Well care:
   V40-V49, V70-V82 (excluding codes used for the injury diagnostic category); Congenital
   anomalies: 740-779; Medical misadventure: 995-999; and Miscellaneous: all other ICD-9-CM
   codes.
 + Adjusted to December 1993 dollars. Excludes nursing home, dental, and insurance claims
   processing costs.
 & In billions.
 @ Musculoskeletal problems traceable to earlier injury were classified as injury.
** Miscellaneous includes carpal tunnel syndrome, endocrine disorders other than diabetes,
   anemia, conditions that were not clearly attributable to an underlying cause (e.g.,
   unconscious, headache, and fitting and adjustment of prostheses), cataracts, and
   glaucoma.
=========================================================================================================
Return to top. Disclaimer All MMWR HTML versions of articles are electronic conversions from ASCII text into HTML. This conversion may have resulted in character translation or format errors in the HTML version. Users should not rely on this HTML document, but are referred to the electronic PDF version and/or the original MMWR paper copy for the official text, figures, and tables. An original paper copy of this issue can be obtained from the Superintendent of Documents, U.S. Government Printing Office (GPO), Washington, DC 20402-9371; telephone: (202) 512-1800. Contact GPO for current prices. **Questions or messages regarding errors in formatting should be addressed to mmwrq@cdc.gov.Page converted: 09/19/98 |
|||||||||
This page last reviewed 5/2/01
|