 |
|
|
|
|
|
|
| ||||||||||
|
|
|
|
|
|
|
||||
| ||||||||||
|
|
|
|
|
Persons using assistive technology might not be able to fully access information in this file. For assistance, please send e-mail to: mmwrq@cdc.gov. Type 508 Accommodation and the title of the report in the subject line of e-mail. Abortion Surveillance: Preliminary Data -- United States, 1991For 1991, CDC received data about legal induced abortions from 52 reporting areas (the 50 states, New York City, and the District of Columbia). This report presents preliminary data for 1991. In 1991, 1,388,937 legal induced abortions were reported to CDC (Table_1), a decrease of 2.8% from the number reported in 1990 (1), and the number of live births decreased by 1.2%. As a result, the national abortion ratio declined from 345 legal induced abortions per 1000 live births in 1990 to 339 per 1000 in 1991. The national abortion rate (the number of legal induced abortions per 1000 women aged 15-44 years) remained stable at 24. As in previous years, 92% of women who had a legal induced abortion were residents of the state in which the procedure was performed. Most women who obtained legal induced abortions in 1991 were aged less than 25 years, white, and unmarried (Table_1). When compared with women who obtained abortions in 1990, a slightly lower proportion of women who had abortions in 1991 had had no previously live-born infants (49.2% versus 47.5%, respectively). Curettage (suction and sharp) remained the primary abortion procedure (approximately 99% of all such procedures). As in previous years, more than half (52%) of legal induced abortions were performed during the first 8 weeks of gestation and approximately 89% during the first 12 weeks. Reported by: Statistics and Computer Resources Br, Div of Reproductive Health, National Center for Chronic Disease Prevention and Health Promotion, CDC. Editorial NoteEditorial Note: The number of legal induced abortions performed in the United States has remained relatively stable since 1980, varying each year by 5% or less. In 1991, the national ratio of abortions to live births was again lower than for any year since 1977, indicating that a greater proportion of pregnancies ended in a live birth (Figure_1) (2). The national abortion rate has fluctuated minimally since 1980 (Figure_1). Although the national fertility rate (live births per 1000 women of reproductive age) was slightly lower in 1991 than in 1990, it was higher than the rate for any other year since 1972 (3). The total number of legal induced abortions was available for all 52 reporting areas. However, approximately 27% of abortions were reported from states that do not have centralized reporting; these areas could provide no information on the characteristics of women obtaining abortions. Because the number of states that report such information varies annually, temporal comparisons should be made with caution. Abortion and birth statistics both are essential to provide estimates of pregnancy rates. In addition, abortion and pregnancy rates can be used to evaluate the effectiveness of family planning programs and programs to prevent unintended pregnancy. The use of such information for these purposes is constrained, however, because of limitations in the completeness of reporting by states of the number and characteristics of women who have legal induced abortions. References
TABLE 1. Reported number of legal induced abortions, abortion ratios *, abortion rates +,
and characteristics of women who obtained legal induced abortions -- United States,
selected years, 1972-1991
=====================================================================================================
                                                     Year
                 ----------------------------------------------------------------------------------
Characteristic    1972     1976      1980       1985       1988       1989       1990       1991 &
---------------------------------------------------------------------------------------------------
Reported no.
 legal induced
 abortions       586,760  988,267  1,297,606  1,328,570  1,371,285  1,396,658  1,429,577  1,388,937
Abortion ratio     180      312       359        354        352        346        345        339
Abortion rate       13       21        25         24         24         24         24         24

                                             Percentage distribution @
                 ----------------------------------------------------------------------------------
Residence
  In-state        56.2     90.0      92.6       92.4       91.4       91.0       91.8       91.8
  Out-of-state    43.8     10.0       7.4        7.6        8.6        9.0        8.2        8.2
Age (yrs)
   <=19           32.6     32.1      29.2       26.3       25.3       24.2       22.4       21.0
  20-24           32.5     33.3      35.5       34.7       32.8       32.6       33.2       34.2
   >=25           34.9     34.6      35.3       39.0       41.9       43.2       44.4       44.8
Race
  White           77.0     66.6      69.9       66.6       64.4       64.2       64.8       64.3
  All others      23.0     33.4      30.1       33.4       35.6       35.8       35.2       35.7
Marital status
  Married         29.7     24.6      23.1       19.3       20.3       20.1       21.7       20.3
  Unmarried       70.3     75.4      76.9       80.7       79.7       79.9       78.3       79.7
No. live
 births **
    0             49.4     47.7      58.4       56.3       52.4       52.2       49.2       47.5
    1             18.2     20.7      19.4       21.6       23.4       23.6       24.4       25.2
    2             13.3     15.4      13.7       14.5       16.0       15.9       16.9       17.4
    3              8.7      8.3       5.3        5.1        5.6        5.7        6.1        6.5
  >=4             10.4      7.9       3.2        2.5        2.6        2.6        3.4        3.4
Type of
 procedure
  Curettage       88.6     92.8      95.5       97.5       98.6       98.8       98.8       98.9
    Suction       65.2     82.6      89.8       94.6       95.1       97.1       96.0       98.0
    Sharp         23.4     10.2       5.7        2.9        3.5        1.7        2.8        0.9
  Intrauterine
   instillation   10.4      6.0       3.1        1.7        1.1        0.9        0.8        0.7
  Other ++         1.0      1.2       1.4        0.8        0.3        0.3        0.4        0.4
Weeks of
 gestation
    <=8           34.0     47.0      51.7       50.3       48.7       49.8       51.6       52.3
   9-10           30.7     28.1      26.2       26.6       26.4       25.8       25.3       25.4
  11-12           17.5     14.4      12.2       12.5       12.7       12.6       11.7       11.6
  13-15            8.4      4.5       5.1        5.9        6.6        6.6        6.4        5.9
  16-20            8.2      5.1       3.9        3.9        4.5        4.2        4.0        3.7
   >=21            1.2      0.9       0.9        0.8        1.1        1.0        1.0        1.1
---------------------------------------------------------------------------------------------------
 * Per 1000 live births.
 + Per 1000 women aged 15-44 years.
 & Preliminary data.
 @ Excludes unknown values. Percentage distributions are based on data from all areas
   reporting a given characteristic.
** For 1972 and 1976, data indicate number of living children.
++ Includes hysterotomy and hysterectomy.
=====================================================================================================
Return to top. Figure_1 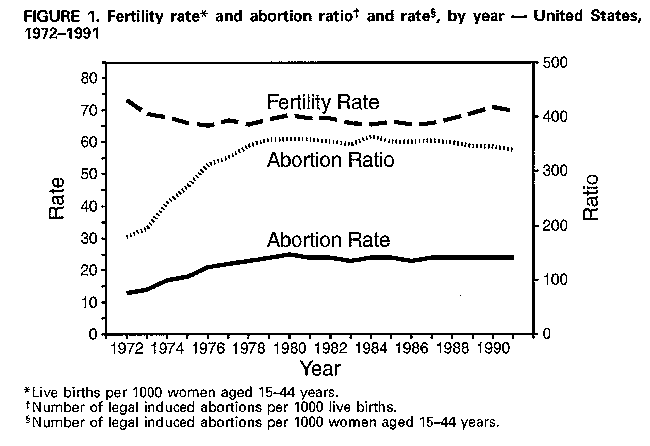 Return to top. Disclaimer All MMWR HTML versions of articles are electronic conversions from ASCII text into HTML. This conversion may have resulted in character translation or format errors in the HTML version. Users should not rely on this HTML document, but are referred to the electronic PDF version and/or the original MMWR paper copy for the official text, figures, and tables. An original paper copy of this issue can be obtained from the Superintendent of Documents, U.S. Government Printing Office (GPO), Washington, DC 20402-9371; telephone: (202) 512-1800. Contact GPO for current prices. **Questions or messages regarding errors in formatting should be addressed to mmwrq@cdc.gov.Page converted: 09/19/98 |
|||||||||
This page last reviewed 5/2/01
|