 |
|
|
|
|
|
|
| ||||||||||
|
|
|
|
|
|
|
||||
| ||||||||||
|
|
|
|
|
Persons using assistive technology might not be able to fully access information in this file. For assistance, please send e-mail to: mmwrq@cdc.gov. Type 508 Accommodation and the title of the report in the subject line of e-mail. Deaths Resulting from Firearm- and Motor-Vehicle-Related Injuries - - United States, 1968-1991Injury is the leading cause of death for persons aged 1-44 years in the United States. More than half (55%) of all injury-related deaths are caused by motor vehicles and firearms (1). Although the number of deaths from motor-vehicle crashes has exceeded those from firearms, since 1968, differences in the number of deaths have declined: from 1968 through 1991, motor-vehicle- related deaths decreased by 21% (from 54,862 to 43,536) while firearm-related deaths increased by 60% (from 23,875 to 38,317) (1). Based on these trends, by the year 2003, the number of firearm-related deaths will surpass the number of motor-vehicle crashes, and firearms will become the leading cause of injury-related death (Figure_1). This report compares trends and patterns of deaths resulting from firearm- and motor-vehicle- related injuries in the United States from 1968 through 1991. Information about firearm- and motor-vehicle-related injury deaths was obtained from mortality data files maintained by CDC's National Center for Health Statistics. Rates were calculated by using population estimates obtained from the U.S. Bureau of the Census. From 1968 through 1991, the number of firearm-related deaths exceeded the number of motor-vehicle crash-related deaths every year in the District of Columbia and for 17 of the 24 years in Alaska. Before 1990, the number of firearm-related deaths exceeded that of motor-vehicle-related deaths in any year in no more than two states and the District of Columbia. In 1990, however, the number of firearm-related deaths equaled or exceeded motor-vehicle- related deaths in five states (Alaska, Louisiana, Maryland, New York, and Texas) and the District of Columbia, and in 1991, in seven states (California, Louisiana, Maryland, Nevada, New York, Texas, and Virginia) and the District of Columbia. In addition, in 1991, the number of motor-vehicle-related deaths exceeded the number of firearm-related deaths by 10% or less in eight states (Alaska, Florida, Georgia, Illinois, Michigan, Missouri, North Carolina, and Vermont) (Table_1, Figure_2). In 1991, the ratio of firearm-related deaths to motor-vehicle-related deaths was highest for the District of Columbia (5.21:1) and lowest for Hawaii (0.41:1) (Table_1). In 1991, the age-adjusted death rate from motor-vehicle crashes was highest for black males (26.2 per 100,000 population) and was nearly equal to that for white males (24.2 per 100,000), 2.5 times that for white females (10.4 per 100,000), and 3.0 times that for black females (8.7 per 100,000). * The age-adjusted death rate for firearms also was highest for black males (66.4 per 100,000) and was 3.2 times that for white males (20.7 per 100,000), 8.3 times that for black females (8.0 per 100,000), and 17.9 times that for white females (3.7 per 100,000). For both motor-vehicle- and firearm-related deaths, age-specific death rates were highest for persons aged 15-24 years (CDC, unpublished data, 1991). Reported by: Div of Violence Prevention and Div of Unintentional Injury Prevention, National Center for Injury Prevention and Control; Office of Analysis and Epidemiology, National Center for Health Statistics, CDC. Editorial NoteEditorial Note: The findings in this report indicate that, since 1968, the number of motor-vehicle-related deaths in the United States has decreased while the number of firearm-related deaths has increased, and by the year 2003 firearm-related deaths may become the leading cause of injury-related death. These trends may reflect differences in the approaches to preventing motor-vehicle- and firearm-related injuries. In particular, reductions in the occurrence of motor-vehicle-related injuries have been associated with the development of a set of comprehensive and science-based interventions and policies (2); in contrast, there have been limited efforts to develop a systematic framework to reduce the incidence and impact of injuries associated with firearms. Elements of the multifaceted, science-based approach to reduce mortality from motor-vehicle crashes have included public information programs, promotion of behavioral change, changes in legislation and regulations, and advances in engineering and technology. These strategies have resulted in safer vehicles (e.g., the addition of laminated windshields and interior padding), safer driving practices (e.g., reduced occurrence of alcohol-impaired driving and increased use of safety belts), safer travel environments (e.g., construction of safer highways and roads), and improved emergency medical services. Key elements of the science-based approach have included the establishment of a national data-collection system to routinely monitor motor- vehicle-related deaths, identification of modifiable risk factors, design and implementation of preventive measures, and evaluation of the effectiveness of these measures. Since 1966, when the federal government identified highway safety as a major goal and subsequently established the National Highway Traffic Safety Administration to help reduce death and injury on the highway, the annual number of motor-vehicle- related deaths in the United States has decreased, even though the annual number of vehicle-miles traveled has increased 114% (3). Based on the effectiveness of efforts to reduce motor-vehicle- related deaths, a multifaceted approach to reduce firearm-related injuries should include at least three elements. First, changes in behavior may be fostered by campaigns to educate and inform persons about the risks and benefits of firearm possession and the safe use and storage of firearms. Second, legislative efforts may be directed toward preventing access to or acquisition of firearms by specific groups that should not possess firearms (e.g., felons and children) and toward regulating the storage, transport, and use of firearms. Third, technologic changes could be used to modify firearms and ammunition to render them less lethal (e.g., a requirement for childproof safety devices {i.e., trigger locks} and loading indicators) (4). A multifaceted effort to prevent firearm-related injuries should emphasize the need to inform the public about the risks and benefits of access to firearms in a manner similar to the approach used to inform the public about the benefits of wearing safety belts and the dangers of drunk driving. For example, the public should be informed about recent findings indicating that the presence of a gun in a household is associated with an approximately fivefold increase in the risk of suicide and threefold increase in the risk of homicide for household residents (5,6). Such efforts also should convey the appropriate interpretations of epidemiologic patterns in firearm-related injuries. For example, the findings in this report indicate that rates of firearm-related deaths were substantially higher for black males than for white males -- a pattern underscoring the disproportionate impact of firearm homicides on blacks. However, race is not known to be a risk factor for homicide victimization; instead, race-specific variations in the incidence of firearm-related deaths probably reflect differences in other factors (e.g., poverty) that increase a person's risk for becoming a victim of homicide (7). Elements of the science-based approach used to prevent injuries associated with motor-vehicle crashes also should be applied to prevent firearm-related injuries. These elements should include establishment of a national firearm injury surveillance system to enable systematic collection of data about fatal and nonfatal firearm-related injuries and about the patterns of firearm ownership and use, and continued efforts to define more precisely the risks and benefits of gun ownership and the modifiable factors that increase the risk of death and injury from firearms. In addition, despite the implementation of a variety of approaches to the prevention of firearm-related injuries and death, efforts to evaluate these approaches have been limited (8-10) and underscore the need for continued assessment of the effectiveness of such intervention strategies. Because highway safety has been a national priority since 1966, an estimated 250,000 motor-vehicle-related deaths have been averted. Despite this progress, efforts to reduce the burden of motor-vehicle-related injuries and fatalities must be sustained. In addition, adoption of a similar multifaceted, science-based approach should assist in decreasing the public health impact and societal burden of injuries resulting from use of firearms. References
* Data on other racial/ethnic groups are provided in a separate
report (1).
TABLE 1. Number, crude rates*, and ratios of firearm- and motor-vehicle-related
deaths, by decedents' state of residence -- United States, 1991+
================================================================================================
                        Firearm-related deaths   Motor-vehicle-related deaths
                        ----------------------   ----------------------------
State                      No.         Rate            No.         Rate           Ratio
---------------------------------------------------------------------------------------
Alabama                     928        22.7           1,225        30.0           0.76
Alaska                       98        17.2             102        17.9           0.96
Arizona                     696        18.6             814        21.7           0.86
Arkansas                    483        20.4             639        26.9           0.76
California                5,064        16.7           5,009        16.5           1.01
Colorado                    429        12.7             586        17.4           0.73
Connecticut                 287         8.7             335        10.2           0.86
Delaware                     53         7.8             106        15.6           0.50
District of Columbia        344        57.5              66        11.0           5.21
Florida                   2,323        17.5           2,517        19.0           0.92
Georgia                   1,377        20.8           1,466        22.1           0.94
Hawaii                       57         5.0             140        12.3           0.41
Idaho                       145        14.0             252        24.3           0.58
Illinois                  1,574        13.6           1,667        14.4           0.94
Indiana                     722        12.9           1,047        18.7           0.69
Iowa                        241         8.6             503        18.0           0.48
Kansas                      344        13.8             440        17.6           0.78
Kentucky                    605        16.3             821        22.1           0.74
Louisiana                 1,101        25.9             869        20.4           1.27
Maine                       123        10.0             196        15.9           0.63
Maryland                    708        14.6             708        14.6           1.00
Massachusetts               307         5.1             614        10.2           0.50
Michigan                  1,498        16.0           1,513        16.2           0.99
Minnesota                   351         7.9             598        13.5           0.59
Mississippi                 614        23.7             812        31.3           0.76
Missouri                    942        18.3           1,023        19.8           0.92
Montana                     144        17.8             181        22.4           0.80
Nebraska                    169        10.6             300        18.8           0.56
Nevada                      333        25.9             272        21.2           1.22
New Hampshire                83         7.5             153        13.8           0.54
New Jersey                  428         5.5             857        11.0           0.50
New Mexico                  288        18.6             431        27.8           0.67
New York                  2,515        13.9           2,226        12.3           1.13
North Carolina            1,265        18.8           1,407        20.9           0.90
North Dakota                 45         7.1              98        15.4           0.46
Ohio                      1,284        11.7           1,656        15.1           0.78
Oklahoma                    503        15.8             680        21.4           0.74
Oregon                      367        12.6             500        17.1           0.73
Pennsylvania              1,302        10.9           1,723        14.4           0.76
Rhode Island                 55         5.5              93         9.3           0.59
South Carolina              619        17.4             897        25.2           0.69
South Dakota                 75        10.7             146        20.8           0.51
Tennessee                 1,003        20.3           1,161        23.4           0.86
Texas                     3,727        21.5           3,229        18.6           1.15
Utah                        214        12.1             269        15.2           0.80
Vermont                      82        14.5              91        16.0           0.90
Virginia                    984        15.7             965        15.4           1.02
Washington                  550        11.0             768        15.3           0.72
West Virginia               292        16.2             431        23.9           0.68
Wisconsin                   491         9.9             823        16.6           0.60
Wyoming                      85        18.5             111        24.1           0.77

Total                    38,317        15.2          43,536        17.3           0.88
---------------------------------------------------------------------------------------
* Crude death rates per 100,000; rates should not be compared between states because of
  differing age, sex, and race distributions.
+ These data may differ from estimates of the National Highway Traffic Safety Administration's
  Fatal Accident Reporting System because deaths occurring on both public and nonpublic
  roadways are included.

Source: Mortality data tapes from CDC's National Center for Health Statistics for number of
deaths; U.S. Bureau of the Census for annual population estimates.
================================================================================================
Return to top. Figure_2 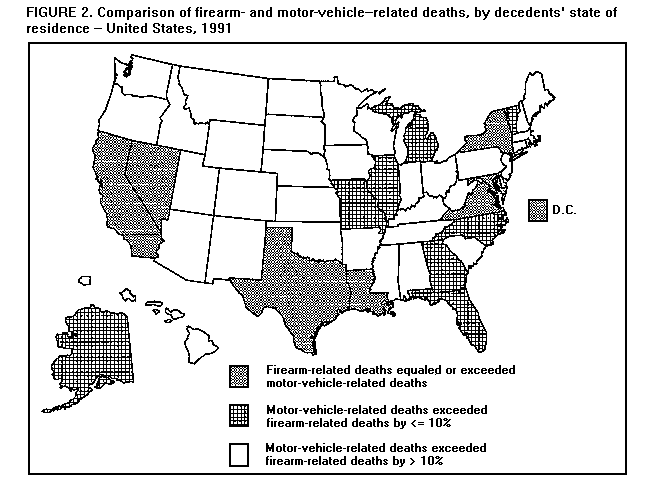 Return to top. Disclaimer All MMWR HTML versions of articles are electronic conversions from ASCII text into HTML. This conversion may have resulted in character translation or format errors in the HTML version. Users should not rely on this HTML document, but are referred to the electronic PDF version and/or the original MMWR paper copy for the official text, figures, and tables. An original paper copy of this issue can be obtained from the Superintendent of Documents, U.S. Government Printing Office (GPO), Washington, DC 20402-9371; telephone: (202) 512-1800. Contact GPO for current prices. **Questions or messages regarding errors in formatting should be addressed to mmwrq@cdc.gov.Page converted: 09/19/98 |
|||||||||
This page last reviewed 5/2/01
|