 |
|
|
|
|
|
|
| ||||||||||
|
|
|
|
|
|
|
||||
| ||||||||||
|
|
|
|
|
Persons using assistive technology might not be able to fully access information in this file. For assistance, please send e-mail to: mmwrq@cdc.gov. Type 508 Accommodation and the title of the report in the subject line of e-mail. Reduction in Alcohol-Related Traffic Fatalities -- United States, 1990-1992Alcohol-related traffic crashes are a leading cause of unintentional injury deaths and a substantial contributor to health-care costs in the United States (1). Approximately 40% of persons will be involved in an alcohol-related crash during their lifetime (2). In 1992, alcohol was involved in an estimated 17,700 traffic fatalities and 355,000 traffic injuries (2,3). In 1990, alcohol-related crashes cost $46.1 billion, including $5.1 billion in medical expenses (4,5). This report summarizes data regarding alcohol-related traffic fatalities (ARTFs) from the National Highway Traffic Safety Administration's (NHTSA) Fatal Accident Reporting System (FARS) during 1982-1992. NHTSA defines ARTFs as traffic deaths in which a driver, pedestrian, or bicyclist had a blood alcohol concentration (BAC) greater than or equal to 0.01 g/dL. Each year, approximately 80% of ARTFs involve at least one driver or pedestrian with a BAC greater than or equal to 0.10 g/dL, the legal level of intoxication in most states. NHTSA uses statistical models to estimate BACs for drivers and pedestrians where BAC test results are not available (6). In 1992, BAC test results were available for 47% of all drivers, pedestrians, and bicyclists involved in fatal crashes. Data from FARS indicate that ARTFs, as a proportion of all traffic fatalities, decreased since 1982, especially during 1991 and 1992 (Table_1). From 1982 through 1992, the number of ARTFs decreased 30%, from 25,165 to 17,699, while ARTFs, as a proportion of all traffic fatalities, decreased from 57% to 45%. From 1990 through 1992, ARTFs decreased 20%, from 22,084 to 17,699; in comparison, during the same period, nonalcohol-related traffic fatalities decreased 4%, from 22,515 to 21,536. In addition, ARTFs, as a percentage of all traffic fatalities, decreased from 50% in 1990 to 45% in 1992, the largest 2-year reduction since 1982, when uniformly reported data on ARTFs first became available. Compared with 1990, the number of alcohol-involved driver fatalities in 1992 decreased at all BACs (Table_2). Reductions in the number of alcohol-involved driver fatalities were greater for drivers aged 15-20 years than for drivers aged greater than or equal to 21 years. In addition, evidence of alcohol use decreased 22% among male drivers who died in crashes and 16% among female drivers. Data from 15 states * that tested more than 85% of drivers who died in 1990 and 1992 indicate a 22% decrease in the number of drivers with BACs greater than or equal to 0.20 g/dL, a 24% decrease in those with BACs 0.10-0.19 g/dL, and a 24% decrease in those with BACs 0.01-0.09 g/dL. Overall, ARTFs decreased 20% or more in 26 states and 15% or more in 33 states during 1990-1992 (Figure_1). The number of alcohol-involved driver fatalities decreased during 1990-1992 across all categories of drivers and among traditionally hard-to-reach populations (e.g., drivers with high BACs {22%}, drivers with previous convictions for impaired driving {18%}, motorcyclists {30%}, pickup-truck drivers {17%}, and teenagers {34%}). The decline in the number of ARTFs was greater for drivers than for pedestrians during 1990-1992. The number of alcohol-involved driver fatalities decreased 21%, while nonalcohol-involved driver fatalities decreased 5%. In contrast, alcohol-involved pedestrian fatalities decreased 13%, and nonalcohol-involved pedestrian fatalities decreased 16%. Reported by: JC Fell, MS, J Hedlund, PhD, ME Vegega, PhD, Office of Alcohol and State Programs; TM Klein, D Johnson, National Center for Statistics and Analysis, National Highway Traffic Safety Administration. Div of Unintentional Injuries, National Center for Injury Prevention and Control, CDC. Editorial NoteEditorial Note: The findings in this report indicate that the national health objectives for the year 2000 regarding ARTFs have been surpassed (7). Based on preliminary census data, the overall incidence of ARTFs has declined from the baseline of 9.8 per 100,000 persons in 1987 to 6.9 in 1992, below the goal of 8.5 (objective 4.1). The rate for persons aged 15-24 years declined from the baseline of 21.5 in 1987 to 14.1, also below the goal of 18.0 (objective 4.1b). These findings suggest that current measures to reduce alcohol-impaired driving are successful and should continue. The number and percentage of ARTFs have declined since 1982, despite a 40% increase in vehicle miles traveled during that time. Effective measures have included prompt license suspension for persons who drive while intoxicated; lowering legally permissible BACs to 0.08 g/dL for adults and 0.02 g/dL for drivers aged less than 21 years; sobriety checkpoints; and public education, community awareness, and media campaigns about the dangers of alcohol-impaired driving. To further reduce ARTFs and nonfatal injuries, additional strategies should be considered, such as those outlined during the Surgeon General's Workshop on Drunk Driving (8) and in the national plan for injury prevention and control (9). Examples of these strategies include altering social norms to make alcohol-impaired driving socially unacceptable, limiting alcohol availability among underaged youth, implementing responsible alcohol service training for those who sell and serve alcohol, implementing early alcohol treatment and rehabilitation programs, offering alternative transportation programs for those of legal drinking age, and increasing the perception of risk for arrest for alcohol-impaired driving. The public health impact of alcohol-impaired driving underscores the need for intensified preventive efforts by public health and traffic-safety agencies (10). Accordingly, the U.S. Department of Transportation has established for 1997 two major traffic-safety goals: 1) to reduce the proportion of ARTFs to 43% and 2) to increase safety-belt use to 75%. In response, NHTSA is developing a combined campaign to address both impaired driving and safety-belt nonuse through education, enforcement, and prevention activities. Attainment of these goals may save an estimated 2900 lives and $5.8 billion annually, including nearly $1 billion in health-care costs (5). References
* California, Colorado, Connecticut, Delaware, Hawaii, Illinois,
Maine, Montana, New Mexico, Oregon, Rhode Island, South Dakota,
Washington, West Virginia, and Wisconsin.
TABLE 1. Estimated number and percentage of total traffic fatalities, by blood alcohol
concentration (BAC)*--United States, 1982-1992
================================================================================================
                  BAC=0.00 g/dL        BAC >=0.01 g/dL      BAC >=0.10 g/dL
                 ----------------      ---------------      ----------------
Year    Total      No.      (%)          No.     (%)          No.      (%)
----------------------------------------------------------------------------
1982    43,945   18,780    (42.7)      25,165   (57.3)      20,356    (46.3)
1983    42,589   18,943    (44.5)      23,646   (55.5)      19,174    (45.0)
1984    44,257   20,499    (46.3)      23,758   (53.7)      18,992    (42.9)
1985    43,825   21,109    (48.2)      22,716   (51.8)      18,111    (41.3)
1986    46,087   22,042    (47.8)      24,045   (52.2)      18,936    (41.1)
1987    46,390   22,749    (49.0)      23,641   (51.0)      18,529    (39.9)
1988    47,087   23,461    (49.8)      23,626   (50.2)      18,731    (39.8)
1989    45,582   23,178    (50.8)      22,404   (49.2)      17,862    (39.2)
1990    44,599   22,515    (50.5)      22,084   (49.5)      17,650    (39.6)
1991    41,508   21,621    (52.1)      19,887   (47.9)      15,928    (38.4)
1992    39,235   21,536    (54.9)      17,699   (45.1)      14,123    (36.0)
----------------------------------------------------------------------------
* BAC distributions are estimates for drivers and nonoccupants involved in fatal crashes. Num-
  bers of fatalities and drivers involved are rounded to the nearest whole number.

Source: Fatal Accident Reporting System, National Highway Traffic Safety Administration.
================================================================================================
Return to top. Table_2 Note: To print large tables and graphs users may have to change their printer settings to landscape and use a small font size.
TABLE 2. Estimated number of driver fatalities and percentage change from 1990 to
1992, by blood alcohol concentration (BAC)* and driver age -- United States
================================================================================================
                BAC=0.00 g/dL            BAC >=0.01 g/dL           BAC >=0.10 g/dL
Driver     ------------------------  ------------------------  ------------------------
 age (yrs)  1990   1992  (% change)   1990   1992  (% change)   1990   1992  (% change)
---------------------------------------------------------------------------------------
 0-14 +        97     69  (-28.9)         9     10  (+11.1)         4      4  (  0  )
15-20       2,400  2,058  (-14.3)     1,653  1,095  (-33.8)     1,227    788  (-35.8)
21-24       1,310  1,254  ( -4.3)     1,957  1,544  (-21.1)     1,643  1,256  (-23.6)
25-34       2,518  2,275  (- 9.7)     4,137  3,140  (-24.1)     3,543  2,704  (-23.7)
35-44       1,863  1,829  (- 1.8)     2,195  1,892  (-13.8)     1,877  1,632  (-13.1)
45-54       1,458  1,495  (+ 2.5)       937    828  (-11.6)       777    674  (-13.3)
55-64       1,398  1,256  (-10.2)       509    432  (-15.1)       411    328  (-20.2)
 >=65       2,877  2,999  (+ 4.2)       421    396  (- 5.9)       287    274  (- 4.5)
Unknown         3      5  (+40.0)         8      6  (-25.0)         8      6  (-25.0)

Total      13,924 13,240  (- 4.9)    11,826  9,343  (-21.0)     9,777  7,666  (-21.6)
---------------------------------------------------------------------------------------
* BAC distributions are estimates for drivers and nonoccupants involved in fatal crashes. Num-
  bers of fatalities and drivers involved are rounded to the nearest whole number.
+ Although usually too young to drive legally, persons in this age group are included for com-
  pleteness of the data set.

Source: Fatal Accident Reporting System, National Highway Traffic Safety Administration.
================================================================================================
Return to top. Figure_1 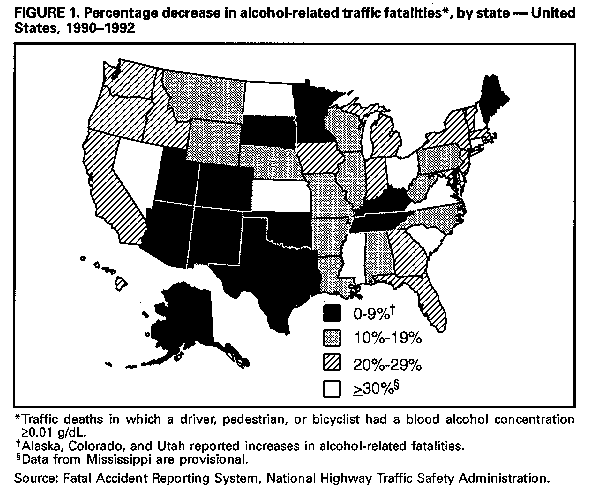 Return to top. Disclaimer All MMWR HTML versions of articles are electronic conversions from ASCII text into HTML. This conversion may have resulted in character translation or format errors in the HTML version. Users should not rely on this HTML document, but are referred to the electronic PDF version and/or the original MMWR paper copy for the official text, figures, and tables. An original paper copy of this issue can be obtained from the Superintendent of Documents, U.S. Government Printing Office (GPO), Washington, DC 20402-9371; telephone: (202) 512-1800. Contact GPO for current prices. **Questions or messages regarding errors in formatting should be addressed to mmwrq@cdc.gov.Page converted: 09/19/98 |
|||||||||
This page last reviewed 5/2/01
|