 |
|
|
|
|
|
|
| ||||||||||
|
|
|
|
|
|
|
||||
| ||||||||||
|
|
|
|
|
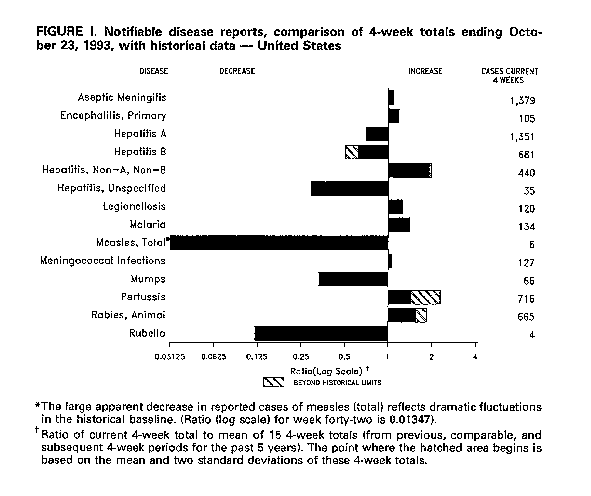
Persons using assistive technology might not be able to fully access information in this file. For assistance, please send e-mail to: mmwrq@cdc.gov. Type 508 Accommodation and the title of the report in the subject line of e-mail. Update: Changes in Notifiable Disease Surveillance Data -- United States, 1992-1993Since April 1990, CDC has graphically presented changes in reported cases of 14 notifiable infectious diseases reported through the National Notifiable Diseases Surveillance System (NNDSS) (1). Figure_I of each issue of MMWR displays on a log scale the ratio of the number of cases reported in the most recently ended 4-week period to that of the mean of the number of cases reported in 15 historical 4-week periods (2). During 1992-1993, Figure_I has indicated a decline in incidence in selected reportable diseases (e.g., measles, mumps, and rubella). Declines in the incidence of these diseases could represent either true declines or changes in notifiable disease surveillance (e.g., a lower percentage of all cases was reported than previously). During June-August, 1993, CDC evaluated the surveillance system to determine the reasons for the declines. This report summarizes the results of the evaluation. To assess potential causes for artifactual declines in reported notifiable diseases, CDC consulted with surveillance staff of 13 state health departments *. This consultation identified at least four factors that may affect reporting of infectious diseases through the NNDSS, including 1) changes in health department staffing for surveillance (e.g., reductions associated with recent budgetary constraints), 2) the addition of new variables to the electronic record used in data transmission from many states to CDC, 3) improved efficiency of quality control of data at CDC (e.g., more timely electronic quality control may have enhanced verification of provisional data), and 4) greater use of uniform case definitions that were published in 1990 (3). Systematic investigation of these potential factors included further consultation with reporting staff in selected states, comparison of national and state provisional and revised data for selected diseases for 1987-1992, and assessment by CDC programs responsible for the surveillance and prevention of measles, mumps, rubella, and hepatitis. In general, during 1992 and 1993, weekly numbers of reported cases decreased for several diseases, including hepatitis (unspecified), measles, mumps, and rubella; in comparison, numbers of reported cases of hepatitis non-A, non-B (NANBH) increased. Neither underreporting nor delayed reporting appeared to account for the apparent decreased reported incidence of measles, mumps, or rubella. The baseline years (1987-1991) used in the calculations to produce Figure_I included periods of increased reported incidence for measles, mumps, and rubella. For example, the number of reported measles cases increased from 1030 in 1983 to 16,342 in 1990 (most recent peak); mumps, from 2612 in 1984 to 10,233 in 1987 (most recent peak); and rubella, from 188 in 1988 to 1256 in 1991 (most recent peak). For each of these diseases, the number of cases reported in the peak year was four-18 times higher than that reported during years of lower incidence. For each disease, the number of cases reported for 1992 was comparable to prior years of low incidence -- provisional totals for 1992 were 1694 cases of measles, 2049 cases of mumps, and 137 cases of rubella **. Overall, the number of reported cases of hepatitis (unspecified) has declined since 1980. Increased availability and use of laboratory tests for hepatitis may have resulted in fewer cases reported as type unspecified while the availability of a test for antibody to hepatitis C virus (anti-HCV) has caused an artifactual increase in the number of reported cases of acute NANBH. In particular, some persons with positive anti-HCV tests and no evidence of acute viral hepatitis have been reported as cases of NANBH. These positive anti-HCV tests may represent either chronic or past infection with HCV (anti-HCV is detectable in the blood indefinitely following HCV infection) or false-positive results. In some cases, blood banks have reported positive anti-HCV screening results to health departments as acute NANBH cases. CDC is working with state and local health departments to clarify use of the anti-HCV test in NANBH surveillance. Reported by: Div of Viral and Rickettsial Diseases, National Center for Infectious Diseases; National Immunization Program; Div of Surveillance and Epidemiology, Epidemiology Program Office, CDC. Editorial NoteEditorial Note: The findings in this report underscore the importance of changes in the reported national incidence of notifiable diseases. For example, this evaluation indicates that the declines in measles, mumps, and rubella during 1992-1993 represent actual declines in disease incidence. The apparent size of the decline was magnified because the current reported incidence of each disease was compared with an earlier baseline period of substantially increased incidence. In contrast, the changes in reported incidence of hepatitis (unspecified) and hepatitis (NANB) more likely reflect changes in the availability and use of specific laboratory tests rather than substantial recent changes in incidence of these infections. No serologic test is available to detect acute HCV infection. Therefore, reports of possible acute cases of hepatitis C should be based on the case definition for NANBH (i.e., discrete onset of symptoms and jaundice or elevated serum aminotransferase levels and serologic data {immunoglobulin M (IgM) negative for antibody to hepatitis A virus, and IgM negative for antibody to hepatitis B core antigen (if done) or hepatitis B surface antigen}). The mean duration between onset of symptoms and/or signs and anti-HCV seroconversion is 4-5 weeks and can be considerably longer in some persons (4). The graphical display of Figure_I reflects changes in incidence of some diseases when compared with recent historical experience. Other methods of data presentation may be more appropriate for representing secular trends. CDC has evaluated this graphical display method (5,6) and is investigating other methods to detect aberrations in reported cases of notifiable diseases (7). However, no analytic method to detect aberrations in data should substitute for other methods of epidemiologic analysis, such as laboratory confirmation and communication with state public health staff. Whenever the graphical presentation shows deviation from the baseline, reporting in both the current and baseline periods must be investigated. References
* Alabama, Alaska, Arkansas, California, Idaho, Illinois, Iowa, Missouri, New Jersey, North Dakota, Ohio, Pennsylvania, and South Carolina.
** Totals for 1992 and prior years reported here are the
accumulated
totals of the originally reported weekly provisional figures for
that year. These are the numbers that are used for the five
baseline years in the creation of Figure_I for the MMWR. They
differ slightly from figures reported for weeks 52 or 53 at the end
of each calendar year, which are the accumulated totals. with any
updating that has occurred through that date. They also differ from
the data published in the MMWR series, Annual Summary of Notifiable
Diseases, which presents the final updated total for the year. Disclaimer All MMWR HTML versions of articles are electronic conversions from ASCII text into HTML. This conversion may have resulted in character translation or format errors in the HTML version. Users should not rely on this HTML document, but are referred to the electronic PDF version and/or the original MMWR paper copy for the official text, figures, and tables. An original paper copy of this issue can be obtained from the Superintendent of Documents, U.S. Government Printing Office (GPO), Washington, DC 20402-9371; telephone: (202) 512-1800. Contact GPO for current prices. **Questions or messages regarding errors in formatting should be addressed to mmwrq@cdc.gov.Page converted: 09/19/98 |
|||||||||
This page last reviewed 5/2/01
|