
Persons using assistive technology might not be able to fully access information in this file. For assistance, please send e-mail to: mmwrq@cdc.gov. Type 508 Accommodation and the title of the report in the subject line of e-mail.
Surveillance for Foodborne Disease Outbreaks --- United States, 2006
Foodborne illnesses are a major health burden in the United States (1). Most of these illnesses are preventable, and analysis of outbreaks helps identify control measures. Although most cases are sporadic, investigation of the portion that occur as part of recognized outbreaks can provide insights into the pathogens, food vehicles, and food-handling practices associated with foodborne infections. CDC collects data on foodborne disease outbreaks (FBDOs) from all states and territories through the Foodborne Disease Outbreak Surveillance System (FBDSS). This report summarizes epidemiologic data on FBDOs reported during 2006 (the most recent year for which data have been analyzed). A total of 1,270 FBDOs were reported, resulting in 27,634 cases and 11 deaths. Among the 624 FBDOs with a confirmed etiology, norovirus was the most common cause, accounting for 54% of outbreaks and 11,879 cases, followed by Salmonella (18% of outbreaks and 3,252 cases). Among the 11 reported deaths, 10 were attributed to bacterial etiologies (six Escherichia coli O157:H7, two Listeria monocytogenes, one Salmonella serotype Enteritidis, and one Clostridium botulinum), and one was attributed to a chemical (mushroom toxin). Among outbreaks caused by a single food vehicle, the most common food commodities to which outbreak-related cases were attributed were poultry (21%), leafy vegetables (17%), and fruits/nuts (16%). Public health professionals can use this information to 1) target control strategies for specific pathogens in particular foods along the farm-to-table continuum and 2) support good food-handling practices among restaurant workers and the public.
State, local, and territorial health departments voluntarily submit reports of FBDOs using a web-based standard form to the electronic Foodborne Outbreak Reporting System (eFORS). An FBDO is defined as the occurrence of two or more cases of a similar illness resulting from the ingestion of a common food. Information regarding clinical syndromes, incubation period, and laboratory testing for various etiologic agents is available to guide reporting officials.* Officials report an etiology as either confirmed (at least one etiologic agent found) or suspected (based on clinical and epidemiologic information) (2). Analysis was limited to FBDOs with a single etiology (i.e., suspected or confirmed). Food vehicles are food items linked to illnesses by an outbreak investigation. CDC classifies the foods vehicles implicated in outbreak reports into the following 17 food commodities: fish, crustaceans, mollusks, dairy, eggs, beef, game, pork, poultry, grains/beans, oils/sugars, fruits/nuts, fungi, leafy vegetables, root vegetables, sprouts, and vegetables from a vine or stalk.
During 2006, public health officials reported a total of 1,270 FBDOs from 48 states. A confirmed or suspected single etiologic agent was indentified in 884 (70%) FBDOs (621 confirmed and 263 suspected), accounting for 22,510 (81%) cases (Table 1). The number of outbreaks reported by each state or territory ranged from zero to 76. The median rate was 0.21 (range: zero to 1.3) per 100,000 population. For seven states (Hawaii, Maine, Minnesota, North Dakota, Oregon, Vermont, and Wisconsin), the rate of reporting was greater than three times the median. Rates of reported outbreaks varied markedly by etiology group (Figure). Among the 621 outbreaks (with 18,111 cases) with a confirmed single etiologic agent, 343 (55%) outbreaks and 11,981 (66%) cases were caused by viruses, 217 (35%) outbreaks and 5,781 (32%) cases were caused by bacteria, 52 (8%) outbreaks and 219 (1%) cases were caused by chemical agents, and nine (1%) outbreaks and 29 (1%) cases were caused by parasites. Calicivirus caused 337 (98%) of the confirmed FBDOs attributed to viruses; all calicivirus outbreaks reported in 2006 were attributed to norovirus. Salmonella, the most commonly reported bacterial etiologic agent, caused 112 (52%) of the confirmed FBDOs attributed to bacteria; Salmonella serotype Enteritidis caused the most outbreaks (28 [13%]). Shiga toxin--producing E. coli (STEC) caused 29 (13%) of confirmed FBDOs attributed to bacteria, of which 27 were serogroup O157.
Eleven multistate outbreaks, defined as outbreaks in which exposures occurred in more than one state, were detected; 10 of these were attributed to bacteria. One attributed to chemical agents was transmitted by baked goods contaminated by a floor sealant (11 cases). Four of the bacterial outbreaks were attributed to E. coli O157, of which three were transmitted by leafy vegetables (395 cases) and one was transmitted by beef (44 cases). Four were attributed to Salmonella, of which two were transmitted by tomatoes (307 cases), one by peanut butter (715 cases), and one by fruit salad (41 cases) (3). An outbreak of Vibrio parahaemolyticus infections was transmitted by oysters (177 cases). An outbreak attributed to C. botulinum toxin was transmitted by carrot juice (four cases) (4).
Public health officials identified a food vehicle in 528 (42%) FBDOs, of which 243 (46%) outbreaks with 6,395 (50%) cases were classified as having ingredients belonging to only one of the 17 commodities (Table 2). Among the 243 outbreaks attributed to a single commodity, the most outbreaks were attributed to fish (47 outbreaks), poultry (35 outbreaks), and beef (25 outbreaks), and the most cases were attributed to poultry (1,355 cases), leafy vegetables (1,081 cases), and fruits/nuts (1,021 cases). Pathogen-commodity pairs responsible for the most outbreak-related cases were Clostridium perfringens in poultry (902 cases), Salmonella in fruits/nuts (776 cases), norovirus in leafy vegetables (657 cases), STEC in leafy vegetables (398 cases), Salmonella in vine-stalk vegetables (331 cases), and V. parahaemolyticus in mollusks (223 cases).†
Although the dairy commodity accounted for only 3% of single commodity outbreak-related cases (16 outbreaks and 193 cases), 71% of dairy outbreak cases were attributed to unpasteurized (raw) milk (10 outbreaks and 137 cases). A wide range of bacterial pathogens were associated with unpasteurized milk outbreaks, including Campylobacter (six outbreaks), STEC O157 (two outbreaks), Salmonella (one outbreak), and Listeria (one outbreak), resulting in 11 hospitalizations and one death.
The largest outbreaks with a known etiology and single food commodity were attributed to baked chicken contaminated with C. perfringens (741 cases), peanut butter contaminated with Salmonella (714 cases), and spinach contaminated with E. coli O157 (238 cases). In the spinach outbreak, 31 persons developed hemolytic uremic syndrome, and five died, including a child (5). The contaminated spinach was traced back to a single farm, where the outbreak strain was isolated from nearby cattle feces and feral swine feces (6).
Reported by: LT Ayers, MS, IT Williams, PhD, S Gray, MPH, PM Griffin, MD, Enteric Diseases Epidemiology Br, Div of Foodborne, Bacterial, and Mycotic Diseases, National Center for Zoonotic, Vector-Borne, and Enteric Diseases, AJ Hall, DVM, Epidemiology Br, Div of Viral Diseases, National Center for Immunization and Respiratory Diseases, CDC.
Editorial Note:
Timely reporting of findings of investigations is an important step in efforts to better understand and define the epidemiology of foodborne disease in the United States and to identify gaps in the food-safety system. Many factors in detection and reporting likely contribute to variations in the rate of reported FBDOs among states. An increasing rate of FBDOs reported from a state can be attributed to better surveillance, investigation, or reporting, and might not be indicative of an actual higher rate of outbreaks. For example, the increased availability of diagnostic tests for norovirus in state public health laboratories likely has contributed to an increased proportion of norovirus outbreaks of confirmed etiology in 2006 (7). However, the increase in the number of norovirus outbreaks reported in 2006 compared with the previous 5-year average is thought to reflect an actual increase and not merely an improvement in diagnosis (8). Furthermore, with 12 states not reporting any viral FBDOs in 2006 primarily because of a lack of diagnostic capabilities, the proportion of FBDOs attributable to norovirus likely is underestimated.
The large and increasing number of outbreaks attributed to norovirus indicates a need for improved attention to preventing food contamination at the point of service, because such outbreaks are largely attributed to transmission by infected food handlers. Adhering to the recommended measures (e.g., hand washing) for prevention and control of norovirus infections could greatly reduce the number of outbreak-related cases (8). Additionally, the importance of norovirus contamination at the farm level or during processing remains largely unknown because of limitations in the current national surveillance systems. Although the number of outbreaks and cases attributed to C. perfringens declined in 2006 compared with the mean annual total during 2001--2005, the continued large number of outbreaks indicates a need for improved attention to holding temperatures of cooked meat and poultry. Illnesses associated with raw milk continue to occur, and additional efforts are needed to educate consumers and dairy farmers about illnesses associated with this preventable risk.
Both the number of foodborne Salmonella Enteritidis outbreaks (28) and E. coli O157:H7 outbreaks (27) in 2006 remained above their Healthy People 2010 targets of 22 and 11 outbreaks, respectively, for all modes of transmission. However, the number of Salmonella Enteritidis outbreak-associated cases per year decreased from an average of 974 during 1998--2000 to 692 during 2004--2006 (CDC, unpublished data, 2009). The number of E. coli O157:H7 outbreak-associated cases per year decreased from an average of 829 during 1998--2000 to 353 during 2004--2006 (CDC, unpublished data, 2009).§
The findings in this report are subject to at least five limitations. First, only a small proportion of all foodborne illnesses reported each year are identified as associated with outbreaks. For example, in FoodNet¶ sites during 2006, only 6.1% of Salmonella infection cases were part of a recognized outbreak (9). Some foodborne illnesses reported as sporadic cases likely are part of outbreaks that are not recognized; also, smaller outbreaks might not come to the attention of public health authorities. Second, not all recognized outbreaks are reported to CDC. Some outbreaks are not investigated because of competing priorities in health departments. Third, for many reported FBDOs, information on certain aspects of the outbreak, such as the etiology or the implicated food vehicle, is incomplete. Fourth, only approximately half of the reported outbreaks in 2006 had a confirmed etiology and thus might not be representative of those with a suspected or unknown etiology. Finally, because of variations in outbreak detection, investigation, and reporting, comparisons with previous years of the number of reported FBDOs attributed to a specific etiology or food vehicle should be made with caution.
The capacity to perform serotyping and pulsed-field gel electrophoresis at the state and local public health laboratories and to rapidly share information through PulseNet (the national molecular subtyping network for foodborne disease surveillance) is critically important for detecting FDBOs. The recent development and ongoing implementation of a similar national network for norovirus molecular sequences (CaliciNet) might help identify the emergence of new variant strains, link multijurisdictional FBDOs associated with norovirus, and determine the role of contamination before food preparation and serving.
Ensuring adequate epidemiologic and regulatory investigative capacity at the state and federal levels also is essential to identify sources and implement timely control measures. Outbreak investigations, especially multistate outbreaks, can rapidly strain public health system resources. Enhancing capacity at local, state, and federal levels could make outbreak detection and investigation even faster. Additional information on FBDOs is available at http://www.cdc.gov/foodborneoutbreaks.
Acknowledgments
The findings in this report are based, in part, on contributions by state and territorial health departments.
References
- Mead PS, Slutsker L, Dietz V, et al. Food-related illness and death in the United States. Emerg Infect Dis 1999;5:607--25.
- CDC. Surveillance for foodborne-disease outbreaks---United States, 1998--2002. MMWR 2006;55(No. SS-10):1--34.
- CDC. Multistate outbreak of Salmonella serotype Tennessee infections associated with peanut butter---United States, 2006--2007. MMWR 2006;56:521--4.
- CDC. Botulism associated with commercial carrot juice---Georgia and Florida, September 2006. MMWR 2006;55:1098--9.
- CDC. Ongoing multistate outbreak of Escherichia coli serotype O157:H7 infections associated with consumption of fresh spinach---United States, September 2006. MMWR 2006;55:1045--6.
- Jay MT, Cooley M, Carychao D, et al. Escherichia coli O157:H7 in feral swine near spinach fields and cattle, central California coast. Emerg Infect Dis 2007;13:1908--11.
- Widdowson M, Sulka A, Bulens S, et al. Norovirus and foodborne disease, United States, 1991--2000. Emerg Infect Dis 2005;11:95--102.
- CDC. Norovirus activity---United States, 2006--2007. MMWR 2007;56:842--6.
- CDC. Preliminary FoodNet data on the incidence of infection with pathogens transmitted commonly through food---10 states, 2006. MMWR 2006;56:336--9.
* Available at http://www.cdc.gov/foodborneoutbreaks/guide_fd.htm.
† Additional information on FBDOs and illnesses associated with the 17 food commodities is available at http://www.cdc.gov/outbreaknet/surveillance_data.html.
§ Additional information available at http://www.healthypeople.gov/document/html/objectives/10-02.htm.
¶ The Foodborne Diseases Active Surveillance Network (FoodNet) of CDC's Emerging Infections Program collects data from 10 U.S. states on diseases caused by enteric pathogens transmitted commonly through food.
FIGURE. Rate of reported foodborne disease outbreaks per 100,000 standard population and number of outbreaks,* by state and major etiology group† --- United States, 2006
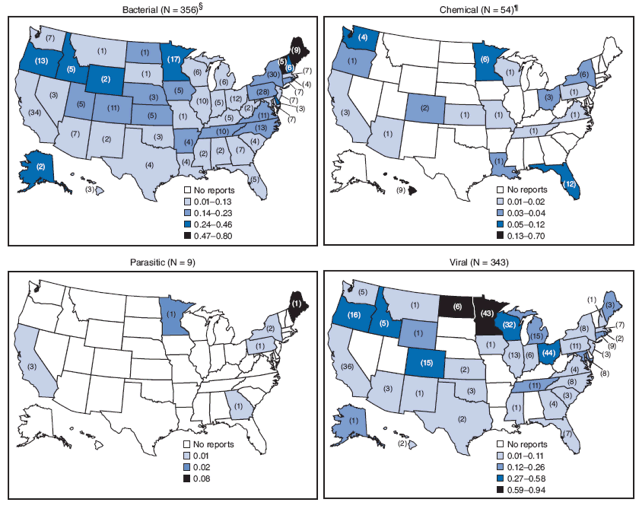
* Number of outbreaks reported is shown in parentheses.
† Analysis restricted to outbreaks attributed to a single confirmed etiology.
§ Includes 10 multistate outbreaks that are assigned as an outbreak to each state involved.
¶ Includes one multistate outbreak that is assigned as an outbreak to each state involved.
Alternative Text: The figure above, comprising four U.S. maps, shows the rate of reported foodborne disease outbreaks per 100,000 standard population and number of outbreaks, by state and major etiology group in 2006. Rates of reported outbreaks varied markedly by etiology group.
|
TABLE 2. Number of reported foodborne disease outbreaks and outbreak-associated illnesses, by confirmed or suspected etiology* and type of food commodity† --- United States, 2006§ |
||||||||
|---|---|---|---|---|---|---|---|---|
|
Etiology (confirmed or suspected) |
Outbreaks (illnesses) attributed to a single commodity |
Outbreaks (illnesses) attributed to vehicle containing >1 commodity |
Outbreaks (illnesses) attributed to unknown commodity |
Total outbreaks (illnesses) |
||||
|
Bacterial |
||||||||
|
Salmonella¶ |
31 |
(1,761) |
21 |
(700) |
65 |
(835) |
117 |
(3,296) |
|
Clostridium perfringens |
12 |
(1,228) |
15 |
(518) |
7 |
(134) |
34 |
(1,880) |
|
Staphylococcus enterotoxin** |
13 |
(181) |
12 |
(229) |
4 |
(18) |
29 |
(428) |
|
Escherichia coli, Shiga toxin--producing (STEC)†† |
14 |
(496) |
4 |
(17) |
11 |
(79) |
29 |
(592) |
|
Campylobacter§§ |
9 |
(123) |
3 |
(46) |
13 |
(132) |
25 |
(301) |
|
Bacillus cereus |
5 |
(35) |
5 |
(20) |
3 |
(17) |
13 |
(72) |
|
Shigella¶¶ |
3 |
(48) |
2 |
(44) |
5 |
(93) |
10 |
(185) |
|
Vibrio parahaemolyticus |
7 |
(303) |
1 |
(19) |
0 |
(0) |
8 |
(322) |
|
Listeria*** |
2 |
(6) |
1 |
(2) |
1 |
(2) |
4 |
(10) |
|
Clostridium botulinum toxin |
3 |
(8) |
0 |
(0) |
1 |
(5) |
4 |
(13) |
|
Brucella spp. |
1 |
(5) |
0 |
(0) |
0 |
(0) |
1 |
(5) |
|
Escherichia coli, Enterotoxigenic |
0 |
(0) |
0 |
(0) |
1 |
(2) |
1 |
(2) |
|
Yersinia enterocolitica |
0 |
(0) |
0 |
(0) |
0 |
(0) |
0 |
(0) |
|
Other bacteria |
5 |
(45) |
4 |
(24) |
11 |
(66) |
20 |
(135) |
|
Bacterial total |
105 |
(4,239) |
68 |
(1,619) |
122 |
(1,383) |
295 |
(7,241) |
|
Chemical |
||||||||
|
Scombroid toxin/Histamine |
31 |
(107) |
1 |
(6) |
0 |
(0) |
32 |
(113) |
|
Ciguatoxin |
10 |
(45) |
0 |
(0) |
0 |
(0) |
10 |
(45) |
|
Mushroom toxins |
4 |
(16) |
0 |
(0) |
0 |
(0) |
4 |
(16) |
|
Cleaning agents |
0 |
(0) |
0 |
(0) |
2 |
(4) |
2 |
(4) |
|
Neurotoxic shellfish poison |
2 |
(15) |
0 |
(0) |
0 |
(0) |
2 |
(15) |
|
Monosodium glutamate (MSG) |
0 |
(0) |
0 |
(0) |
1 |
(2) |
1 |
(2) |
|
Plant toxins (herbal toxins) |
0 |
(0) |
1 |
(15) |
0 |
(0) |
1 |
(15) |
|
Puffer fish tetrodotoxin |
0 |
(0) |
1 |
(2) |
0 |
(0) |
1 |
(2) |
|
Heavy metals |
0 |
(0) |
0 |
(0) |
0 |
(0) |
0 |
(0) |
|
Paralytic shellfish poison |
0 |
(0) |
0 |
(0) |
0 |
(0) |
0 |
(0) |
|
Other natural toxins |
0 |
(0) |
0 |
(0) |
0 |
(0) |
0 |
(0) |
|
Other chemicals |
4 |
(9) |
2 |
(15) |
7 |
(31) |
13 |
(55) |
|
Chemical total |
51 |
(192) |
5 |
(38) |
10 |
(37) |
66 |
(267) |
|
Parasitic |
||||||||
|
Cryptosporidium |
0 |
(0) |
0 |
(0) |
4 |
(30) |
4 |
(30) |
|
Cyclospora |
1 |
(14) |
0 |
(0) |
2 |
(23) |
3 |
(37) |
|
Giardia |
0 |
(0) |
0 |
(0) |
3 |
(60) |
3 |
(60) |
|
Trichinella |
1 |
(2) |
0 |
(0) |
0 |
(0) |
1 |
(2) |
|
Other parasites |
1 |
(18) |
0 |
(0) |
0 |
(0) |
1 |
(18) |
|
Parasitic total |
3 |
(34) |
0 |
(0) |
9 |
(113) |
12 |
(147) |
|
Viral |
||||||||
|
Calicivirus††† |
55 |
(1,335) |
127 |
(3,063) |
323 |
(10,355) |
505 |
(14,753) |
|
Hepatitis A |
0 |
(0) |
0 |
(0) |
5 |
(50) |
5 |
(50) |
|
Astrovirus |
0 |
(0) |
0 |
(0) |
0 |
(0) |
0 |
(0) |
|
Rotavirus |
0 |
(0) |
0 |
(0) |
0 |
(0) |
0 |
(0) |
|
Other viruses |
0 |
(0) |
0 |
(0) |
1 |
(52) |
1 |
(52) |
|
Viral total |
55 |
(1,335) |
127 |
(3,063) |
329 |
(10,457) |
511 |
(14,855) |
|
Single etiology (subtotal) |
214 |
(5,800) |
200 |
(4,720) |
470 |
(11,990) |
884 |
(22,510) |
|
Unknown etiology§§§ |
24 |
(528) |
75 |
(1,028) |
264 |
(2,774) |
363 |
(4,330) |
|
Multiple etiologies |
5 |
(67) |
10 |
(524) |
8 |
(203) |
23 |
(794) |
|
Total |
243 |
(6,395) |
285 |
(6,272) |
742 |
(14,967) |
1,270 |
(27,634) |
|
* If at least one etiology was confirmed, the outbreak was counted as confirmed etiology. If no etiology was confirmed, it was counted as suspected etiology based on clinical or epidemiologic features. § Additional data on outbreaks attributed to specific food commodities are available at http://www.cdc.gov/outbreaknet/surveillance_data.html. † CDC classifies food vehicles (food items linked to illnesses by an outbreak investigation) into the following 17 food commodities: fish, crustaceans, mollusks, dairy, eggs, beef, game, pork, poultry, grains/beans, oils/sugars, fruits/nuts, fungi, leafy vegetables, root vegetables, sprouts, and vegetables from a vine or stalk. ¶ Salmonella serotypes accounting for more than five outbreaks reported include: Enteriditis (28 outbreaks), Typhimurium (24), Newport (nine), and Heidelberg (nine). ** S. aureus (12 confirmed outbreaks and 12 suspected outbreaks) and Staphylococcus of unknown species (five suspected outbreaks). †† STEC O157 (27 confirmed outbreaks), STEC O121 (one confirmed outbreak), and STEC O26 (one confirmed outbreak). §§ C. fetus (one confirmed outbreak), C. jejuni (14 confirmed outbreaks), and Campylobacter of unknown species (seven confirmed outbreaks and three suspected outbreaks). ¶¶ S. flexneri (one confirmed outbreak) and S. sonnei (eight confirmed outbreaks and one suspected outbreak). *** L. monocytogenes (two confirmed outbreaks and one suspected outbreak) and Listeria of unknown species (one confirmed outbreak). ††† All outbreaks reported in 2006 were norovirus. §§§ An etiologic agent was not found or suspected based on clinical and epidemiologic information. |
||||||||
Use of trade names and commercial sources is for identification only and does not imply endorsement by the U.S. Department of
Health and Human Services. |
All MMWR HTML versions of articles are electronic conversions from typeset documents. This conversion might result in character translation or format errors in the HTML version. Users are referred to the electronic PDF version (http://www.cdc.gov/mmwr) and/or the original MMWR paper copy for printable versions of official text, figures, and tables. An original paper copy of this issue can be obtained from the Superintendent of Documents, U.S. Government Printing Office (GPO), Washington, DC 20402-9371; telephone: (202) 512-1800. Contact GPO for current prices.
**Questions or messages regarding errors in formatting should be addressed to mmwrq@cdc.gov.Date last reviewed: 6/10/2009