|
|
|
|
|
|
|
| ||||||||||
|
|
|
|
|
|
|
||||
| ||||||||||
|
|
|
|
|
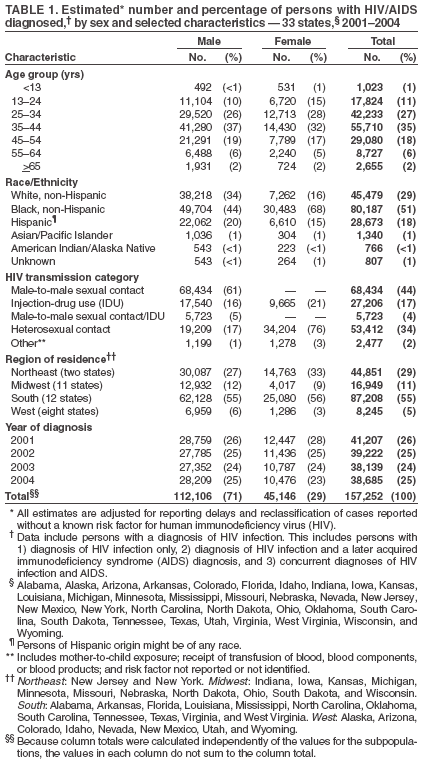
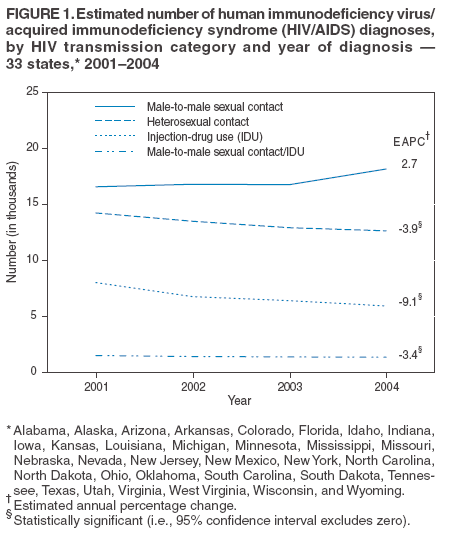
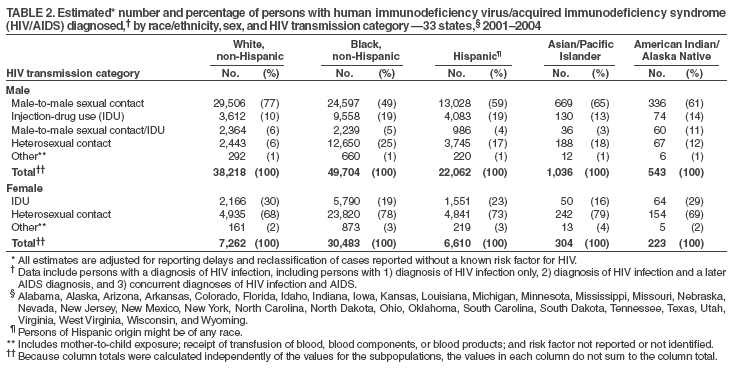
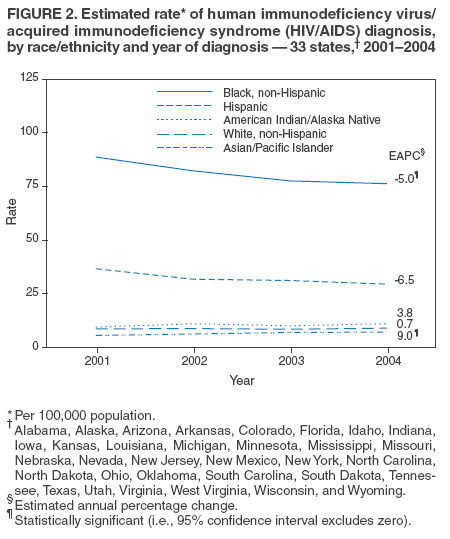
Persons using assistive technology might not be able to fully access information in this file. For assistance, please send e-mail to: mmwrq@cdc.gov. Type 508 Accommodation and the title of the report in the subject line of e-mail. Trends in HIV/AIDS Diagnoses --- 33 States, 2001--2004In 2003, more than 1 million persons in the United States were estimated to be living with human immunodeficiency virus (HIV) infection (1). As a result of advances in treatment with highly active antiretroviral therapy (HAART) since 1996, persons infected with HIV are living longer than before and progression to acquired immunodeficiency syndrome (AIDS) has decreased. Consequently, AIDS surveillance no longer provides accurate population-based monitoring of the current HIV epidemic. Therefore, CDC recommends that all states and territories adopt confidential, name-based surveillance systems to report HIV infection (2). This report describes the characteristics of persons for whom HIV infection was diagnosed during 2001--2004 and reported to 33 state and local health departments with name-based HIV reporting. The findings indicate that the rate of HIV diagnosis in these states decreased among non-Hispanic blacks* from 2001 to 2004; however, the rate of HIV diagnosis among blacks remained disproportionately high. In 2004, the rate among blacks was 8.4 times higher than among whites. Improved knowledge of HIV status and access to care and prevention services is important to decrease the number of new HIV infections among those populations most affected. Included in this analysis are HIV cases reported to CDC from 33 states† that have conducted name-based HIV/AIDS reporting for at least 4 years. The addition of New York, a state with high AIDS morbidity, has resulted in data for a greater percentage of U.S. cases of HIV infection. Cases of HIV/AIDS diagnosed during 2001--2004 and reported to CDC through June 2005 were analyzed. Cases included 1) diagnosis of HIV infection that had not progressed to AIDS, 2) diagnosis of HIV infection followed by a diagnosis of AIDS, and 3) concurrent diagnoses of AIDS and HIV infection (i.e., AIDS and HIV diagnoses in the same calendar month). Data from U.S. territories were not included. Cases were classified in the following hierarchy of transmission categories: 1) male-to-male sexual contact, 2) injection-drug use, 3) both male-to-male sexual contact and injection-drug use, 4) high-risk heterosexual contact (i.e., with someone of the opposite sex known to have HIV/AIDS or a risk factor [e.g., male-to-male sexual contact or injection-drug use] for HIV/AIDS), and 5) all other HIV risk factors combined. The number of HIV/AIDS diagnoses, rates per 100,000 population, and associated 95% confidence intervals (CIs) were calculated. Data were adjusted for reporting delays and redistribution of risk among persons initially reported without sufficient information to classify into a transmission category (3). Estimated annual percentage changes and 95% CIs were calculated for the annual numbers of diagnoses and rates. During 2001--2004, an estimated 157,252 persons had HIV/AIDS diagnosed in the 33 states reporting to CDC. Of these, 112,106 (71%) were male and 45,146 (29%) were female (Table 1). Blacks accounted for 80,187 (51%) of persons with HIV/AIDS diagnosed (68% among females and 44% among males); 45,479 (29%) were white; 28,673 (18%) were Hispanic; 1,340 (1%) were Asian/Pacific Islander; and 766 (<1%) were American Indian/Alaska Native. The route of HIV infection for the majority (61%) of males was through male-to-male sexual contact; 17% occurred through high-risk heterosexual contact, and 16% occurred through injection-drug use. The majority (76%) of females with HIV/AIDS diagnosed were exposed through high-risk heterosexual contact; 21% were exposed through injection-drug use. The proportional distribution of HIV/AIDS diagnosed among males and females by transmission category varied by race/ethnicity (Table 2). Although the main transmission category for males was male-to-male sexual contact, among blacks, one fourth of HIV infections occurred through high-risk heterosexual contact. The total number of HIV/AIDS diagnoses decreased from 41,207 (CI = 40,961--41,453) in 2001 to 38,685 (CI = 37,924--39,445) in 2004; the average annual decrease was not statistically significant. A nonsignificant average annual increase occurred in the number of HIV/AIDS diagnoses among men who have sex with men (MSM), from 16,609 (CI = 16,260--16,957) cases in 2001 to 18,196 (CI = 17,609--18,782) cases in 2004 (Figure 1). From 2003 to 2004, the number of HIV/AIDS diagnoses among MSM increased 8%; this increase was statistically significant (p<0.05). A significant average annual decrease of 9.1% occurred among injection-drug users (IDUs). The overall annual rate of HIV/AIDS diagnoses per 100,000 population did not change significantly, from 22.8 per 100,000 in 2001 to 20.7 per 100,000 in 2004. However, a significant 5.0% average annual decrease in rates among blacks was observed, from 88.7 per 100,000 in 2001 to 76.3 per 100,000 in 2004. Among Asian/Pacific Islanders, a significant 9.0% average annual increase occurred, from 5.6 per 100,000 in 2001 to 7.2 per 100,000 in 2004 (Figure 2). The highest annual rates were among blacks, followed by Hispanics, American Indian/Alaska Natives, whites, and Asian/Pacific Islanders. Reported by: L Espinoza, DDS, HI Hall, PhD, ML Campsmith, DDS, LM Lee, PhD, Div of HIV/AIDS Prevention, National Center for HIV, STD, and TB Prevention, CDC. Editorial Note:An important event in HIV/AIDS reporting is the inclusion of data from New York in the analysis of national HIV data in 2005. Although New York implemented name-based HIV/AIDS reporting in June 2000, this is the first time these data have been included in analyses of national surveillance data. As a result, an additional 36,111 HIV/AIDS diagnoses were added to the surveillance system during 2001--2004; this substantial addition should be considered when making comparisons with previous reports (4). An evaluation of the impact of adding a state with high morbidity to national surveillance data is under way. In April 2003, CDC launched the Advancing HIV Prevention (AHP) initiative to increase emphasis on HIV testing and providing prevention services for persons living with HIV (5). An estimated 25% of persons living with HIV do not know they are infected (1). AHP is aimed at getting persons with undiagnosed HIV tested and into care and prevention services. Because AHP emphasizes increased testing, an increase in HIV/AIDS diagnoses might be expected; however, a decrease in diagnoses among IDUs and blacks was observed. Subsequent analyses will examine whether these changes were a result of a differential change in testing patterns among various populations, decreased incidence of HIV infections, or the effect of additional data added to the national surveillance system. In addition, CDC is working with states to develop a new system for monitoring HIV incidence (i.e., new HIV infections) more directly through the use of a testing method that distinguishes recent from longstanding infections. The decrease in rates of diagnoses among blacks during 2001--2004 was driven, in part, by decreases in New York, which might be attributed to the New York epidemic being older than the epidemic in some other areas of the United States, the volume of cases reported into the system, and recent changes in reporting requirements.§ Decreases in HIV diagnoses among IDUs were consistent with other reports of success in reducing HIV incidence among IDUs (6) and might account, in part, for decreases observed among blacks. However, rates among blacks have remained high and warrant increased prevention efforts, especially among black MSM and black women. Although a statistically significant increase occurred from 2003 to 2004 in the number of diagnosed infections among MSM, the overall annual average percentage change from 2001 to 2004 was not significant. Flat trends in diagnoses were observed among white, black, and Hispanic MSM. The small upturn in diagnoses in 2003--2004 occurred for all racial/ethnic MSM populations. Increases in HIV diagnoses during this period are more difficult to interpret because of increasing emphasis on the benefits of increased testing among persons at high risk. Whereas increases among MSM might reflect increases in HIV incidence, consistent with increases in syphilis and other risk behaviors, they might also reflect increases in HIV testing among MSM. Increasing HIV testing among MSM is critical in light of a study of MSM aged 15--29 years in six U.S. cities, which reported that the proportion of unrecognized HIV infection was as high as 77% (7). Although a significant increase occurred in HIV/AIDS diagnoses among Asian/Pacific Islanders from 2001 to 2004, this population continues to have the lowest HIV/AIDS rates of any racial/ethnic population in the United States. The findings in this report are subject to at least two limitations. First, although AIDS is a reportable condition in all 50 states, name-based HIV data are not reportable in all states. The 33 states analyzed in this report are estimated to represent 63% of all AIDS cases in the United States during 2001--2004. Although the representativeness of the national data has improved, data from California are not included, which results in an under-representation of cases in the West. To describe the epidemic more completely, CDC is recommending that all states conduct name-based HIV reporting. As of October 2005, a total of 38 states¶ conducted name-based HIV/AIDS reporting that met CDC standards (2,8), and additional states have initiated procedures to adopt name-based HIV-infection reporting beginning in 2006. Personal identifiers are removed before data are submitted to CDC. Second, classification of cases with no identified risk factor was based on follow-up investigations; those cases were assumed to constitute a representative sample of all cases initially reported without a risk factor. In this analysis, the average annual diagnosis rate among blacks decreased; however, the rate in 2004 was 8.4 times higher among blacks than whites. Several factors contribute to higher risk for HIV infection among blacks, including higher prevalence of infection in the black community and, for females, greater likelihood of encountering high-risk heterosexual or bisexual male partners (9). The epidemic has continued to concentrate in groups that traditionally have had limited access to prevention services, medical care, and effective therapies. Prevention will require reassessment of ongoing activities to ensure resources target those at highest risk. Strengthening the partnership between government public health programs and affected communities and developing novel interventions that are culturally appropriate are essential to meet the needs of all groups affected by the epidemic. References
* For this report, persons identified as white, black, Asian, American Indian/Alaska Native, or of other/unknown race are all non-Hispanic. Persons identified as Hispanic might be of any race. † Alabama, Alaska, Arizona, Arkansas, Colorado, Florida, Idaho, Indiana, Iowa, Kansas, Louisiana, Michigan, Minnesota, Mississippi, Missouri, Nebraska, Nevada, New Jersey, New Mexico, New York, North Carolina, North Dakota, Ohio, Oklahoma, South Carolina, South Dakota, Tennessee, Texas, Utah, Virginia, West Virginia, Wisconsin, and Wyoming. § In addition to AIDS cases, in June 2000, New York began requiring that all confirmed HIV diagnostic tests, detectable HIV viral load tests, and CD4 counts of <500 µL be reported to the health department. Health-care providers are required to report all cases of HIV diagnosis, HIV illness, and AIDS. In June 2005, reporting requirements were changed to include all HIV viral load tests and all CD4 counts, regardless of value. ¶ Alabama, Alaska, Arizona, Arkansas, Colorado, Connecticut, Florida, Georgia, Idaho, Indiana, Iowa, Kansas, Kentucky, Louisiana, Michigan, Minnesota, Mississippi, Missouri, Nebraska, Nevada, New Hampshire, New Jersey, New Mexico, New York, North Carolina, North Dakota, Ohio, Oklahoma, Pennsylvania, South Carolina, South Dakota, Tennessee, Texas, Utah, Virginia, West Virginia, Wisconsin, and Wyoming.
Table 1
Disclaimer All MMWR HTML versions of articles are electronic conversions from ASCII text into HTML. This conversion may have resulted in character translation or format errors in the HTML version. Users should not rely on this HTML document, but are referred to the electronic PDF version and/or the original MMWR paper copy for the official text, figures, and tables. An original paper copy of this issue can be obtained from the Superintendent of Documents, U.S. Government Printing Office (GPO), Washington, DC 20402-9371; telephone: (202) 512-1800. Contact GPO for current prices. **Questions or messages regarding errors in formatting should be addressed to mmwrq@cdc.gov.Date last reviewed: 11/17/2005 |
|||||||||
|