|
|
|
|
|
|
|
| ||||||||||
|
|
|
|
|
|
|
||||
| ||||||||||
|
|
|
|
|
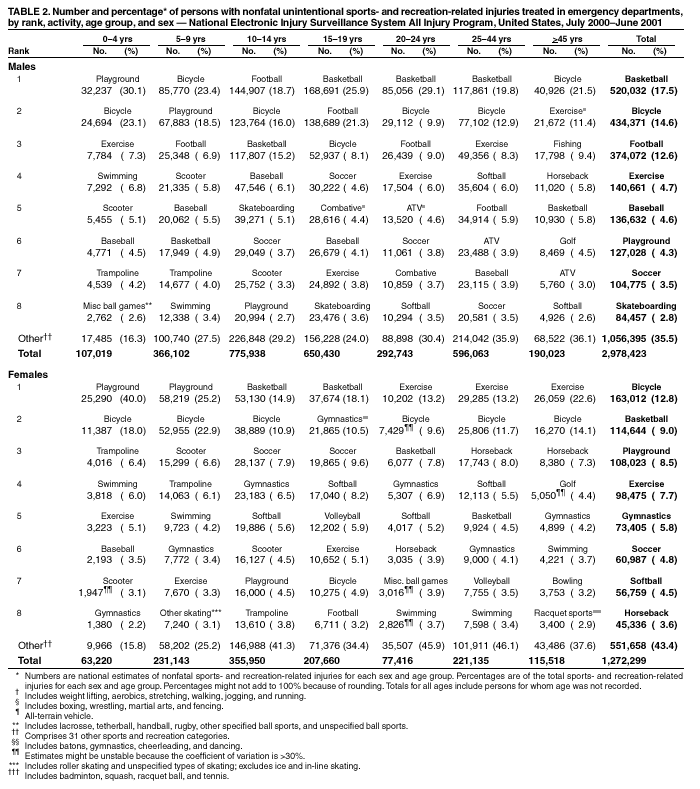
Persons using assistive technology might not be able to fully access information in this file. For assistance, please send e-mail to: mmwrq@cdc.gov. Type 508 Accommodation and the title of the report in the subject line of e-mail. Nonfatal Sports- and Recreation-Related Injuries Treated in Emergency Departments --- United States, July 2000--June 2001Each year in the United States, an estimated 30 million children and adolescents participate in organized sports (1), and approximately 150 million adults participate in some type of nonwork-related physical activity (2). Engaging in these activities has numerous health benefits but involves a risk for injury. CDC analyzed data from the National Electronic Injury Surveillance System All Injury Program (NEISS-AIP) to characterize sports- and recreation-related injuries among the U.S. population. This report summarizes the results of that analysis, which indicate that during July 2000--June 2001 an estimated 4.3 million nonfatal sports- and recreation-related injuries were treated in U.S. hospital emergency departments (EDs). Injury rates varied by sex and age and were highest for boys aged 10--14 years. Effective prevention strategies, including those tailored to specific activities and those aimed at children, adolescents, and adults, are needed to reduce sports- and recreation-related injuries in the United States. NEISS-AIP is operated by the U.S. Consumer Product Safety Commission (CPSC) and collects data on initial visits for all types and causes of injuries treated in U.S. EDs. NEISS-AIP data are drawn from a nationally representative subsample of 66 out of 100 NEISS hospitals, which were selected as a stratified probability sample of hospitals in the United States and its territories with a minimum of six beds and a 24-hour ED. NEISS-AIP provides data on approximately 500,000 injury- and consumer product--related ED cases each year. Sports- and recreation-related injuries included those occurring during organized and unorganized activities, whether work-related or not. An injury was defined as bodily harm resulting from exposure to an external force or substance. Each case was classified into one of 39 mutually exclusive sports- and recreation-related groups based on an algorithm that considered both the consumer products involved (e.g., bicycles or accessories, swings or swing sets, or in-line skating [activity, apparel, or equipment]) and the narrative description of the incident. Cases were excluded if 1) the principal diagnosis was an illness, pain only, psychological harm only, contact dermatitis associated with consumer products or plants, or unknown; 2) the ED visit resulted from the adverse effects of therapeutic drugs or surgical care; or 3) the injury was violence-related, including intentional self-harm, assault, or legal intervention. Because deaths are not captured completely by NEISS-AIP, persons who were dead on arrival or who died in the ED also were excluded. Each case was assigned a sample weight based on the inverse probability of selection; these weights were added to provide national estimates of sports- and recreation-related injuries. Estimates were based on weighted data for 70,060 sports- and recreation-related ED visits during July 2000--June 2001. Confidence intervals (CIs) were calculated by using a direct variance estimation procedure that accounted for the sample weights and complex sample design. Rates were calculated by using averaged 2000--2001 U.S. Census Bureau population data. During July 2000--June 2001, an estimated 4.3 million (95% CI=3.7--4.8 million) sports- and recreation-related injuries were treated in U.S. hospital EDs, comprising 16% of all unintentional injury-related ED visits (Table 1). The percentage of all unintentional injury-related ED visits that were sports- and recreation-related was highest for persons aged 10--14 years (51.5% for boys, 38.0% for girls), and lowest for persons aged >45 years (6.4% for men, 3.1% for women). The overall rate of sports- and recreation-related injuries was 15.4 per 1,000 population (Table 1). Rates were highest among persons aged 10--14 years (75.4 for boys, 36.3 for girls), and lowest among persons aged 0--4 years (11.1 for boys, 6.8 for girls) and persons aged >45 years (4.3 for men, 2.2 for women). Among all ages, rates were higher for males than for females (Figure). Types of sports- and recreation-related activities in which persons were engaged when injured varied by age and sex. For persons aged 0--9 years, the leading types were playground- and bicycle-related injuries (Table 2). Both scooter- and trampoline-related injuries ranked among the top seven types of injuries for both boys and girls aged 0--9 years. For males aged 10--19 years, football-, basketball-, and bicycle-related injuries were most common. For females aged 10--19 years, basketball-related injuries ranked highest. For persons aged 20--24 years, basketball- and bicycle-related injuries ranked among the three leading types of injuries. Basketball-related injuries ranked highest for men aged 25--44 years. Exercise (e.g., weight lifting, aerobics, stretching, walking, jogging, and running) was the leading injury-related activity for women aged >20 years and ranked among the top four types of injuries for men aged >20 years. The most frequent injury diagnoses were strains/sprains (29.1%; 95% CI=25.2%--33.0%), fractures (20.5%; 95% CI=16.5%--24.5%), contusions/abrasions (20.1%; 95% CI=17.5%--22.8%), and lacerations (13.8%; 95% CI=11.9%--15.8%). The body parts injured most commonly were ankles (12.1%; 95% CI=10.9%--13.4%), fingers (9.5%; 95% CI=8.2%--10.8%), face (9.2%; 95% CI=7.9%--10.5%), head (8.2%; 95% CI=6.4%--10.1%), and knees (8.1%; 95% CI=6.8%--9.4%). Of an estimated 350,734 (95% CI=270,417--431,051) persons with sports- and recreation-related head injuries, approximately 199,050 (95% CI=127,947--270,153) had a brain injury diagnosed (i.e., diagnosis of concussion or internal injury). Overall, 2.3% (95% CI=1.5%--3.0%) of persons with sports- and recreation-related injuries were hospitalized. Reported by: K Gotsch, JL Annest, PhD, P Holmgreen, MS, Office of Statistics and Programming; J Gilchrist, MD, Div of Unintentional Injury Prevention, National Center for Injury Prevention and Control, CDC. Editorial Note:This report indicates that an estimated 4.3 million sports- and recreation-related injuries are treated each year in U.S. EDs. These injuries occur among all population groups and account for more ED visits annually than injuries involving motor-vehicle occupants (3.5 million). Effective prevention efforts are needed to reduce the risk for these injuries among all population groups. Interventions to reduce the risk for sports- and recreation-related injuries can be classified into three categories: personal countermeasures (e.g., use of safety gear), behavioral interventions (e.g., proper conditioning), and environmental modifications (e.g., use of padded goal posts). Specific prevention recommendations vary by sport and recreation activity, and some activity-specific interventions can decrease the risk for injury. For example, wearing helmets while bicycling reduces the risk for head injury by 85% (4), and using breakaway bases decreases the number of sliding-related baseball and softball injuries by 96% (5). Further studies are needed to identify effective interventions for other activities and injury types. Data on sports- and recreation-related injuries from other national and state hospital-based data systems are limited because the International Classification of Diseases, Ninth Revision, Clinical Modification external cause-of-injury codes (E codes) typically do not specify the type of activity in which the person was engaged at the time of injury. In comparison, these types of injuries can be classified from NEISS-AIP data by using the consumer product codes and a narrative description of the incident. This approach makes NEISS-AIP a useful surveillance tool for characterizing and monitoring sports- and recreation-related injuries and identifying emerging injury problems requiring further investigation. Estimates in this report are higher than those found during 1997--1998 by the National Hospital Ambulatory Medical Care Survey, which indicated that an estimated 3.7 million ED visits were made annually to treat sports- and recreation-related injuries (6). Although this estimate was based on a review of narrative fields, no consumer product codes were collected, which might have resulted in an underestimation of the number of ED visits. Sports- and recreation-related injuries treated in EDs represent only a portion of these types of injuries that receive medical attention; many more of these injuries are treated in other settings (e.g., health-care providers' offices and clinics) (7). The findings in this report are subject to at least five limitations. First, injury rates were based on the U.S. population; data on exposure time or frequency of participation were not collected. Because of the lack of exposure data, these estimates cannot be used to compare relative risks for different sports or for different age groups or sexes. Second, NEISS-AIP captures only injuries treated in hospital EDs. Third, it could not be determined whether a sports- and recreation-related injury was a new injury or an aggravation of an injury sustained previously. Fourth, NEISS-AIP narrative descriptions do not provide detailed information about injury circumstances (e.g., whether or not the activity was organized, whether the injury occurred during training or competition, or whether protective equipment was used). Finally, NEISS-AIP is designed to provide national estimates but not state or local estimates. The national health objectives for 2010 (8) and The Surgeon General's Call to Action to Prevent and Decrease Overweight and Obesity (9) emphasize the importance of physical activity. The benefits of physical activity are substantial; however, persons engaging in such activity should be aware of their risk for injury. Additional information about safe participation in sports- and recreation-related activities are available at http://www.cdc.gov/safeusa/siteindex.htm. Acknowledgments This report was based on data contributed by T Schroeder, MS, C Downs, A McDonald, MA, and other staff of the Div of Hazard and Injury Data Systems, U.S. Consumer Product Safety Commission; and with the assistance of L Doll, PhD, E Sogolow, PhD, G Ryan, PhD, National Center for Injury Prevention and Control, CDC. References
|
Use of trade names and commercial sources is for identification only and does not imply endorsement by the U.S. Department of
Health and Human Services. |
Disclaimer All MMWR HTML versions of articles are electronic conversions from ASCII text into HTML. This conversion may have resulted in character translation or format errors in the HTML version. Users should not rely on this HTML document, but are referred to the electronic PDF version and/or the original MMWR paper copy for the official text, figures, and tables. An original paper copy of this issue can be obtained from the Superintendent of Documents, U.S. Government Printing Office (GPO), Washington, DC 20402-9371; telephone: (202) 512-1800. Contact GPO for current prices.
**Questions or messages regarding errors in formatting should be addressed to mmwrq@cdc.gov.Page converted: 8/22/2002
|
|
|||||
|
HOME |
ABOUT MMWR |
MMWR SEARCH |
DOWNLOADS |
RSS
|
CONTACT
|
|||||
|
|
|||||
|
This page last reviewed 8/22/2002