 |
|
|
|
|
|
|
| ||||||||||
|
|
|
|
|
|
|
||||
| ||||||||||
|
|
|
|
|
Persons using assistive technology might not be able to fully access information in this file. For assistance, please send e-mail to: mmwrq@cdc.gov. Type 508 Accommodation and the title of the report in the subject line of e-mail. Cardiovascular Disease Risk Factors and Preventive Practices Among Adults -- United States, 1994 A Behavioral Risk Factor AtlasRobert A. Hahn, Ph.D., M.P.H. 1 Gregory W. Heath, D.H.Sc., M.P.H. 2 Man-Huei Chang, M.P.H. 1 Behavioral Risk Factor Surveillance System State Coordinators (1) Division of Prevention Research and Analytic Methods Epidemiology Program Office (2) Division of Adult and Community Health National Center for Chronic Disease Prevention and Health Promotion Abstract Problem/Conditions: Cardiovascular disease (CVD), including coronary heart disease (CHD) and stroke, is the leading cause of death in the United States, and state rates of CVD vary by state and by region of the country. Several behavioral risk factors (i.e., overweight, physical inactivity, smoking, hypertension, and diabetes mellitus) and preventive practices (i.e., weight loss and smoking cessation) are associated with the development of CVD and also vary geographically. This summary displays and analyzes geographic variation in the prevalences of selected CVD risk factors. Reporting Period: 1994 (1992 for prevalence of hypertension). Description of System: The Behavioral Risk Factor Surveillance System (BRFSS) is a state-based random-digit-dialing telephone survey of noninstitutionalized adults aged greater than or equal to 18 years; 50 states and the District of Columbia participated in BRFSS in 1994, and 48 states and the District of Columbia participated in 1992. Methods: Several different analyses were conducted: a) analysis of state risk factor and preventive practice prevalences by sex and race (i.e., black and white); b) mapping; c) cluster analysis; d) correlations of state prevalence rates by sex and race; and e) regression of state risk factor prevalences on state CHD and stroke mortality rates. Results: Mapping the prevalence of selected CVD risk factors and preventive health practices indicates substantial geographic variation for black and white men and women, as confirmed by cluster analysis. Data for blacks are limited by small sample size, especially in western states. Geographic clustering is found for physical inactivity, smoking, and risk factor combinations. Risk factor prevalences are generally lower in the West and higher in the East. White men and white women are more similar in state risk factor rates than other race-sex pairs; white women and black women ranked second in similarity. State prevalences of physical inactivity and hypertension are strongly associated with state mortality rates of CVD. Interpretation: Geographic patterns of risk factor prevalence suggest the presence (or absence) of sociocultural environments that promote (or inhibit) the given risk factor or preventive behavior. Because the risk factors examined in this summary are associated with CVD, further exploration of the reasons underlying observed geographic patterns might be useful. The BRFSS will continue to provide geographic data about cardiovascular health behaviors with a possible emphasis on more data-based small-area analyses and mapping. This will permit states to more adequately monitor trends that affect the burden of CVD in their regions and the United States. Mapping also facilitates the exploration of patterns of morbidity, health-care use, and mortality, as well as the epidemiology of risk factors. Finally, by identifying those segments of the population with high levels of these risk factors and lower levels of the preventive health practices, public health personnel can better allocate resources and target intervention efforts for the prevention of CVD. INTRODUCTION Although age-adjusted cardiovascular mortality declined by 58% from 1950 through 1995 (1), cardiovascular disease (CVD), including stroke and coronary heart disease (CHD), remains a major public health problem in the United States. In 1995, CVD was the principal diagnosis in 5 million (16.2%) hospital patient discharge records in the United States (2) and was the leading cause of death, accounting for 38.7% of all deaths in the United States (1). The prevalence, mortality, and health-care use associated with CVD in the United States vary substantially by geographic region and state (2,3,4). In 1994, stroke was 51% more prevalent in the South than in the Northeast, and CHD was 29% more prevalent in the South than in the West (4). In 1994, the ratios of the highest to the lowest age-adjusted state mortality rates for CHD and stroke in the United States were 4.1 and 4.4, respectively (5). Health-care use also varies substantially by region. In 1995, rates of hospital discharge for CVD were between 40% and 69% times greater in the Northeast, South, and Midwest than in the West (2). Geographic variations in CVD prevalence, mortality, and health-care use might correspond to differences in a) demographic or risk behavior profiles (e.g., smoking {6}, physical inactivity {7}, or risk factor combinations {8} among state residents); b) physical environment (e.g., excessive heat {9} and air pollution {10}); and c) social environment (e.g., laws taxing cigarettes or restricting cigarette use) (11,12). This atlas displays distribution of major behavioral risk factors and preventive practices for CVD among black and white men and women in the 50 states and the District of Columbia. The atlas presents maps for five risk factors (i.e., overweight, physical inactivity, smoking, hypertension, and diabetes mellitus), risk factor combinations, and two preventive practices (i.e., weight loss and smoking cessation). Racial differences in risk factor prevalence are examined to facilitate exploration of well-recognized racial differences in health status. Only blacks and whites are examined in this analysis because of inadequate sample sizes in the data source for other populations. In this summary, we review the association of known behavioral risk factors and preventive practices with CVD and specify the criteria used to assess each risk factor analyzed. We then analyze the geographic clustering of CVD risk factors among states and examine the association of state risk factor prevalence rates with state rates of stroke mortality and heart disease mortality. Use of this atlas might facilitate the exploration of geographic patterns of CVD and of the risk factors as well. The atlas might also indicate the need for interventions to reduce cardiovascular risk factors in specific regions and enhance analysis of trends and evaluation of interventions. Risk Factors CHD risk factors analyzed in this report have been chosen for the reasons discussed in the following sections. Overweight Overweight is associated with high rates of CVD deaths, especially sudden death among men and congestive heart failure among women (13). The high death rate might occur largely as a consequence of the influence of overweight on blood pressure, blood lipid levels, and the onset of diabetes (13); however, a report from the Framingham Study indicates that overweight is also an independent risk factor for CVD (14). With rare exceptions, overweight develops from eating too much and exercising too little. The prevalence of overweight has increased substantially in the U.S. population during the last 10 years (15). Physical Inactivity A review of 43 epidemiologic studies in 1987 indicated that physical activity reduces the risk of CHD (16). The relative risk for CHD associated with physical inactivity is approximately 1.9, slightly lower than the relative risks associated with increased systolic blood pressure (2.1), cigarette smoking (2.5), and elevated serum cholesterol levels (2.4) (17). Several studies indicate that endurance exercise training among patients with documented CHD is associated with reduced morbidity and mortality (18,19) and that physical activity might improve the likelihood of survival from a myocardial infarction (i.e., heart attack) (20). In addition, evidence documents an association between regular, moderate-intensity physical activity and the lowering of several other risk factors for CVD, including blood lipid levels, resting blood pressure among persons with borderline hypertension, body composition and overweight, and glucose tolerance and insulin sensitivity (21). Smoking Evidence indicating cigarette smoking as a risk factor for CVD is substantial (12). Overall, smokers have a 70% greater level of CVD risk than nonsmokers; persons who smoke greater than or equal to 2 packs of cigarettes per day have a two- to threefold greater risk for CVD (17). The risk for CVD also increases with greater depth of inhalation and with increasing years of smoking, although persons who stop smoking eventually reduce their risk for CVD to a level approaching that of nonsmokers (22). Cigarette smoking has been reported to act synergistically with other known risk factors for CVD (23). Hypertension High blood pressure is another major risk factor for CVD (24). Some evidence documents that blood pressure-related risk for CVD increases continuously from lowest to highest values for either systolic or diastolic blood pressure (25). Elevated blood pressure is often associated with other well-known risk factors, including dietary intake, elevated blood lipid levels, obesity, smoking, diabetes mellitus, and physical inactivity (24). The prevalence of hypertension has declined substantially in the last 20 years (26). Diabetes Mellitus The glucose intolerance that accompanies diabetes mellitus is a direct effect of overweight and is often associated with hypertriglyceridemia, hypertension, elevated LDL cholesterol, and depressed HDL (27). Some evidence documents that diabetes mellitus has a vasculotoxic effect, which is greatest for occlusive peripheral vascular disease; however, CHD and stroke are its most common manifestations (27). The risk for CVD is three times as high among diabetic women as it is among women without diabetes mellitus. Similarly, the risk for CVD is twice as high among diabetic men as it is among men without diabetes mellitus (27). Risk Factor Combinations Many CVD risk factors interact physiologically in the etiology of CVD (28,29). Persons with risk factor combinations are at an increased risk for CVD. Obesity is an example of a risk factor for CHD that influences other risk factors, including hyperlipidemia, hypertension, and diabetes mellitus. Physical inactivity has been related to obesity, lipid abnormalities, hypertension, and diabetes mellitus (21,30). Preventive Practices Several preventices practices have been demonstrated to reduce the risk of CHD. The preventive practices analyzed in this report have been chosen for the reasons discussed in the following sections. Weight Loss Weight control is a first step in the control of mild hypertension, hyperlipidemia, and impaired glucose tolerance and might eliminate the necessity of lifelong drug therapy for these conditions (13). Efforts to control weight generally have not been effective (31); however, researchers have demonstrated recently the effectiveness of combined programs of behavior modification of diet and exercise (31,32). Therapeutic approaches to weight control that emphasize increased physical activity have other benefits in addition to increasing caloric expenditure (16). Smoking Cessation Persons who stop smoking, especially before age 50 years, live longer than those who continue to smoke. After 15 years of abstinence from smoking, the risk for CVD approaches that of persons who have never smoked. Among persons with previously diagnosed myocardial infarction or stroke, smoking cessation reduces the risk for recurrent heart attack and death from stroke by 50% (22). METHODS Sampling We used the Behavioral Risk Factor Surveillance System (BRFSS) data from 1992 and 1994. Data for 1992 were used to assess the prevalence of hypertension because data on hypertension in many states were not available in 1994. BRFSS data for 1995 were not used because they did not include information on physical activity. Arkansas and Wyoming did not participate in BRFSS in 1992; all 50 states and the District of Columbia participated in 1994. Using random-digit-dialing telephone survey techniques, participating states select a probability sample of their noninstitutionalized adult population (aged greater than or equal to 18 years) with telephones. The Waksberg method (34), a multistage cluster-sampling design, was used in most states (37 states in 1994), whereas other states have chosen different sampling methods (e.g., simple-random or stratified sample designs) to meet their special needs. The standard BRFSS questionnaire includes questions from previously conducted national surveys (e.g., Health Promotion Disease Prevention Supplement to the National Health Interview Survey {35}). Modules of questions on additional topics are developed by CDC and added at the discretion of each state (36). BRFSS also contains basic demographic and socioeconomic information (e.g., age, race/ethnicity, family income, and educational attainment). Analysis This summary provides state risk factor prevalences estimated from the survey participant's probability of selection in each state, weighted by the distribution of the state population by age, race, and sex. Prevalence estimates for each risk factor include only participants who gave specific responses for this risk factor. State risk factor prevalence rates were not reported if the sample size for a given population (e.g., black women) was less than 50. Data were drawn from the BRFSS electronic source by using Statistical Analyses Software (SAS ) (37). Epi-Info (38) and Epi-Map (39) were applied to produce maps of the prevalence of risk factors and preventive practices in the 50 states and the District of Columbia. We do not present age-standardized state prevalences because we were interested in the burden of risk behavior in states. State prevalences were stratified into quartiles. We examined three questions regarding the geographic distribution of risk factors. First, does a geographic pattern of the distribution of risk factors exist (e.g., higher rates in one region of the country than in another)? In addition to visual review, we used the Ohno method (40) in CLUSTER Software (41) to detect the presence of clustering of state prevalence rates of the risk factors and preventive practices for each race and sex group. The Ohno method uses a Chi-square test to determine whether the observed number of bordering states with similar rates is more than expected to occur by chance under the null hypothesis of no geographic clustering. Similar rates are defined as rates within the same quartile. We omitted from the cluster analysis noncontiguous states (i.e., Alaska and Hawaii) and states with unreliable prevalence rates (i.e., sample sizes less than 50). Second, does race, sex, or some combination of these account for greater similarity in the distribution of state prevalence rates (e.g., are state prevalence rates for black women closer to those for white women or to those for black men)? For each risk factor and preventive practice and for all risk factors combined, we correlated state prevalence rates using Pearson correlation coefficients for each race-sex pair using the SAS software. The analysis excluded states without prevalence estimates. We compared the magnitude of correlation for each race-sex pair among statistically significant correlations. Third, does the distribution of risk factor prevalences among states correspond to state CVD mortality patterns? For each sex-race group, we conducted linear multiple regression analyses in which 1994 state mortality rates for all ages were the dependent variables and the independent variables were state behavioral risk factor prevalences. For heart disease, the International Classification of Diseases, Ninth Revision, Clinical Modification (ICD-9-CM) codes were 390-8, 402, 404-29; for stroke, the ICD-9-CM codes were 430-8. We used mortality data from CDC's WONDER data system (42) and the Shapiro-Wilks statistic in SAS to assess the normality of mortality rates for regression analyses. Because state risk factor prevalences were not age-adjusted, we did not age-adjust mortality rates. We began with a model that included all of the risk factors and eliminated the risk factor with the highest p value in each succeeding model, until all p values were less than 0.05 in the final model. State risk factor prevalence rates were excluded from this analysis if the sample size for a given population was less than 50. Definitions of Risk Factors and Preventive Health Practices Overweight: Body mass index (BMI = weight {kg}/height {m2}) greater than or equal to 27.8 for men and greater than or equal to 27.3 for women. These values approximate the sex specific 85th percentile of BMI that was estimated from NHANES II (1) for persons aged 20-29 years in the United States (Healthy People 2000, objective 2.3 {33}). Physical Inactivity: No reported exercise, recreation, or physical activities (other than regular job duties) during the previous month (Healthy People 2000, objective 1.5). Smoking: Current regular use of cigarettes by persons who have ever smoked at least 100 cigarettes (Healthy People 2000, objective 3.4). Hypertension: Survey participants having ever been told by a health professional that they have high blood pressure (Healthy People 2000, objective 15.5). Diabetes Mellitus: Survey participants having ever been told by a physician that they have diabetes (Healthy People 2000, objective 17.11). Risk Factor Combinations: Survey participants having greater than or equal to 2 of the following risk factors: overweight, physical inactivity, smoking, and diabetes mellitus. Hypertension is not included because information on this risk factor was not available in 1994, the year for which risk factor combinations are examined. Weight Loss: Survey participants trying to lose or maintain or keep from gaining weight and who are either eating fewer calories or eating less fat or using physical activity or exercise to maintain, lose, or keep from gaining weight (Healthy People 2000, objective 2.7). Smoking Cessation: Survey participants ever having smoked 100 cigarettes and having quit smoking for greater than or equal to 12 months (Healthy People 2000, objective 3.6). RESULTS BRFSS sample sizes used for state prevalence estimates varied by risk factor. Excluding states for which race-sex group sample sizes were less than 50, the study sample included a maximum of 38,089 white men; 53,205 white women; 3,028 black men; and 5,989 black women. Because of small sample sizes, 28-29 states among black men and 19-21 states among black women were excluded from analysis for the five study risk factors. The states with missing information among blacks varied by risk factor; in general, prevalence information was not available for many western and northeastern states. All states had sufficient sample sizes to calculate reliable prevalence estimates among whites for all risk factors, except as noted for hypertension, for which information was not available for Wyoming and Arkansas. Prevalence of Risk Factor and Preventive Measures Overweight Median state prevalences of overweight are higher for blacks than for whites, higher for white men (28.5%) than for white women (24.9%), and higher for black women (42.6%) than for black men (37.0%) (Table_1). No clear geographic pattern of the prevalence of overweight among white men or black men exists (Figure_1A) and (Figure_1C). Among white and black women, the higher prevalence rates are found in the northeastern quadrant of the nation (Figure_1B) and (Figure_1D). No statistically determined clusters for this risk factor exist among whites, for whom clusters could be assessed. Physical Inactivity Median state prevalences of physical inactivity are higher for blacks than for whites and higher for women than for men (Table_1). State prevalences of physical inactivity among white men are generally higher in the East and lower in the West (Figure_2A). A similar pattern among white women is evident (Figure_2B) and is confirmed by significant clustering. Available data for blacks suggest that state prevalences of physical inactivity are generally higher in the South and lower in the North (Figure_2C) and (Figure_2D); however, patterns are not clear because of insufficient data from several states. Smoking Median state prevalences of smoking are similar for blacks and whites but higher for men than for women (Table_1). Among white men, state prevalences of smoking are generally higher in the East and lower in the West, as confirmed by significant clustering (Figure_3A). Among white women, the geographic pattern is similar, but not as clearly defined as for white men (Figure_3B). Among black men, no clear geographic pattern exists (Figure_3C). Among black women, prevalences are generally higher in northern states and lower in southern states (Figure_3D). Hypertension Median state prevalences of hypertension are higher for blacks than for whites and higher for women than for men (Table_1). State prevalences of hypertension among white men are generally higher in the northeastern quadrant and lower in the West (with the exceptions of Nevada and Arizona) (Figure_4A). No clear geographic patterns exist among white women, black men, or black women (Figure_4B), (Figure_4C), and (Figure_4D). No statistically determined clusters exist for this risk factor among whites, for whom clusters could be assessed. Diabetes Mellitus Median state prevalences of diabetes mellitus are higher for blacks than for whites, slightly higher for white men (4.0%) than for white women (3.7%), and slightly higher for black women (6.8%) than for black men (6.1%) (Table_1). State prevalences of diabetes mellitus among white men are generally higher in southern states (Figure_5A). State prevalences of diabetes mellitus among white women are generally higher in a band of states from Connecticut, Rhode Island, and Michigan to Texas, and lower in the West (Figure_5B). No apparent geographic pattern of state prevalences of diabetes mellitus exists among black men or black women (Figure_5C) and (Figure_5D). No statistically determined clusters for this risk factor exist among whites, for whom clusters could be assessed. Risk Factor Combinations Median state prevalences of risk factor combinations are higher for blacks than for whites, higher for white men than for white women, and higher for black women than for black men (Table_1). Among the study sample for 1994, 40.1% have no risk factors, 38.2% have just one, 18.0% have just two, 3.4% have just three, and 0.2% have four risk factors. State prevalences of risk factor combinations among white men and white women are generally higher in the East and lower in the West; geographic patterns for both white men and white women are confirmed by significant clustering (Figure_6A) and (Figure_6B). No clear geographic pattern of the state prevalences of risk factor combinations exists among black men and black women (Figure_6C) and (Figure_6D). Weight Loss Median state prevalences of weight-loss practices are higher for whites than for blacks and higher for women than for men (Table_1). Prevalence rates are generally higher in the West for white men and white women (Figure_7A) and (Figure_7B). No apparent geographic pattern of state prevalences of weight-loss practices exists among black men and women (Figure_7C) and (Figure_7D). No statistically determined clusters for this risk factor exist among whites, for whom clusters could be assessed. Smoking Cessation Median state prevalences of smoking cessation are higher for whites than for blacks and higher for men than for women (Table_1). No apparent geographic pattern of state prevalences of smoking cessation exists among white men (Figure_8A). Among white women, state prevalences of smoking cessation are highest in coastal and border states (Figure_8B). No apparent geographic pattern of state prevalences of smoking cessation exists among black men and women (Figure_8C) and (Figure_8D). No statistically determined clusters exist for this preventive practice among whites, for whom clusters could be assessed. Associations Among State Risk Factor Prevalences by Race and Sex Because of the small sample sizes of blacks in many western and northeastern states, comparison of similarity in state prevalences among white men, white women, black men, and black women is possible principally for the eastern states. Comparison of correlations of state risk factor profiles among all race-sex pairs indicates that white men and white women are most similar to each other; correlations of prevalence rates for all risk factors among whites are statistically significant (p less than or equal to 0.05). Among significant correlations, second in similarity among race-sex pairs are white women and black women; this correlation is significant for overweight, physical inactivity, hypertension, weight loss, and smoking cessation -- but not for diabetes mellitus. For diabetes mellitus, correlations are highest for the black men and white men pair. Among race-sex pairs, black men and black women are significantly correlated only for physical inactivity and weight loss; however, these correlations are lower (i.e., fourth and sixth out of six pairs, respectively) than those of most other race-sex pairs. Associations Between State Risk Factor Prevalences and State CVD Mortality Regression analysis of state risk factor prevalences on state rates of mortality from CHD and stroke among the four race-sex pairs are limited to states with sufficient sample sizes; thus, regression analyses of risk factors and mortality among blacks are restricted to a relatively small number of states. Mortality distributions are not significantly different from normal for CHD in any race-sex group and are significantly different from normal for stroke mortality only among black men. Thus, we do not transform the dependent variable in regression analyses. Analysis indicates that state rates of physical inactivity are predictive of state CHD mortality rates among each of the four race-sex groups. In addition, state rates of diabetes are predictive of state CHD mortality rates among white women, and state rates of hypertension are predictive of state CHD mortality rates among white men. State rates of hypertension are predictive of stroke mortality among white men and women, and state rates of physical inactivity are predictive of state rates of stroke mortality among white women. No risk factors are predictive of stroke mortality among black men or black women. State rates of overweight and smoking are not predictive of mortality from either cause. Regression models * of effects of state risk factor prevalences on CHD and stroke among adults -- United States, 1994 -------------------------------------------------------------------- ------- Outcome CHD Mortality White men: CHD = -56.74 + 317.97 * INACTIVE + 1354.73 * HYPERTENSION White women: CHD = 56.50 + 476.93 * INACTIVE + 2114.71 * DIABETES Black men: CHD = 111.06 + 418.70 * INACTIVE Black women: CHD = 41.46 + 424.76 * INACTIVE Stroke Mortality White men: Stroke = 12.87 + 37.94 * INACTIVE + 126.88 * HYPERTENSION White women: Stroke = 12.76 + 290.24 * HYPERTENSION -------------------------------------------------------------------- --------
DISCUSSION This atlas of state prevalences of cardiovascular risk factors and preventive practices for white and black men and women in the United States indicates little geographic patterning for some risk factors and preventive practices (e.g., weight loss and smoking cessation), moderate patterning for others (e.g., diabetes mellitus and hypertension), and marked patterning for others (e.g., physical inactivity, smoking, and risk factor combinations). The presence (or absence) of geographic patterning among white men and white women is confirmed by cluster analysis. The atlas indicates an eastern concentration of high state prevalences of several CVD risk factors (i.e., physical inactivity, smoking, and risk factor combinations) and low state prevalences of two preventive practices (i.e., weight loss and smoking cessation). Thus, risk factor prevalences are lower and preventive practice prevalences are higher among western states. Among blacks, such comparison is not possible because of inadequate information on most western states. Correlation of state risk factor prevalences for four race-sex pairs indicates that among six possible comparisons, a) white men and white women are most similar in state risk factor profiles; b) white women and black women are second in similarity; and c) black men and black women are among the least similar. This finding suggests that neither race nor sex is uniformly a predictor of similarity in behavior among racial sex groups. The targeting of prevention messages might require specification of racial sex group combinations. These associations might be confounded (e.g., by age or socioeconomic position). For example, the proportion of persons aged greater than or equal to 65 years in the West is smaller than proportions in the Midwest, Northeast, and South (43), and greater age might be associated with greater risk factor prevalence. However, comparison of state prevalence maps unadjusted for age (in this summary) and adjusted for age (not presented in this summary) reveals modified rates for some states with large proportions of younger or older populations (e.g., Alaska and Florida) but indicates little difference in overall national patterns. Regarding socioeconomic position, western states do not systematically exceed the national median of household income (43). However, western states do have higher proportions of the population who have completed high school (44). A plausible explanation of East-West prevalence differences is that the East and the West differ in their sociocultural environments related to risk factor avoidance, health promotion, and preventive behavior; however, no evidence supports this hypothesis. Regression analysis indicates that state prevalences of some cardiovascular risk factors, particularly physical inactivity and hypertension, are predictive of mortality from CHD and stroke. Among whites, risk factor maps correspond to detailed maps of health-service areas with high mortality rates for CHD along the Mississippi and Ohio valleys; for blacks, insufficient information on risk factor prevalences in many states prevents comparison (3). Except for physical inactivity, little apparent correspondence exists between high state risk factor prevalences and high stroke mortality as depicted in detailed mortality maps. Although stroke mortality is highest in the Southeast and southeastern quadrant for all race-sex groups, high risk factor prevalences other than physical inactivity are not predominantly concentrated in this region (3). Findings here differ from conclusions of a recent analysis of BRFSS data for 1991-1992 (8). However, our study included all persons aged greater than or equal to 18 years (rather than only those aged 45-74 years), and our analysis was stratified by race as well as sex. The data in this report indicate that, among blacks, higher prevalences of CHD risk factors (except for smoking) and lower prevalences of preventive practices exist. This finding is consistent with higher national rates of CHD morbidity and mortality among blacks. These risk factors can be changed or managed for healthier outcomes. In addition to problems of misclassification associated with the ecological comparison of state prevalences and state mortality, between 1993 and 1994, approximately 2.7% of the U.S. population moved from one state to another, and national trends existed in interregional migration as well (45). Because rates of interstate migration have been similar or higher during the past 20 years, current state risk factor prevalence rates cannot be assumed to reflect the prevalences of risk factors among long-term state residents. Several studies indicate the reliability or validity of BRFSS data. One study compared estimates from BRFSS telephone questions with measured physical characteristics for several cardiovascular risk factors (46). The validity of self-reported BMI was assessed using a cutoff value between the standards for men and women. Using measured height and weight as standards, researchers reported a sensitivity of 77% and a specificity of 99% for self-report of BMI among men and a sensitivity of 72% and a specificity of 99% for self-report of BMI among women. For cigarette smoking, as validated by lung capacity, researchers reported a sensitivity of 78% and a specificity of 97% among men and a sensitivity of 86% and a specificity of 96% among women. For diabetes, as validated by fasting serum glucose, researchers reported a sensitivity of 67% and a specificity of 98% among men and a sensitivity of 80% and a specificity of 98% among women. For hypertension, as validated by measurement, researchers reported a sensitivity of 40% and a specificity of 87% among men and a sensitivity of 46% and a specificity of 87% among women. The study population (in upper New York State) was 99% white and thus precluded racial comparisons of validity. Another study reported higher sensitivity and specificity for self-reported hypertension among both blacks and whites (47). One study compared self-reported cigarette consumption with estimates of cigarette sales from excise taxes and indicated self-reported consumption to be approximately 72% of true consumption (48). Another study indicated that BRFSS accurately reported smoking status, but substantially underreported obesity (49). The prevalence estimates of self-reported health-risk behaviors in this analysis might be underestimated because data were collected through telephone interviews; previous studies indicate substantial differences in the characteristics of persons who reside in households without a telephone compared with those who reside in households with a telephone (50). One problem with the local use of BRFSS, apparent in this summary, is the small sample sizes for blacks in approximately half the states. Available information on blacks in BRFSS does not correspond precisely with state populations of blacks. For example, the 1994 black population of Hawaii was 29,000 (43), and BRFSS has prevalence data on overweight among black men in Hawaii; whereas in Ohio, which had a black population of 1,235,000 (43), BRFSS sample size for black men was not large enough to permit estimation of the prevalence of overweight. Achievement of reliable annual state information on blacks will require oversampling in states with small black populations. This additional information might facilitate understanding risk factors for cardiovascular disease among blacks and the design of appropriate prevention programs. The primary intended use of this risk factor atlas is as a reference. It might indicate regions of the nation that are in particular need of risk factor reduction and health promotion programs. The atlas might also serve as a baseline for the analysis of trends and the assessment of intervention programs. It might serve to assist in planning for future data collection efforts (e.g., demonstrating where alternative methods might be beneficial in collecting information previously unavailable or unanalyzable). Finally, the atlas might serve to generate hypotheses and stimulate the development of risk factor epidemiology, which explores the causes and consequences of risk factor distributions in the population. Understanding the determinants for risk factors might facilitate their control for public health. References
Table_1 Note: To print large tables and graphs users may have to change their printer settings to landscape and use a small font size.
TABLE 1. State-, race-, and sex-specific prevalence of selected characteristics -- Behavioral Risk Factor Surveillance System, 1994
===============================================================================================================================================================================
Overweight Physical inactivity Smoking
-------------------------------------------- ----------------------------------------------- -----------------------------------------
White Black White Black White Black
---------------------- ------------------- -------------------------- ------------------ ------------------- -------------------
State Men (%) Women (%) Men (%) Women (%) Men (%) Women (%) Men (%) Women (%) Men (%) Women (%) Men (%) Women (%)
-------------------------------------------------------------------------------------------------------------------------------------------------------------------------------
Alabama 28.5 26.9 37.9 45.0 42.0 45.7 42.8 58.6 26.1 20.5 22.2 11.3
Alaska 31.0 28.0 -- -- 20.6 21.7 -- -- 30.1 24.1 -- --
Arizona 28.7 20.5 -- -- 24.2 23.3 -- -- 21.6 25.1 -- --
Arkansas 32.7 26.0 40.3 37.0 33.2 36.1 32.4 47.0 29.4 24.9 31.9 15.8
California 27.2 23.1 36.8 37.4 16.2 22.3 26.4 38.9 20.6 16.6 20.0 12.5
Colorado 22.3 16.3 -- -- 14.6 17.1 -- -- 24.3 21.6 -- --
Connecticut 30.1 20.4 -- -- 16.9 24.6 -- 40.3 20.8 18.8 -- 24.6
Delaware 25.7 25.4 45.5 36.5 31.1 36.5 37.4 57.6 28.4 24.3 21.2 24.9
District of Columbia 12.8 10.6 22.2 41.7 42.4 38.9 50.3 56.3 15.4 7.3 18.6 16.5
Florida 25.3 22.2 35.6 36.6 23.7 29.1 34.4 43.0 26.8 22.9 18.2 16.6
Georgia 23.3 23.9 35.5 40.9 30.5 33.4 25.5 43.2 25.9 22.6 19.4 15.5
Hawaii 21.5 17.6 52.6 33.7 12.8 15.0 20.4 26.4 20.9 20.1 34.1 28.6
Idaho 29.0 28.8 -- -- 22.0 21.8 -- -- 18.7 19.8 -- --
Illinois 29.9 24.7 37.4 42.6 31.8 33.4 29.0 47.6 25.9 22.9 28.7 24.5
Indiana 30.1 28.5 39.9 54.5 25.0 32.7 34.6 45.6 27.9 23.1 26.6 20.6
Iowa 30.4 28.1 -- -- 35.6 31.0 -- -- 21.8 20.0 -- --
Kansas 28.5 19.1 -- -- 34.1 33.9 -- -- 23.9 20.1 -- --
kentucky 29.9 28.4 -- 54.9 45.2 46.9 -- 45.2 29.9 27.6 -- 21.7
Louisiana 25.5 25.3 31.4 46.4 30.6 34.7 30.2 39.0 28.9 23.6 35.1 16.3
Maine 29.8 27.5 -- -- 42.9 38.8 -- -- 25.1 22.4 -- --
Maryland 27.6 23.8 34.5 41.2 26.7 29.8 30.6 41.7 21.1 20.1 25.4 18.3
Massachusetts 28.6 20.1 -- 37.2 22.1 24.6 -- 34.9 22.4 19.8 -- 19.8
Michigan 31.9 27.6 37.2 51.6 19.5 24.3 20.2 39.2 24.8 25.9 22.6 20.8
Minnesota 29.6 24.9 -- 39.4 21.3 21.9 -- 19.2 21.4 21.3 -- 25.1
Mississippi 29.4 24.5 46.1 46.1 35.5 36.7 37.8 46.8 27.9 20.6 26.2 13.1
Missouri 33.0 27.2 -- 33.6 27.4 34.4 -- 46.2 26.9 21.3 -- 30.7
Montana 27.8 24.9 -- -- 21.3 20.0 -- -- 21.8 21.3 -- --
Nebraska 32.7 25.9 -- -- 26.7 21.5 -- -- 19.8 18.0 -- --
Nevada 31.2 23.8 -- -- 18.6 24.1 -- -- 32.1 26.8 -- --
New Hampshire 27.8 23.0 -- -- 22.9 27.4 -- -- 24.0 21.2 -- --
New Jersey 28.3 21.3 29.6 49.7 28.3 33.1 20.2 45.9 22.2 24.2 28.8 26.6
New Mexico 23.7 18.4 -- -- 14.8 21.4 -- -- 19.5 24.1 -- --
New York 28.5 24.3 32.6 42.5 32.5 36.3 34.7 50.9 22.8 20.6 23.5 19.1
North Carolina 32.0 25.9 37.6 48.2 38.8 39.9 49.6 62.9 29.5 25.5 37.9 22.5
North Dakota 30.2 23.8 -- -- 34.2 29.5 -- -- 19.9 19.5 -- --
Ohio 30.3 26.8 -- 47.3 41.1 35.9 -- 41.7 27.6 25.3 -- 25.4
Oklahoma 24.8 24.6 -- 34.5 27.6 30.9 -- 27.9 24.6 21.5 -- 30.7
Oregon 26.4 26.3 -- -- 20.8 21.0 -- -- 21.4 20.8 -- --
Pennsylvania 30.9 27.6 27.3 49.1 22.0 28.8 20.2 39.7 24.8 23.1 24.5 31.6
Rhode Island 25.8 23.7 -- -- 22.1 30.4 -- -- 23.9 21.0 -- --
South Carolina 25.1 25.1 39.7 49.1 28.4 29.5 31.6 43.3 30.4 21.9 21.8 15.5
South Dakota 28.1 27.7 -- -- 29.1 31.9 -- -- 20.1 19.8 -- --
Tennessee 26.8 25.4 27.9 46.2 38.6 39.9 37.6 47.9 28.8 26.0 24.1 21.6
Texas 33.1 24.9 -- 51.6 24.6 27.9 -- 32.6 23.4 20.7 -- 19.4
Utah 21.6 26.3 -- -- 18.2 22.9 -- -- 16.7 14.2 -- --
Vermont 26.2 24.8 -- -- 23.0 23.6 -- -- 23.3 22.0 -- --
Virginia 28.3 20.4 46.4 39.0 18.4 23.1 31.4 33.0 27.5 23.6 28.4 22.6
Washington 26.8 25.6 -- -- 16.2 19.4 -- -- 23.9 19.4 -- --
West Virginia 32.2 31.0 -- -- 43.2 47.3 -- -- 27.7 26.8 -- --
Wisconsin 35.7 26.7 26.7 45.0 27.4 23.5 26.3 39.8 24.0 22.3 19.7 31.4
Wyoming 31.0 22.8 -- -- 21.8 19.8 -- -- 20.7 21.9 -- --
Median 28.5 24.9 37.0 42.6 26.7 29.5 31.5 43.1 24.0 21.6 24.3 21.2
Low 12.8 10.6 22.2 33.6 12.8 15.0 20.2 19.2 15.4 7.3 18.2 11.3
High 35.7 31.0 52.6 54.9 45.2 47.3 50.3 62.9 32.1 27.6 37.9 31.6
===============================================================================================================================================================================
TABLE 1. State-, race-, and sex-specific prevalence of selected characteristics -- Behavioral Risk Factor Surveillance System, 1994 -- Continued
============================================================================================================================================================================================
Hypertension* Diabetes Mellitus Multiple Risk Factors
-------------------------------------------- ------------------------------------------------ --------------------------------------------------
White Black White Black White Black
----------------------- ------------------ ------------------------- -------------------- --------------------------- ---------------------
State Men (%) Women (%) Men (%) Women (%) Men (%) Women (%) Men (%) Women (%) Men (%) Women (%) Men (%) Women (%)
--------------------------------------------------------------------------------------------------------------------------------------------------------------------------------------------
Alabama 19.1 18.0 20.7 31.1 3.5 2.7 2.1 6.2 26.6 25.5 28.4 36.2
Alaska 14.8 20.4 -- -- 3.2 2.8 -- -- 19.9 17.7 -- --
Arizona 21.1 21.0 -- -- 4.5 2.8 -- -- 19.4 15.3 -- --
Arkansas -- -- -- -- 4.1 5.4 6.0 12.5 26.8 24.0 29.7 33.6
California 19.2 22.5 30.4 35.8 4.0 3.3 6.9 8.6 14.7 13.7 19.6 25.2
Colorado 15.6 19.4 -- -- 3.5 2.6 -- -- 13.5 10.7 -- --
Connecticut 21.3 23.9 -- 29.5 3.8 5.4 -- 6.7 14.5 13.7 -- 29.6
Delaware 19.4 20.9 29.5 30.8 5.0 4.4 13.4 8.2 23.6 23.0 35.7 39.4
District of Columbia 13.0 15.4 22.1 25.9 2.7 1.9 5.0 5.7 15.6 9.2 23.1 36.6
Florida 19.7 21.6 31.8 32.7 5.0 4.2 7.6 6.4 17.7 18.3 24.6 29.9
Georgia 15.9 17.4 21.2 27.1 3.1 3.3 6.7 9.6 21.3 20.7 19.5 27.3
Hawaii 14.5 16.4 27.6 25.7 2.7 2.5 0.5 6.6 11.1 9.0 31.4 24.1
Idaho 14.3 22.9 -- -- 3.9 4.6 -- -- 17.5 16.4 -- --
Illinois 18.5 20.1 24.4 29.3 5.0 4.1 7.9 10.8 25.4 21.2 31.7 39.1
Indiana 21.0 27.3 24.2 34.1 4.1 4.5 2.0 6.1 21.8 22.0 28.6 37.7
Iowa 20.0 21.2 -- -- 3.5 4.7 -- -- 24.8 21.1 -- --
Kansas 18.2 23.9 -- -- 4.8 3.1 -- -- 25.4 17.5 -- --
kentucky 23.5 26.7 -- 30.3 3.4 4.8 -- 6.3 32.0 30.9 -- 35.0
Louisiana 19.4 19.6 17.9 30.9 5.0 3.2 5.2 9.3 22.4 22.6 24.8 32.4
Maine 20.7 22.8 -- -- 3.3 3.9 -- -- 29.1 23.5 -- --
Maryland 17.1 20.1 19.6 30.4 4.5 4.2 6.3 7.1 18.2 18.8 24.2 30.9
Massachusetts 19.3 21.4 -- -- 3.5 3.5 -- 18.2 17.6 15.4 -- 32.4
Michigan 24.0 21.7 28.4 27.1 4.0 5.3 3.5 4.7 18.9 20.7 19.6 32.3
Minnesota 20.7 22.7 -- -- 3.5 4.0 -- 4.5 18.6 16.2 -- 17.1
Mississippi 21.2 24.9 30.7 44.8 5.3 3.2 6.6 10.4 27.6 19.4 36.4 32.7
Missouri 22.0 23.7 -- 38.9 5.7 5.1 -- 11.6 24.1 21.0 -- 37.1
Montana 19.4 21.4 -- -- 2.0 2.2 -- -- 16.2 16.0 -- --
Nebraska 20.3 20.6 -- -- 3.9 5.4 -- -- 19.5 14.8 -- --
Nevada 21.4 21.1 -- 30.5 4.9 3.1 -- -- 19.6 17.7 -- --
New Hampshire 19.9 19.8 -- -- 4.3 4.5 -- -- 18.8 17.8 -- --
New Jersey 24.9 18.8 -- 24.9 4.8 3.2 5.9 -- 22.5 19.2 18.2 32.8
New Mexico 15.0 14.3 -- -- 4.9 4.1 -- -- 13.6 13.5 -- --
New York 20.5 19.2 19.2 38.5 3.4 3.5 7.1 6.8 20.2 20.9 24.4 33.9
North Carolina 19.0 17.3 13.0 27.5 4.2 3.4 5.5 6.1 30.5 25.9 39.7 42.9
North Dakota 17.3 21.4 -- -- 3.9 3.3 -- -- 22.6 17.4 -- --
Ohio 18.1 22.4 -- 32.6 3.8 5.2 -- 6.4 28.9 23.2 -- 34.9
Oklahoma 20.8 25.3 -- -- 2.4 2.9 -- 3.3 19.5 18.5 -- 26.0
Oregon 18.9 21.0 -- -- 4.0 3.5 -- -- 17.6 15.7 -- --
Pennsylvania 22.8 22.1 23.5 31.0 4.8 4.9 7.5 12.2 18.7 21.3 16.0 39.7
Rhode Island 23.4 22.1 -- -- 4.4 4.7 -- -- 18.4 18.3 -- --
South Carolina 18.5 24.7 27.1 34.4 6.2 4.3 6.9 8.2 22.3 18.7 27.5 30.5
South Dakota 15.5 19.3 -- -- 4.9 3.2 -- -- 19.6 19.5 -- --
Tennessee 20.5 24.0 24.7 27.4 4.9 4.9 6.4 11.0 28.7 26.1 21.3 38.1
Texas 17.3 18.8 24.8 29.1 5.5 4.7 -- 1.1 22.4 17.9 -- 26.4
Utah 16.9 20.4 -- -- 4.1 3.6 -- -- 13.5 13.3 -- --
Vermont 19.6 19.2 -- -- 3.6 4.2 -- -- 17.8 18.1 -- --
Virginia 16.9 19.7 25.2 37.2 2.9 3.7 5.6 12.6 18.8 15.8 32.5 31.4
Washington 19.2 19.9 -- -- 4.1 3.6 -- -- 15.4 14.0 -- --
West Virginia 22.9 24.5 -- -- 4.2 6.1 -- -- 28.2 33.1 -- --
Wisconsin 20.2 19.3 -- -- 3.7 2.6 4.5 4.1 20.0 18.0 21.7 34.2
Wyoming -- -- -- -- 3.1 3.2 -- -- 17.3 15.1 -- --
Median 19.4 21.0 24.6 30.7 4.0 3.7 6.1 6.8 19.6 18.3 24.7 32.8
Low 13.0 14.3 13.0 24.9 2.0 1.9 0.5 1.1 11.1 9.0 16.0 17.1
High 24.9 27.3 31.8 44.8 6.2 6.1 13.4 18.2 32.0 33.1 39.7 42.9
============================================================================================================================================================================================
TABLE 1. State-, race-, and sex-specific prevalence of selected characteristics -- Behavioral Risk Factor Surveillance System,
1994 -- Continued
==================================================================================================================================
Weight Loss Smoking Cessation
------------------------------------------- --------------------------------------------------
White Black White Black
--------------------- -------------------- --------------------------- --------------------
State Men (%) Women (%) Men (%) Women (%) Men (%) Women (%) Men (%) Women (%)
----------------------------------------------------------------------------------------------------------------------------------
Alabama 84.4 92.3 81.7 90.0 45.1 38.8 35.5 36.5
Alaska 90.5 94.1 -- -- 29.6 36.3 -- --
Arizona 83.8 89.2 -- -- 44.3 27.6 -- --
Arkansas 80.8 88.2 83.7 82.0 45.9 37.2 -- --
California 90.9 93.4 88.5 94.7 49.3 51.9 -- --
Colorado 89.4 92.7 -- -- 49.1 41.6 -- --
Connecticut 80.6 89.3 -- -- 53.4 53.3 -- --
Delaware 76.9 84.3 77.5 78.5 45.6 46.4 39.7 34.7
District of Columbia 82.0 82.5 67.3 81.2 40.7 58.3 30.6 32.7
Florida 84.5 88.7 83.5 89.1 48.7 47.1 38.5 29.9
Georgia 81.7 87.4 85.8 88.2 31.7 28.7 31.6 26.1
Hawaii 87.4 94.0 90.5 89.9 54.2 45.7 16.4 28.0
Idaho 81.5 91.5 -- -- 31.8 23.1 -- --
Illinois 81.4 88.9 83.3 82.1 31.4 23.5 22.1 17.9
Indiana 87.0 91.5 -- 93.4 45.7 38.4 -- --
Iowa 80.6 90.2 -- -- 36.3 29.1 -- --
Kansas 87.0 91.3 -- -- 46.5 37.9 -- --
kentucky 80.3 90.0 -- 88.4 39.7 31.7 -- --
Louisiana 76.7 88.1 81.1 83.5 48.1 38.4 27.7 36.2
Maine 84.4 91.3 -- -- 37.8 34.7 -- --
Maryland 85.2 92.4 85.3 90.2 48.9 45.1 32.2 37.8
Massachusetts 91.1 92.7 -- -- 47.9 48.0 -- --
Michigan 87.5 91.6 88.5 89.8 48.2 39.4 -- 33.4
Minnesota 85.0 89.2 -- -- 51.6 44.5 -- --
Mississippi 71.2 85.2 68.6 86.7 48.2 39.2 33.2 22.0
Missouri 85.3 87.9 -- 82.3 47.7 42.4 -- --
Montana 85.7 88.9 -- -- 44.5 35.5 -- --
Nebraska 83.6 90.2 -- -- 53.1 41.0 -- --
Nevada 79.5 90.2 -- -- 41.9 38.2 -- --
New Hampshire 87.6 92.6 -- -- 47.8 44.4 -- --
New Jersey 83.1 88.0 -- 83.6 49.1 41.6 -- --
New Mexico 82.7 88.2 -- -- 54.9 40.3 -- --
New York 81.5 87.0 77.0 84.2 47.6 43.4 -- 28.0
North Carolina 77.2 86.5 68.6 82.0 43.4 37.6 25.2 21.9
North Dakota 80.9 89.4 -- -- 54.4 41.1 -- --
Ohio 70.8 88.7 -- 86.7 33.2 22.9 -- --
Oklahoma 75.7 82.6 -- 80.1 36.4 38.6 -- --
Oregon 86.0 92.0 -- -- 56.0 46.7 -- --
Pennsylvania 87.6 92.9 91.1 90.1 50.2 42.2 41.1 26.2
Rhode Island 88.4 90.3 -- -- 50.4 49.2 -- --
South Carolina 74.2 81.6 76.5 79.0 13.4 21.2 23.9 14.8
South Dakota 83.8 89.9 -- -- 52.8 37.1 -- --
Tennessee 82.2 87.6 84.1 83.9 35.5 30.1 26.2 31.1
Texas 85.6 90.4 -- 75.2 49.4 38.8 -- --
Utah 88.6 93.0 -- -- 42.8 32.3 -- --
Vermont 82.5 89.2 -- -- 51.6 45.7 -- --
Virginia 85.1 90.0 87.2 95.3 44.2 38.9 35.8 23.2
Washington 87.5 90.9 -- -- 51.4 50.7 -- --
West Virginia 79.3 87.9 -- -- 35.1 23.8 -- --
Wisconsin 88.7 92.0 -- 85.8 50.1 44.5 -- 22.6
Wyoming 87.3 93.7 -- -- 33.5 27.2 -- --
Median 83.8 90.0 83.5 85.8 47.6 38.9 31.6 28.0
Low 70.8 81.6 67.3 75.2 13.4 21.2 16.4 14.8
High 91.1 94.1 91.1 95.3 56.0 58.3 41.1 37.8
==========================================================================================================================================
Return to top. Figure_1A  Return to top. Figure_1B 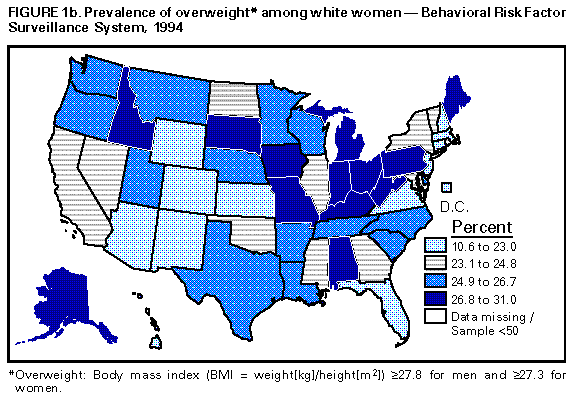 Return to top. Figure_1C 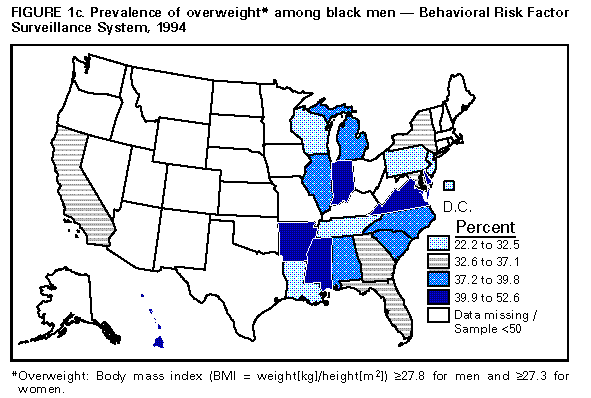 Return to top. Figure_1D  Return to top. Figure_2A 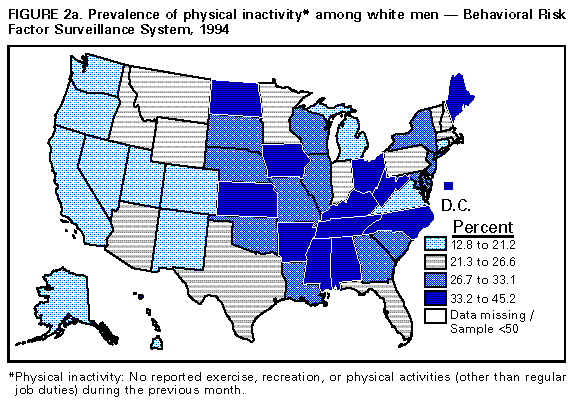 Return to top. Figure_2B 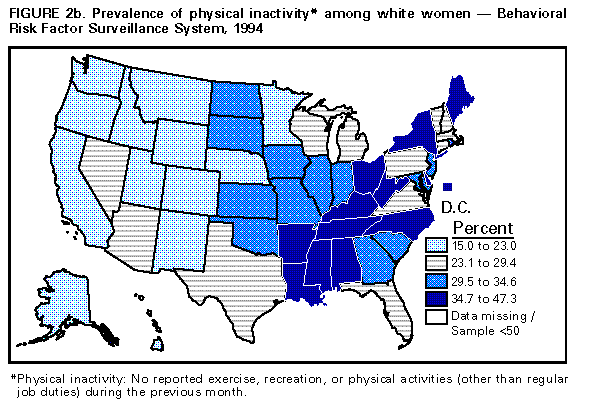 Return to top. Figure_2C 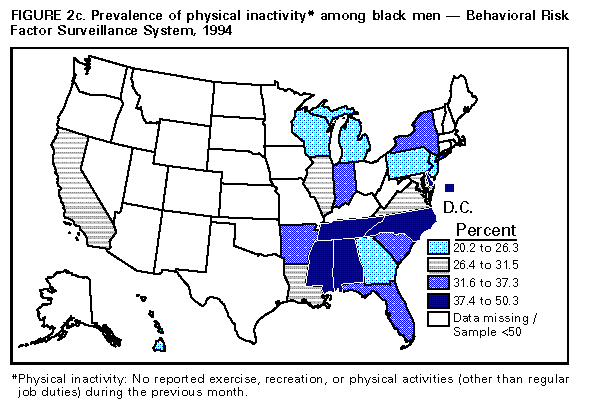 Return to top. Figure_2D  Return to top. Figure_3A 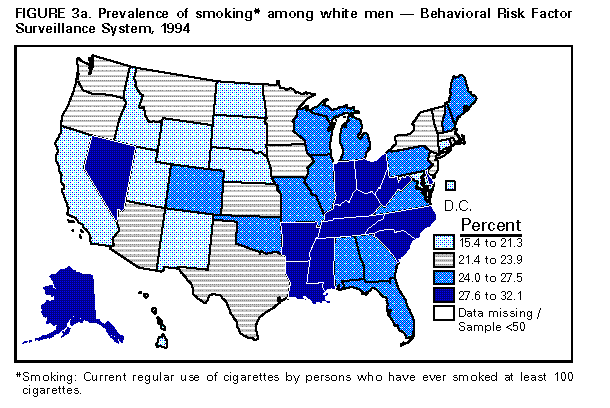 Return to top. Figure_3B 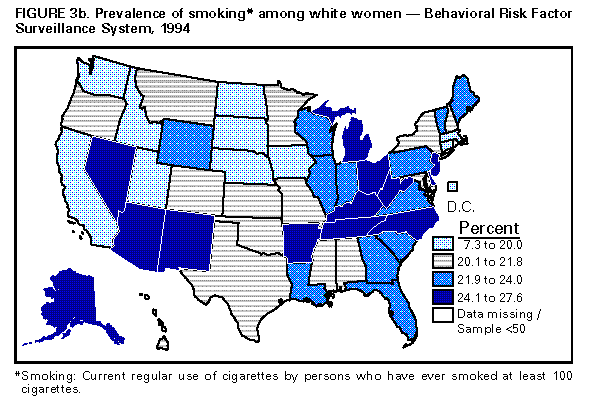 Return to top. Figure_3C 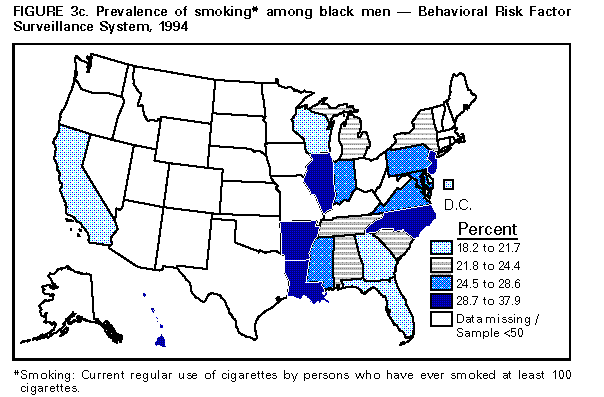 Return to top. Figure_3D 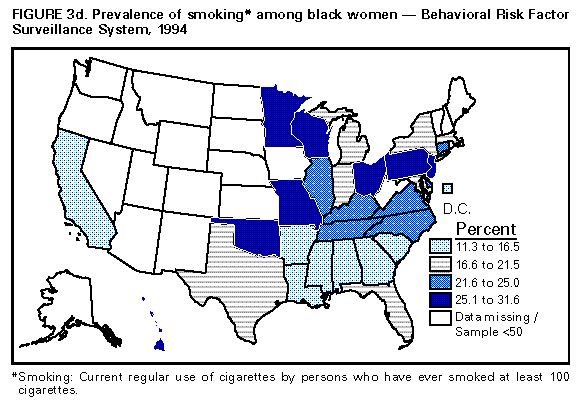 Return to top. Figure_4A 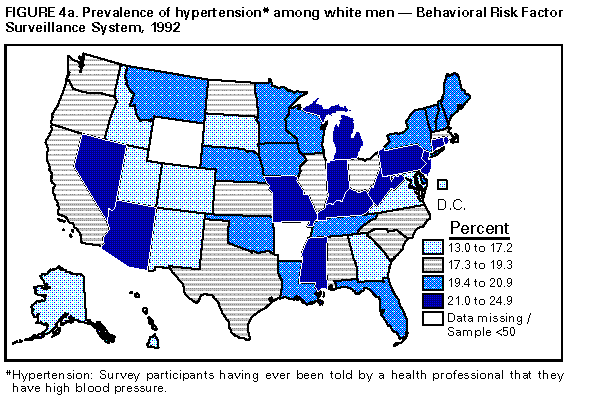 Return to top. Figure_4B 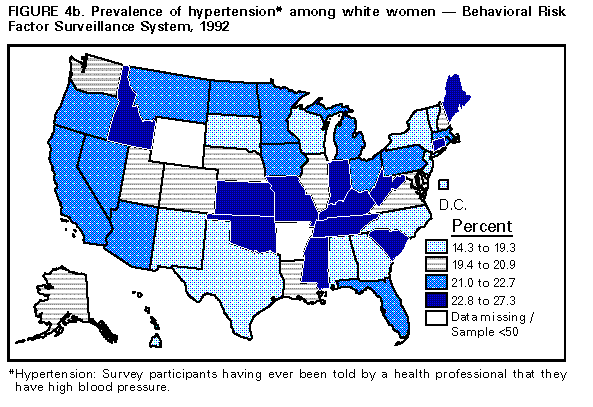 Return to top. Figure_4C 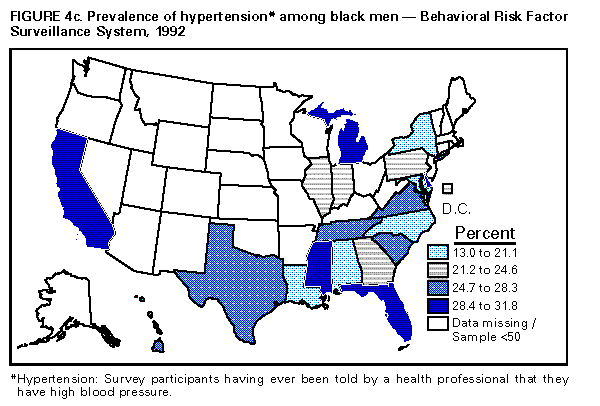 Return to top. Figure_4D 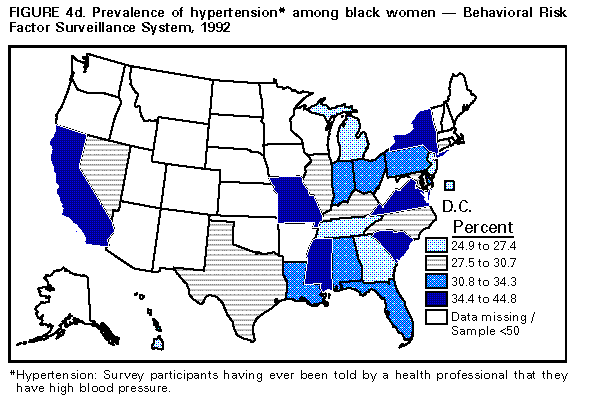 Return to top. Figure_5A 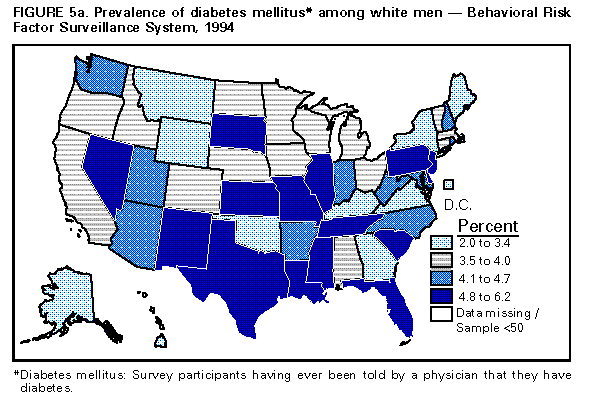 Return to top. Figure_5B  Return to top. Figure_5C 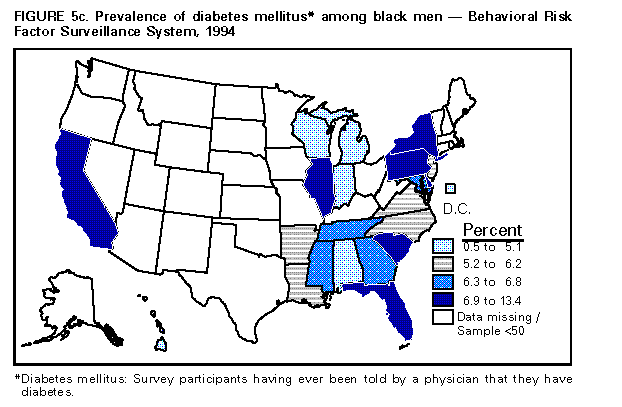 Return to top. Figure_5D  Return to top. Figure_6A 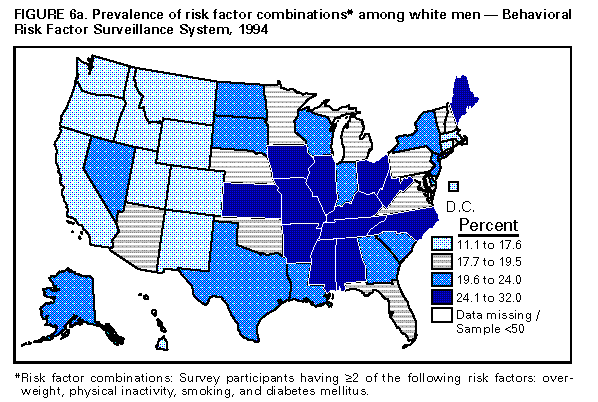 Return to top. Figure_6B 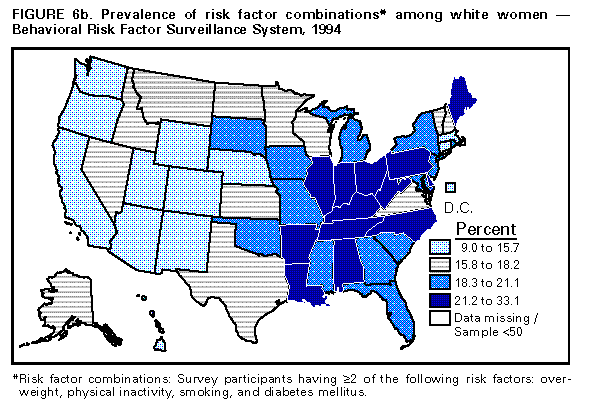 Return to top. Figure_6C  Return to top. Figure_6D  Return to top. Figure_7A 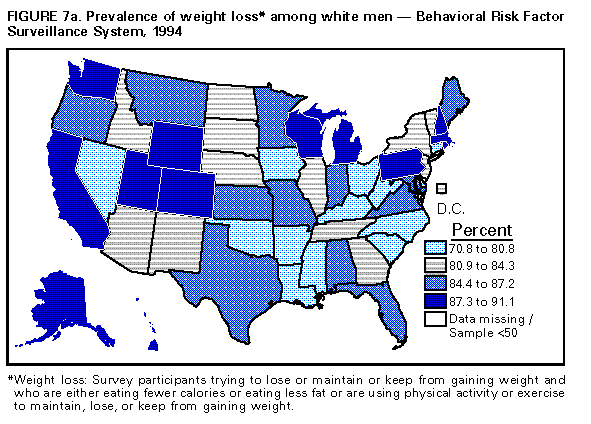 Return to top. Figure_7B 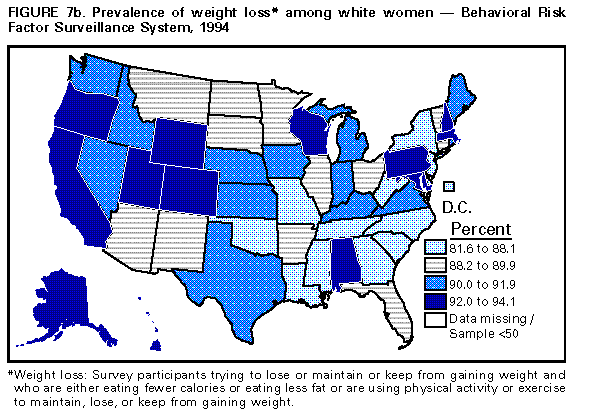 Return to top. Figure_7C 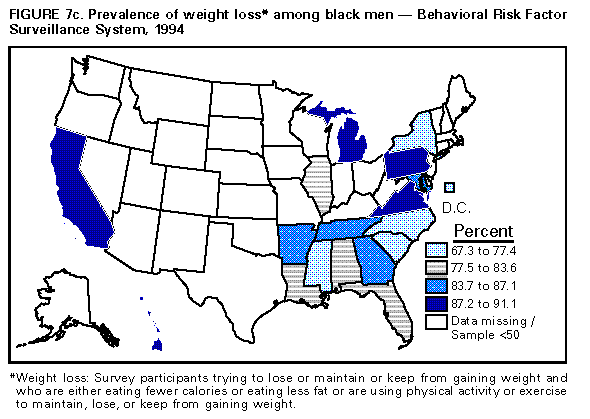 Return to top. Figure_7D 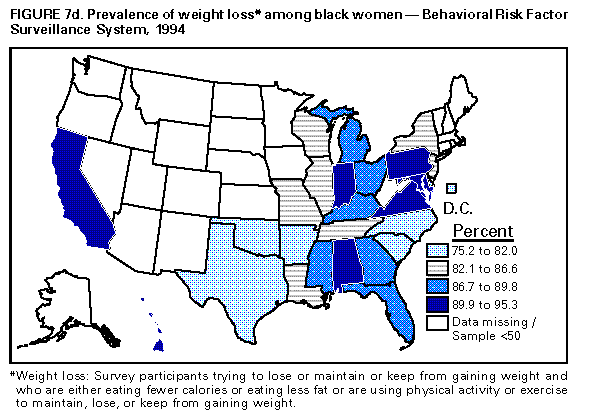 Return to top. Figure_8A 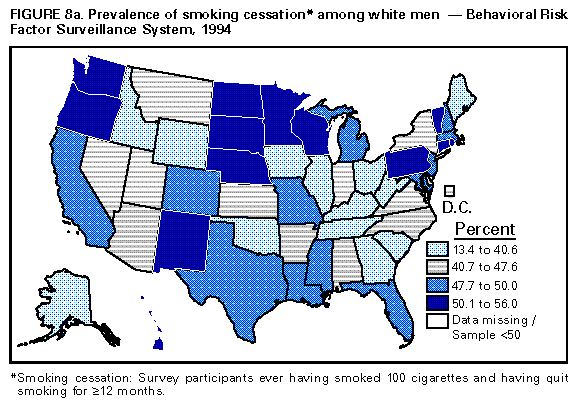 Return to top. Figure_8B  Return to top. Figure_8C 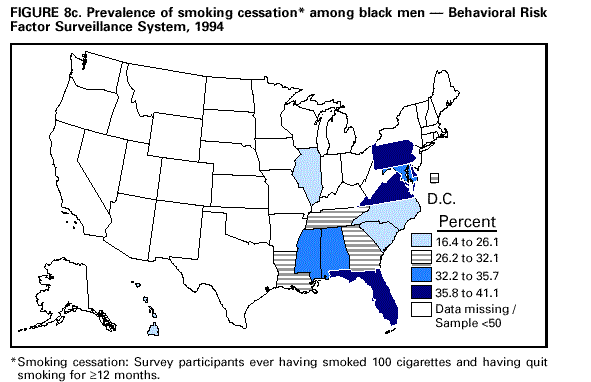 "> ">Return to top. Figure_8D  Return to top. Disclaimer All MMWR HTML versions of articles are electronic conversions from ASCII text into HTML. This conversion may have resulted in character translation or format errors in the HTML version. Users should not rely on this HTML document, but are referred to the electronic PDF version and/or the original MMWR paper copy for the official text, figures, and tables. An original paper copy of this issue can be obtained from the Superintendent of Documents, U.S. Government Printing Office (GPO), Washington, DC 20402-9371; telephone: (202) 512-1800. Contact GPO for current prices. **Questions or messages regarding errors in formatting should be addressed to mmwrq@cdc.gov.Page converted: 12/14/98 |
|||||||||
This page last reviewed 5/2/01
|