 |
|
|
|
|
|
|
| ||||||||||
|
|
|
|
|
|
|
||||
| ||||||||||
|
|
|
|
|
Persons using assistive technology might not be able to fully access information in this file. For assistance, please send e-mail to: mmwrq@cdc.gov. Type 508 Accommodation and the title of the report in the subject line of e-mail. Trends in Infant Mortality Attributable to Birth Defects -- United States, 1980-1995Infant mortality has declined in the United States because of advances in public health and clinical medicine. Birth defects are the leading cause of infant mortality (1), but infant mortality attributable to birth defects (IMBD) has not declined as rapidly as overall infant mortality. From 1968 to 1995, the proportion of IMBD increased from 14.5% to 22.2% (2,3). To help focus efforts to reduce IMBD, CDC examined trends in IMBD, highlighting demographic, geographic, and defect-specific mortality rates. This report summarizes the results of this analysis, which indicate variation in rates for IMBD by sex, race/ethnicity, and state of residence. The underlying cause-of-death for all infants (children aged less than 1 year) was obtained from U.S. public-use, multiple-cause mortality data tapes maintained by CDC. Birth defects in this study were classified according to the International Classification of Diseases, Clinical Modification, Ninth Revision, codes 740-759. The number of live births per year by the child's race and sex and mother's state of residence (including the District of Columbia) was determined from published natality statistics. The number of live births was 3,612,258 in 1980 and 3,899,589 in 1995 (3). Only births and deaths to U.S. residents were included in the analyses. During 1980-1995, IMBD declined 34.2%, and overall infant mortality declined 39.8% (Table_1). The proportion of overall infant mortality caused by birth defects increased from 20% to 22%. Among females, the decrease in IMBD was greater and the rate of IMBD was lower than among males. Among whites and Asians/Pacific Islanders, the decreases in IMBD were greater than those among blacks and American Indians/ Alaskan Natives. As a result, by 1995, the gap between IMBD in whites and in both blacks and American Indians/Alaskan Natives increased. The decline in IMBD varied by organ system (Table_2). Deaths associated with defects of the cardiovascular, central nervous, musculoskeletal, genitourinary, and digestive systems declined substantially. Deaths associated with trisomies 13 and 18, reduction defects of the brain, and defects of the respiratory system increased. From 1980 to 1995, IMBD declined in every state and the District of Columbia; however, IMBD was consistently higher in the South and parts of the Midwest than in other regions (Figure_1). This geographic variation persisted when the analysis was restricted by race. Hawaii, Maryland, Oregon, and Vermont had the greatest decline in IMBD, moving from the highest category (2.7-3.2 per 1000 live-born infants) to the lowest (1.1-1.4). Reported by: J Petrini, K Damus, RB Johnston, Jr, March of Dimes Birth Defects Foundation, White Plains, New York. National Center for Health Statistics; Birth Defects and Genetic Diseases Br, Div of Birth Defects and Developmental Disabilities, National Center for Environmental Health, CDC. Editorial NoteEditorial Note: The findings in this report document a large decline in IMBD but substantial variations in IMBD across populations and geographic areas. Efforts to reduce IMBD should focus on identifying reasons for these variations. The causes of most birth defects are unknown, and the causes of deaths from birth defects require further study. Cardiovascular defects are the single largest contributor to IMBD. The largest specific cause of cardiovascular IMBD was hypoplastic left heart syndrome, the rate of which declined slightly during 1980-1995. Other important causes of cardiovascular IMBD (e.g., transposition of the great vessels and ventricular septal defect) declined substantially, probably because of improvements in treatment. The second largest contributor to IMBD was central nervous system defects. The birth prevalence of these defects is affected by primary prevention (e.g., increased intake of folic acid initiated before conception), changes in prenatal diagnosis patterns, and the availability and use of pregnancy termination services following a prenatal diagnosis of a serious defect. These factors probably account for some of the decline in anencephalus and hydrocephalus. IMBD attributable to reduction defects of the brain has increased dramatically, most likely because of increasing use of sophisticated imaging techniques that make diagnosis of this defect more common. The increase in IMBD attributable to chromosomal defects includes increases in both trisomies 13 and 18 and a decrease in trisomy 21. Increases in rates of trisomy 13 and 18 are probably a result of increased use of diagnostic karyotyping. In comparison, the decline in deaths attributed to trisomy 21 (Down syndrome) is probably related to improved treatment for the congenital heart defects that are the leading cause of deaths among these infants, and increased use of prenatal diagnosis. The increase in IMBD attributable to respiratory defects may be associated with an increasing use of the diagnostic code for lung agenesis/hypoplasia/dysplasia. IMBD attributable to musculoskeletal and digestive system defects has declined dramatically, most likely because of advances in surgical treatments. In one children's hospital, survival rates for infants with congenital diaphragmatic hernia improved from 42% during 1970-1983 to 79% during 1989-1997 (4). In Japan, esophageal atresia survival increased from an estimated 28% in the late 1950s and early 1960s to 80% since 1980 (5). Previous studies have documented substantial racial differences in the incidence of birth defects and IMBD (6,7), although the magnitude of these differences vary by the method of assigning the child's race (8). Higher IMBD in some racial/ethnic populations may reflect reduced access to perinatal and other health care associated with disadvantaged socioeconomic status and other factors that may affect mortality trends. Males consistently have higher rates of IMBD than females, probably because of the higher incidence of many birth defects among males (9). Poverty and access to health care also may affect geographic variations in IMBD. During 1995, 10 of the 12 states (83%) with IMBD greater than or equal to 1.9 per 1000 live-born infants were above the U.S. median for percent of population in poverty (10). In comparison, only six states would have been above the median if there was no relation between poverty and IMBD. The findings in this report are subject to at least two limitations. First, the reliability of data on IMBD is limited by the accuracy of demographic and cause-of-death data included on infant death certificates. In addition, changes in administrative and diagnostic practices also may affect the validity of the data. The correlation between poverty and high IMBD suggests that access to health-care services also may be an important factor limiting declines in IMBD. Unlike the effect of race and sex, the effect of poverty on IMBD can be changed. Improving access to perinatal and other preventive and health-care services is a key factor in reducing IMBD and overall infant mortality. References
Table_1 Note: To print large tables and graphs users may have to change their printer settings to landscape and use a small font size.
TABLE 1. Rate* of infant mortality attributable to birth defects (IMBD) and percent change
in IMBD and overall infant mortality, by sex and race/ethnicity -- United States, 1980 and 1995
===================================================================================================

                                              IMBD
                                   ----------------------------    % Change in infant
Characteristic                     1980      1995     % Change+         mortality
---------------------------------------------------------------------------------------------------
Sex
 Female                             2.4       1.6      -35.4%            -39.2%
 Male                               2.7       1.8      -33.0%            -40.2%
Race/Ethnicity
 White                              2.5       1.6      -35.1%            -42.1%
 Black                              2.7       2.0      -26.6%            -31.9%
 Asian/Pacific Islander             2.1       1.2      -42.5%            -42.9%
 American Indian/ Alaskan           2.5       2.0      -20.1%            -43.2%
Native&
 Hispanic@                          **        1.6++      **                **
Total                               2.6       1.7      -34.2%            -39.8%
---------------------------------------------------------------------------------------------------
*  Per 1000 live-born infants.
+  Percent change was based on the exact rates rather than the rounded rates presented here.
&  Two-year averages (1979-1980 and 1994-1995) are used because of small and unstable
   numbers in individual years.
@  The race groups white, black, American Indian/Alaskan Native, and Asian/Pacific Islander
   include persons of Hispanic origin, and persons of Hispanic origin may be of any race.
** Not calculated because only 22 states reported Hispanic origin on birth certificates in 1980.
++ Includes only the 50 reporting areas with Hispanic origin both on the birth certificate and
   death certificate in 1995.
===================================================================================================
Return to top. Table_2 Note: To print large tables and graphs users may have to change their printer settings to landscape and use a small font size.
TABLE 2. Rate* of infant mortality associated with birth defects, by specific organ
systems -- United States, 1980-1995
=======================================================================================
                                                            1980    1995   % Change+
---------------------------------------------------------------------------------------
Cardiovascular defects                                     105.5    58.8    - 44.3%
 Hypoplastic left heart syndrome                            14.3    13.6    -  4.7%
 Transposition of great vessels                              5.2     3.3    - 36.4%
 Ventricular septal defect                                   4.6     1.8    - 60.7%

Central nervous system defects                              46.7    21.9    - 53.1%
 Anencephalus                                               21.8     8.9    - 59.5%
 Congenital hydrocephalus                                    9.0     3.2    - 64.4%
 Reduction defects of brain                                  1.3     3.2     153.7%

Chromosomal defects                                         18.1    23.0      26.8%
 Trisomy 18                                                  7.2    10.0      39.0%
 Trisomy 13                                                  5.4     6.4      18.6%
 Trisomy 21 (Down syndrome)                                  3.4     2.3    - 33.7%

Respiratory defects                                         17.8    25.2      42.2%

Musculoskeletal defects                                     17.8    12.1    - 32.1%
 Anomalies of diaphragm                                     10.7     8.2    - 23.9%
 Anomalies of abdominal wall                                 1.9     0.9    - 51.0%
 Osteodystrophies                                            1.6     1.1    - 33.4%

Genitourinary defects                                       12.5    10.0    - 20.5%
 Renal agenesis/Dysgenesis/ Hypoplasia                       8.8     7.6    - 13.5%
 Cystic kidney disease                                       2.0     1.3    - 35.7%

Digestive system defects                                     8.0     2.2    - 71.9%
 Anomalies of gallbladder, bile ducts, and liver             2.4     0.5    - 79.0%
 Tracheoesophageal fistula, esophageal atresia, and          1.0     0.2    - 82.0%
 stenosis

All other defects                                           28.7    14.9    - 48.2%

Total                                                      255.2   168.1    - 34.2%
---------------------------------------------------------------------------------------
* Per 100,000 live-born infants.
+ Percent change was based on the exact rates rather than the rounded rates presented
  here.
=======================================================================================
Return to top. Figure_1 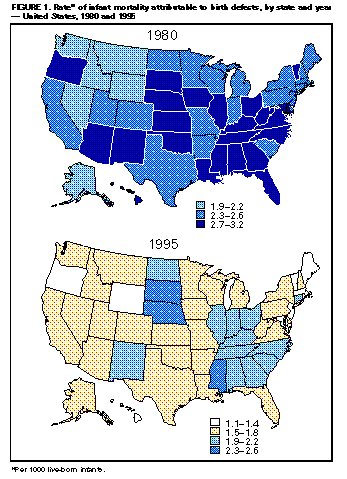 Return to top. Disclaimer All MMWR HTML versions of articles are electronic conversions from ASCII text into HTML. This conversion may have resulted in character translation or format errors in the HTML version. Users should not rely on this HTML document, but are referred to the electronic PDF version and/or the original MMWR paper copy for the official text, figures, and tables. An original paper copy of this issue can be obtained from the Superintendent of Documents, U.S. Government Printing Office (GPO), Washington, DC 20402-9371; telephone: (202) 512-1800. Contact GPO for current prices. **Questions or messages regarding errors in formatting should be addressed to mmwrq@cdc.gov.Page converted: 10/06/98 |
|||||||||
This page last reviewed 5/2/01
|